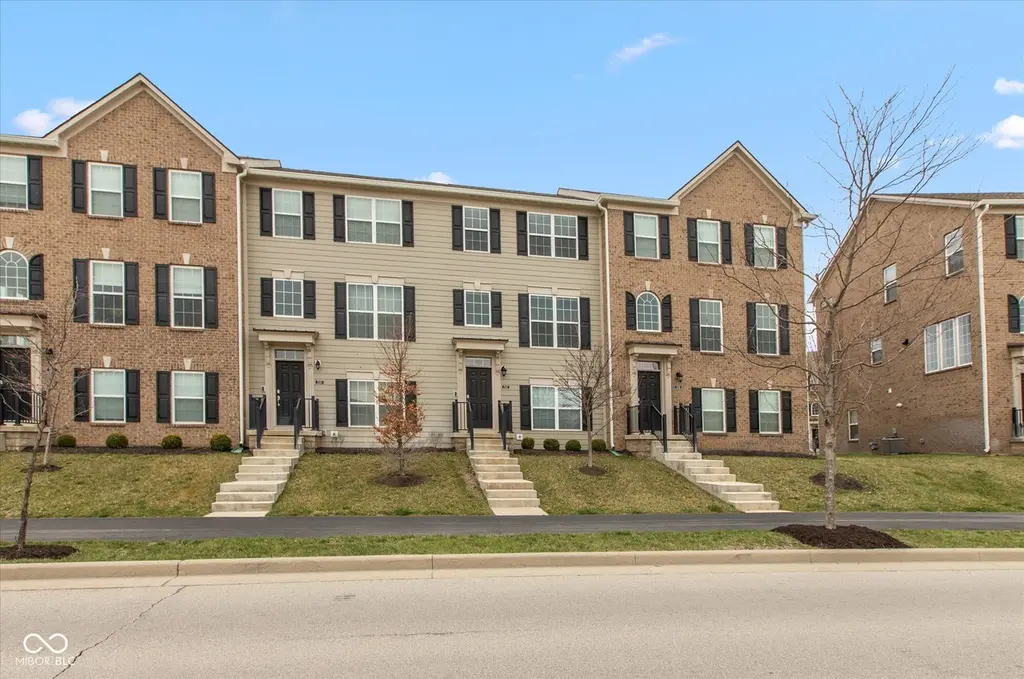
7247 Barker St · Carmel, IN
Flood risk 1/10 · Minimal
- FEMA flood zone
- X (unshaded)
- Chance of flooding over 30 yrs
- 0.0%
- Est. flood insurance / yr
- $507 – $1,088
Fire risk 1/10 · Minimal
- Est. fire insurance / yr
- $717 – $1,331
Heat risk 4/10 · Minor
- Hot days now (above 101°F)
- 7 days/yr
- Hot days in 30 yrs
- 18 days/yr
Wind risk 2/10 · Minimal
- Chance of severe wind over 30 yrs
- 1.0%
Air-quality risk 2/10 · Minimal
- Unhealthy air days now
- 1 days/yr
- Unhealthy air days in 30 yrs
- 1 days/yr
Risk factors via First Street. Map © Google.
Why this score? — see what drove the D- grade
The composite is a weighted blend of 9 inputs, each scored 0–100. Each bar is that input's sub-score; the figure is the points it added to the 100-point composite (weight × sub-score).
- Cash flow +9.2/30.0
- ARV discount +7.5/15.0
- Schools +6.4/10.0
- Rent growth +4.6/5.0
- Livability +4.2/5.0
- DSCR +2.6/10.0
- Condition / age +2.5/5.0
- 1% rule +2.4/10.0
- Appreciation +0.0/10.0
$349,900
🖨 Deal sheet 📄 Offer letter ✓ Due diligence
Listing remarks MLS
The Lockerbie plan has an open concept kitchen with a large island and 42’’ cabinets. Three bedrooms and a laundry room are all on the third floor. The finished lower level has an included half bathroom. Enjoy an extended deck off the back for outdoor enjoyment. Lawn Maintenance and Snow Removal are included! Smart Home Technology w/support by Amazon and voice control by Alexa delivers connectivity, safety and convenience, while Lennar’s Everything’s Included® experience ensures that you don’t have to compromise on luxury features. Come check out this floorplan today! Photos shown may be an artist rendering, model home, or of the same model but located in a different Lennar subdivision due to current construction stage.
Key facts
- Open floor plan
- Large shower
- Walk-in closet
Tags
Property features AI
Finance
- Other: Ownership interest type: mandatory fee
- HOA & community: HOA with management; Quarterly HOA fee (approx. $245) that covers entrance common, lawn care, management, and association homeowners; HOA disclosures include rental restrictions; Community amenities: playground, pool, sidewalks, street lights; 2+ common walls
Exterior
- Parking: Attached 1-car garage (approx. 380 sq ft)
- Utilities: Public water; Municipal sewer connection; 200+ amp electric service; Solid waste service available
- Home design: Residential condominium with attached property; Horizontal condo with private entry to the building; Faces south; Three or more levels
- Construction: Cement siding; Slab foundation
- Exterior features: Deck; Balcony
Interior
- Kitchen: Dishwasher; Gas oven; Microwave with hood; Refrigerator
- Bedrooms: 3 bedrooms on the upper level; primary bedroom includes a walk-in closet
- Bathrooms: 2 full bathrooms; 2 half bathrooms; Primary bathroom features a full shower stall and double sinks
- Heating & cooling: Forced air heating; Central air conditioning
- Interior features: High ceilings; Walk-in closet(s)
- Laundry & utility: Washer; Dryer; Gas water heater
Neighborhood map
What this means for you Summary
Snapshot
- This is a 3-bed/3.0-bath condo listed at $350k.
Deal economics
- At list price, monthly cash flow is $-262 ($-3k/yr) — negative.
- To cash-flow at today's rent, offer at most $304k (13.2% below list).
- To meet the 1% rule (rent ≥ 1% of price), the offer needs to be $260k (25.6% below list).
- Recommended offer: $260k (25.6% below list) — sets the bar for 1% rule.
- Cap rate 5.4% vs local median 2.7% in Carmel — top-decile yield for the area; either an underpriced asset or a hidden risk that comps aren't pricing in. Stress-test before assuming the spread holds.
Location & tenants
- Location reads 84/100 on livability (#7 in IN, #726 nationally) — a professional / high-income tenant draw. Strengths: crime A+, amenities A+, employment A+; Watch: commute F.
- Carmel Clay Schools (urban): math 68% / reading 70% proficiency, ranked #1 of 301 in IN (top 0%) — acceptable for families but not a draw, mixed tenant base, ~2y average lease; only 7% free/reduced lunch — higher-income household profile.
- Zoned schools: Prairie Trace Elementary School (math 80% / reading 68%, grade A, #20 of 994 statewide, top 2%, 697 students, 10% FRL); Carmel High School (math 77% / reading 90%, grade A, #3 of 369 statewide, top 1%, 5,192 students, 13% FRL) — zoned schools at 11% FRL track the district average.
- Market conditions: Rents rising fast (+8.4%/yr); 193 active listings in the ZIP; 19 comparable units currently listed for rent nearby; rentals leasing fast (median 2d on market — plan ~1-2 weeks tenant-placement turnaround); high-income renter base; 4,661 units permitted in Hamilton County in 2024 (1,528 in 5+ unit buildings).
Forward outlook
- Local home prices are declining (-3.0%/yr); year-one equity from $2k of loan paydown is wiped out by about $10k of value loss. Plan a longer hold.
- Hamilton County population projected at +44% by 2050 — long-run rental-demand tailwind backs the buy-and-hold thesis.
Negotiation context
- Only 6 days on market — expect competitive offers; lowballing is unlikely to land.
- 3 sale attempts since 7y ago with the ask held roughly flat each time — persistent listings suggest the price (not the market) is what's stuck; bring a comps-based counter.
- Current owner paid $244k; 43% above their basis — modest negotiation headroom, anchor on the comps not their cost.
Questions for the listing agent
- What do current leases actually rent for vs. the listed asking? Can we see a recent rent roll and the last 12 months of T-12 income?
- What does the HOA fee cover, when was the last increase, and are there any pending special assessments or reserve-fund shortfalls?
- Any open or pending special assessments — roof, HVAC, plumbing, elevator, façade? What's the per-unit balance and payoff schedule, and is the seller paying it off at close or rolling it to the buyer?
- Is there a deadline driving the sale (1031 exchange, divorce, estate, relocation)? That informs how much negotiation room exists.
- Schools are A-rated — typically a magnet for longer-tenancy family renters. What's the average tenant stay here, and is there a school-zone premium baked into asking?
- The area grade is low — what's the realistic commute time and amenity access for the typical tenant pool here? Any planned neighborhood developments (good or bad) we should know about?
- What's the average days-on-market for RENTAL listings here right now (not sales)? A rising rental-DOM trend means longer vacancies and softer asking-rent achievability than the comps imply.
- What's the recent tenant-quality profile in this submarket — average credit score on applications, eviction rate, late-payment / NSF rate, and stable-employment percentage? A property-management company in the area should have these aggregated.
- How much new apartment / multifamily construction is in the pipeline within 1–3 miles? Heavy new supply (>2% of stock underway) typically softens rents 12–24 months out; light construction supports rent growth.
Investment metrics
- 1% rule
- 0.74% ✗
- Cap rate
- 5.39%
- Cash-on-cash
- -3.21%
- DSCR
- 0.86
- GRM
- 11.2
CMA / ARV
No comps found within radius.
Projected returns pro-forma
-3.0% appreciation · 8.0% rent growth · sell at horizon
- IRR
- -16.5%
- Equity multiple
- 0.39×
- Total profit
- $-59,654
- Equity at exit
- $52,171
- IRR
- -1.3%
- Equity multiple
- 0.89×
- Total profit
- $-10,921
- Equity at exit
- $30,253
Cash invested: $97,972 (down + closing). Projections, not guarantees.
Landlord ↔ Tenant lean methodology
- Overall (STATE)
- 90 Strongly Landlord-Friendly
- State Indiana
- 90 Strongly Landlord-Friendly · R+11
- County
- — inherits STATE
- City
- — inherits STATE
ZIP-level market 46033
- Rents YoY
- 8.4%
- Active inventory
- 193
- Price-to-rent
- 11.2×
Monthly cashflow live
- Estimated rent
- $2,603 high interval (Pro) →
- Mortgage (P&I)
- −$1,835
- Tax from tax record
- −$255 /mo · $3,065/yr
- Insurance
- −$146
- HOA
- −$82
- Vacancy / Maint / Mgmt
- −$547
- Net cashflow
- $-262
Break-even live
UW: 25.0% down · 7.5% · 30yr · 1.5% tax · 5.0% vac · 8.0% maint · 8.0% mgmt
Financing live
Cash to close
- Down payment
- $87,475
- Closing costs
- $10,497
- Reserves months
- —
- Total cash needed
- —
Loan-product check · same deal, 3 products live
Conventional
25% down · 7.5% · 30yr
- Down + closing
- —
- Monthly P&I
- —
- Monthly cashflow
- —
- DSCR
- —
- Eligible?
- —
Personal DTI + credit; lowest rate.
DSCR
20% down · 8.5% · 30yr
- Down + closing
- —
- Monthly P&I
- —
- Monthly cashflow
- —
- DSCR
- —
- Eligible?
- —
No personal income docs; deal must DSCR.
Hard money
10% down · 12.0% · 12mo
- Down + closing
- —
- Monthly P&I
- —
- Monthly cashflow
- —
- DSCR
- —
- Eligible?
- —
Short-term bridge; refi at stabilization.
Rent comps 19 comps
| Address | Beds | Baths | Sqft | Rent | $/sqft | DOM | Units | Dist |
|---|---|---|---|---|---|---|---|---|
| 7257 Zanesville Rd Carmel, IN | 3.0 | 2.5 | 1416 | $2,700 | $1.91 | 1d | 1 | 0.04mi |
| 7125 Antiquity Dr Carmel, IN | 3.0 | 3.0 | 2583 | $2,765 | $1.07 | 2d | 1 | 0.33mi |
| 14471 Community Dr Carmel, IN | 1.0–3.0 | 1.0–2.5 | 741 | $2,331 | $3.14 | 1d | 32 | 0.36mi |
| 14565 James Dean Dr Carmel, IN | 2.0–3.0 | 2.0–2.5 | 1350 | $3,200 | $2.37 | 1d | 15 | 0.38mi |
| 14277 James Dean Dr Carmel, IN | 4.0 | 2.5 | 2236 | $3,450 | $1.54 | 7d | 1 | 0.43mi |
| 7065 Adalene Ln Carmel, IN | 3.0 | 3.5 | 2308 | $2,650 | $1.15 | 16d | 1 | 0.45mi |
| 7304 Selah Ln Noblesville, IN | 3.0 | 2.5 | 1883 | $2,250 | $1.19 | 1d | 1 | 0.47mi |
| 7264 Selah Ln Noblesville, IN | 3.0 | 2.5 | 1892 | $2,295 | $1.21 | 1d | 1 | 0.47mi |
| 7264 Selah Ln Noblesville, IN | 3.0 | 2.5 | 1905 | $2,375 | $1.25 | 16d | 1 | 0.47mi |
| 7246 Selah Ln Noblesville, IN | 3.0 | 2.5 | 1880 | $2,195 | $1.17 | 1d | 1 | 0.47mi |
| 7273 Shroyer Way Noblesville, IN | 3.0 | 2.5 | 2067 | $2,400 | $1.16 | 14d | 1 | 0.49mi |
| 7255 Shroyer Way Noblesville, IN | 3.0 | 2.5 | 1915 | $2,350 | $1.23 | 1d | 1 | 0.49mi |
| 7028 Sunstone Pl Carmel, IN | 4.0 | 3.5 | 2400 | $2,899 | $1.21 | 43d | 1 | 0.52mi |
| 7160 Oxfordshire Blvd Noblesville, IN | 1.0–2.0 | 1.0–2.0 | 1054 | $1,590 | $1.51 | 3d | 11 | 0.56mi |
| 6940 Equality Blvd Carmel, IN | 3.0 | 2.5 | 1826 | $2,500 | $1.37 | 43d | 1 | 0.57mi |
| 7520 Alluvium St Noblesville, IN | 3.0 | 1.0–2.0 | 1000 | $2,312 | $2.31 | 1d | 29 | 0.58mi |
| 6886 Sunstone Pl Carmel, IN | 3.0 | 3.5 | 1464 | $2,900 | $1.98 | 1d | 1 | 0.62mi |
| 5386 Ripplingbrook Way Carmel, IN | 3.0 | 2.0 | 1686 | $2,200 | $1.30 | 1d | 1 | 1.27mi |
| 14504 Cherry Ridge Rd Carmel, IN | 4.0 | 2.5 | 1993 | $2,750 | $1.38 | 1d | 1 | 1.38mi |
HOA detail condo
- Monthly dues
- $82 · $984/yr
- Likely covers
- snow removal
- Assessments
- None detected in remarks — confirm with the listing agent.
Listing history 6 events
-
2026-06-18days on market $349,900 Active 6 DOM
-
2026-06-17days on market $349,900 Active 5 DOM
-
2026-06-16days on market $349,900 Active 4 DOM
-
2026-06-15days on market $349,900 Active 3 DOM
-
2026-06-13remarks 455-char remark
-
2026-06-13$349,900 Active 1 DOM
ⓘ Source: listings_history table (triggers on properties + properties_extension) + one-shot
backfill from property_details.listing_events for pre-trigger history.
Tax reassessment forecast IN · Partial reset (capped growth)
- Current annual tax
- $3,065 · $255/mo
- Projected year-2 tax
- $3,065 · $255/mo
- Expected delta
- $0/yr ($0/mo · 0.0%)
ⓘ Screening estimate from a state-policy table — verify with the county assessor before closing.
Climate risk First Street
- Flood 1/10 Low FEMA zone X (unshaded) · 0% chance over 30 yrs
- Wildfire 1/10 Low
- Heat 4/10 Moderate 7 d/yr ≥101°F today · 18 d/yr by 30 yrs out
- Wind 2/10 Low 100% chance of damaging wind over 30 yrs
- Air quality 2/10 Low 1 unhealthy d/yr today · 1 by 30 yrs out
Nearby sold comps map
Loading sold comps map…
Walkable amenities ~0.75 mi
Loading nearby amenities…
Taxation est. · year 1
- Rental income
- $31,232
- − Mortgage interest
- −$19,600
- − Property taxes
- −$3,065
- − Insurance
- −$1,750
- − Repairs & maintenance
- −$2,499
- − Management
- −$2,499
- − HOA
- −$984
- − Depreciation
- −$10,179
- Taxable loss
- −$9,342
- Est. tax savings @ 24.0%
- +$2,242
- After-tax cash flow
- $-902/yr
For passive investors: Depreciation is non-cash, so a rental often shows a tax loss while cash-flowing — sheltering income. Rental losses are passive: they offset passive income freely, and up to $25,000/yr can offset ordinary (W-2) income if you actively participate and your MAGI is under $100k (phasing out to $0 by $150k); unused losses carry forward. On sale, claimed depreciation is recaptured at up to 25%, and gains may owe capital-gains tax (a 1031 exchange can defer both). Figures are a year-1 estimate at your 24.0% rate — not tax advice; consult a CPA.
Schools (NCES district)
- District
- Carmel Clay Schools
- NCES district ID
- 1801200
- Math proficiency
- 68% ▼ -7.00%
- Reading proficiency
- 70% ▼ -7.00%
- Median HH income
- $102,347
- Composite
- 63.54/100
- National rank
- #608
- State rank
- #1 of 301 in IN
Livability — Carmel
- Score
- 84/100
- State rank
- #7
- US rank
- #726
Category grades
Schools grade is shown separately in the Schools card above.
Census & demographics
- Census place
- Carmel, IN
- County
- Hamilton County · 337,479 people
- City population
- 99,910
- Metro
- Indianapolis-Carmel-Anderson, IN
- Population (ZIP)
- 40,881
- Household income
- $153,143
- Rent vs Own
- Severe rent burden
- 378.0
Population outlook (Hamilton County) Hauer SSP2
- Today (2025)
- 381,938 people
- By 2030
- 417,496 · +9.3%
- By 2040
- 486,684 · +27.4%
- By 2050
- 549,805 · +44.0%
- By 2075
- 687,078 · +79.9%
- By 2100
- 754,495 · +97.5%
Race, ethnicity, and origin ACS 2023
- Neighborhood character
- Predominantly White (79%)
- Race & ethnicity
- White 79% Asian 8% Two or more races 8% Hispanic / Latino 7% Black 2%
- Hispanic origin (detail)
- Mexican 3% Salvadoran 1%
- Common ancestry
- Romanian 4% Italian 3% Lithuanian 2%
- Foreign-born
- 11% · Canada, China, South Korea
- Languages at home
- 87% English-only · Spanish 4% Chinese 3% Other Asian/Pacific 1%
Political lean MEDSL · Hamilton
- 2024 margin
- Lean R (+6.1) · D 46.0% · R 52.1% · Other 1.9%
- 2008→2024 swing
- +16.2pp toward D · 2008: -22.2pp · 2024: -6.1pp
- All cycles
- 2024: R+6.1 2020: R+6.8 2016: R+19.6 2012: R+34.3 2008: R+22.2
Not yet ingested
- Civics
- —
Market trends
- HPI YoY
- ▼ -199.29%
- Current HPI
- 226.6783
- Rent YoY
- ▲ 8.44%
- Metro
- Indianapolis-Carmel-Anderson, IN
- State GDP YoY
- ▲ 2.90%
- F500 in state
- 18
Industry mix (Fortune 500 HQ in IN)
| Industry | F500 HQs | Revenue |
|---|---|---|
| Industrial Machinery | 2 | $37B |
|
||
| Healthcare | 1 | $177B |
|
||
| Pharmaceuticals | 1 | $45B |
|
||
| Metals / Steel | 1 | $18B |
|
||
| Agriculture | 1 | $17B |
|
||
| Packaging | 1 | $12B |
|
||
Price history
+43.4% since first listed7 events — show timeline
- 2026-06-11 Listed $349,900 MIBOR as Distributed by MLS Grid
- 2025-08-26 Listing Removed — MIBOR as Distributed by MLS Grid
- 2025-04-26 Price Changed $349,900 MIBOR as Distributed by MLS Grid
- 2025-03-26 Listed $374,900 MIBOR as Distributed by MLS Grid
- 2019-10-17 Sold (MLS) $243,995 MIBOR as Distributed by MLS Grid
- 2019-08-06 Pending — MIBOR as Distributed by MLS Grid
- 2019-06-12 Listed $243,995 MIBOR as Distributed by MLS Grid
Property tax history
+191.5%/yrLatest (2025): $3,065 · -16.6% YoY. Source: county tax records.
Cash-flow waterfall
monthlySold comps — $/sqft
last 12 mo · ≤1 miLoading sold comps…