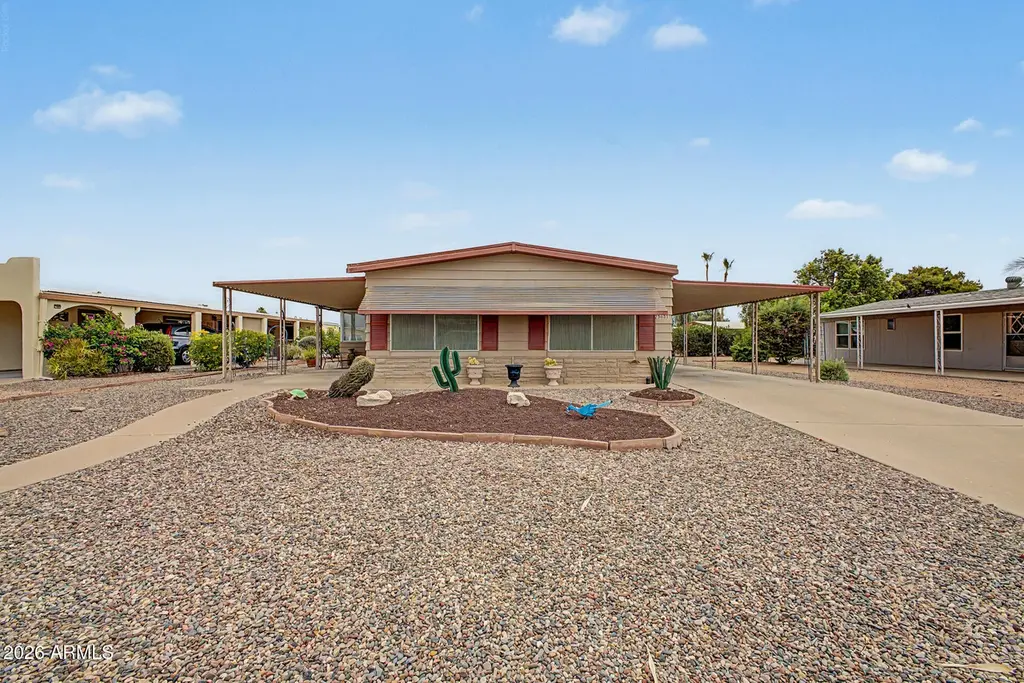
25631 S Montana Ave · Sun Lakes, AZ
Flood risk 1/10 · Minimal
- FEMA flood zone
- D
- Chance of flooding over 30 yrs
- 0.0%
- Est. flood insurance / yr
- $544 – $1,084
Fire risk 5/10 · Moderate
- Est. fire insurance / yr
- $610 – $1,132
Heat risk 9/10 · Severe
- Hot days now (above 112°F)
- 4 days/yr
- Hot days in 30 yrs
- 11 days/yr
Wind risk 1/10 · Minimal
- Chance of severe wind over 30 yrs
- —
Air-quality risk 1/10 · Minimal
- Unhealthy air days now
- 0 days/yr
- Unhealthy air days in 30 yrs
- 0 days/yr
Risk factors via First Street. Map © Google.
Why this score? — see what drove the D grade
The composite is a weighted blend of 9 inputs, each scored 0–100. Each bar is that input's sub-score; the figure is the points it added to the 100-point composite (weight × sub-score).
- Cash flow +16.6/30.0
- DSCR +5.1/10.0
- Schools +4.8/10.0
- 1% rule +4.1/10.0
- Livability +3.1/5.0
- Rent growth +2.9/5.0
- Condition / age +2.5/5.0
- ARV discount +1.5/15.0
- Appreciation +0.0/10.0
$264,900
🖨 Deal sheet 📄 Offer letter ✓ Due diligence
Listing remarks MLS
This is a very nice and well maintained property that is fully furnished. An open floor plan which is desirable with many cabinets and storage galore!. Features include: Vaulted ceilings, light walls and sq. footage includes the spacious AZ Room; Popular circular kitchen with much counter space and opening into a light and bright family room; Large master bedroom with wonderful master bathroom with storage, larger 2nd bedroom with its own bath room; AZ Room cooled and heated for year around enjoyment. Come see this very desirable home in Sun Lakes Country Club offering all amenities for an active lifestyle!!
Key facts
- Fully furnished
- 6,978 sq ft lot
- 2 parking spots
Tags
Property features AI
Finance
- HOA & community: Association with annual fee (maintenance of grounds); Community amenities: pool, golf, lake, community spa (heated), tennis courts, biking/walking paths, fitness center, near light rail stop
Exterior
- Parking: 2 covered parking spaces; Separate storage area; 2 carport spaces
- Utilities: Private water company; Sewer connected (private sewer)
- Home design: Manufactured / mobile home; Fee simple ownership; Asphalt road access
- Construction: Wood frame construction; Painted exterior; Foam roof; Building area reported by owner
- Exterior features: Storage; Desert front and back landscaping; County-maintained road
Interior
- Kitchen: Refrigerator; Dishwasher; Garbage disposal; Pantry
- Bedrooms: 2 possible bedrooms
- Flooring: Carpet; Vinyl
- Bathrooms: 2 full bathrooms
- Heating & cooling: Natural gas heating; Central air; Ceiling fans
- Interior features: High-speed internet; Double vanity; Eat-in kitchen; Furnished (see remarks); Vaulted ceilings; Wet bar; Pantry; Full bathroom in primary bedroom; Solar window screens
- Laundry & utility: Laundry inside
Neighborhood map
What this means for you Summary
Snapshot
- This is a 2-bed/2.0-bath manufactured listed at $265k.
Deal economics
- At list price, monthly cash flow is $159 ($2k/yr) — positive.
- The deal already cash-flows at list — no discount required.
- To meet the 1% rule (rent ≥ 1% of price), the offer needs to be $241k (9.2% below list).
- Recommended offer: $241k (9.2% below list) — sets the bar for 1% rule.
- Cap rate 7.0% vs local median 3.8% in Sun Lakes — top-decile yield for the area; either an underpriced asset or a hidden risk that comps aren't pricing in. Stress-test before assuming the spread holds.
Location & tenants
- Location reads 62/100 on livability (#135 in AZ) — a middle-class / working-renter tenant base. Strengths: crime A+, housing B+; Watch: health & safety C-, schools D+, cost of living D.
- Chandler Unified District #80 (4242) (suburban): math 49% / reading 57% proficiency, ranked #31 of 249 in AZ (top 12%) — acceptable for families but not a draw, mixed tenant base, ~2y average lease.
- Market conditions: Rents rising (+1.4%/yr); 346 active listings in the ZIP; 31 comparable units currently listed for rent nearby; rentals at typical pace (median 25d on market — plan ~3-4 weeks tenant-placement turnaround); solid renter incomes; 36,011 units permitted in Maricopa County in 2024 (12,801 in 5+ unit buildings).
- This rent runs 31% of the median local income ($94k/yr) — at the standard rent-burdened threshold; future hikes will face affordability resistance.
Forward outlook
- Local home prices are declining (-3.0%/yr); year-one equity from $2k of loan paydown is wiped out by about $8k of value loss. Plan a longer hold.
- Maricopa County population projected at +38% by 2050 — long-run rental-demand tailwind backs the buy-and-hold thesis.
Negotiation context
- Only 5 days on market — expect competitive offers; lowballing is unlikely to land.
- 5 sale attempts since 16y ago with the ask held roughly flat each time — persistent listings suggest the price (not the market) is what's stuck; bring a comps-based counter.
- Current owner paid $103k; list at $265k implies a 157% gain — meaningful room to come down on a strong offer.
Risks & watch-outs
- Climate carrying-cost: moderate wildfire risk; extreme-heat days projected 4→11/yr by 2055 (HVAC capex compounding) — expect insurance premiums to compound above CPI over the hold.
Questions for the listing agent
- Built in 1977 — when were the roof, HVAC, electrical panel, plumbing, and water heater last replaced?
- What does the HOA fee cover, when was the last increase, and are there any pending special assessments or reserve-fund shortfalls?
- Is there a deadline driving the sale (1031 exchange, divorce, estate, relocation)? That informs how much negotiation room exists.
- Schools are D-rated, which usually means shorter tenancies and higher turnover. Who's the typical renter profile here, and what's been the actual vacancy rate?
- The area grade is low — what's the realistic commute time and amenity access for the typical tenant pool here? Any planned neighborhood developments (good or bad) we should know about?
- What's the average days-on-market for RENTAL listings here right now (not sales)? A rising rental-DOM trend means longer vacancies and softer asking-rent achievability than the comps imply.
- What's the recent tenant-quality profile in this submarket — average credit score on applications, eviction rate, late-payment / NSF rate, and stable-employment percentage? A property-management company in the area should have these aggregated.
- How much new for-sale + rental construction is in the pipeline within 1–3 miles? Heavy new supply typically softens prices + rents 12–24 months out; constrained supply supports both.
Investment metrics
- 1% rule
- 0.91% ✗
- Cap rate
- 7.01%
- Cash-on-cash
- 2.57%
- DSCR
- 1.11
- GRM
- 9.2
CMA / ARV
- ARV (on-the-fly)
- $233,856
- Comps found
- 12
Show comp detail 12 sales within ~0.75 mi
| Address | Dist | Beds/Ba | Sqft | Sold | Price | $/sf | Match |
|---|---|---|---|---|---|---|---|
| 8943 E Ohio Ave | 0.10mi | 3/2.0 (+1) | 1,362 (+1%) | 2mo | $307,250 | $226 | 86 |
| 8925 E Utah Ave | 0.08mi | 2/2.0 | 1,441 (+7%) | 3mo | $217,500 | $151 | 82 |
| 25847 S Montana Ave | 0.09mi | 2/2.0 | 1,248 (-7%) | 3mo | $260,000 | $208 | 81 |
| 25839 S Illinois Ave | 0.12mi | 2/2.0 | 1,248 (-7%) | 4mo | $160,000 | $128 | 79 |
| 9034 E Citrus Ln N | 0.38mi | 2/2.0 | 1,354 (+1%) | 3mo | $223,400 | $165 | 79 |
| 25635 S Country Club Dr | 0.35mi | 2/2.0 | 1,368 (+2%) | 2mo | $203,777 | $149 | 79 |
| 8905 E Indiana Ave | 0.14mi | 2/2.0 | 1,152 (-14%) | 1mo | $222,500 | $193 | 69 |
| 9039 E Fairway Blvd | 0.25mi | 2/2.0 | 1,522 (+13%) | 0mo | $235,000 | $154 | 66 |
| 9015 E Citrus Ln S | 0.58mi | 2/2.0 | 1,430 (+6%) | 2mo | $249,000 | $174 | 61 |
| 8929 E Sun Lakes Blvd S | 0.60mi | 2/2.0 | 1,272 (-5%) | 4mo | $250,000 | $197 | 60 |
| 26245 S Lakeview Dr | 0.67mi | 2/2.0 | 1,441 (+7%) | 2mo | $324,000 | $225 | 55 |
| 9109 E Country Club Dr | 0.49mi | 2/2.0 | 1,162 (-14%) | 4mo | $198,000 | $170 | 51 |
Match score weights: distance 35% · size 25% · config 20% · recency 20%. Top-matched comps best support the ARV.
Projected returns pro-forma
-3.0% appreciation · 1.4% rent growth · sell at horizon
- IRR
- -14.0%
- Equity multiple
- 0.51×
- Total profit
- $-36,648
- Equity at exit
- $39,497
- IRR
- -7.8%
- Equity multiple
- 0.54×
- Total profit
- $-34,121
- Equity at exit
- $22,904
Cash invested: $74,172 (down + closing). Projections, not guarantees.
Landlord ↔ Tenant lean methodology
- Overall (STATE)
- 87 Strongly Landlord-Friendly
- State Arizona
- 87 Strongly Landlord-Friendly · R+3
- County
- — inherits STATE
- City
- — inherits STATE
ZIP-level market 85248
- Home prices YoY
- -23.0%
- Rents YoY
- 1.4%
- Active inventory
- 346
- Price-to-rent
- 9.2×
Monthly cashflow live
- Estimated rent
- $2,406 high interval (Pro) →
- Mortgage (P&I)
- −$1,389
- Tax from tax record
- −$88 /mo · $1,060/yr
- Insurance
- −$110
- HOA
- −$154
- Vacancy / Maint / Mgmt
- −$505
- Net cashflow
- $159
Break-even live
UW: 25.0% down · 7.5% · 30yr · 1.5% tax · 5.0% vac · 8.0% maint · 8.0% mgmt
Financing live
Cash to close
- Down payment
- $66,225
- Closing costs
- $7,947
- Reserves months
- —
- Total cash needed
- —
Loan-product check · same deal, 3 products live
Conventional
25% down · 7.5% · 30yr
- Down + closing
- —
- Monthly P&I
- —
- Monthly cashflow
- —
- DSCR
- —
- Eligible?
- —
Personal DTI + credit; lowest rate.
DSCR
20% down · 8.5% · 30yr
- Down + closing
- —
- Monthly P&I
- —
- Monthly cashflow
- —
- DSCR
- —
- Eligible?
- —
No personal income docs; deal must DSCR.
Hard money
10% down · 12.0% · 12mo
- Down + closing
- —
- Monthly P&I
- —
- Monthly cashflow
- —
- DSCR
- —
- Eligible?
- —
Short-term bridge; refi at stabilization.
Rent comps 31 comps
| Address | Beds | Baths | Sqft | Rent | $/sqft | DOM | Units | Dist |
|---|---|---|---|---|---|---|---|---|
| 8934 E Minnesota Ave Sun Lakes, AZ | 2.0 | 2.0 | 970 | $1,950 | $2.01 | 5d | 1 | 0.22mi |
| 8931 E Copper Valley Ln Sun Lakes, AZ | 2.0 | 2.0 | 1012 | $1,650 | $1.63 | 43d | 1 | 0.25mi |
| 25424 S Wyoming Ave Sun Lakes, AZ | 2.0 | 2.0 | 1600 | $1,795 | $1.12 | 18d | 1 | 0.25mi |
| 9107 E Fairway Blvd Sun Lakes, AZ | 2.0 | 2.0 | 1313 | $3,900 | $2.97 | 1d | 1 | 0.27mi |
| 9111 E Olive Ln N Sun Lakes, AZ | 2.0 | 2.0 | 1251 | $1,200 | $0.96 | 24d | 1 | 0.34mi |
| 9348 E Sun Lakes Blvd N Sun Lakes, AZ | 2.0 | 2.0 | 1480 | $2,000 | $1.35 | 15d | 1 | 0.52mi |
| 9334 E Sun Lakes Blvd N Sun Lakes, AZ | 2.0 | 2.0 | 1236 | $2,000 | $1.62 | 4d | 1 | 0.56mi |
| 9022 E Citrus Ln S Sun Lakes, AZ | 2.0 | 2.0 | 1162 | $1,750 | $1.51 | 18d | 1 | 0.56mi |
| 25231 S Papago Pl Sun Lakes, AZ | 2.0 | 2.0 | 1750 | $4,000 | $2.29 | 43d | 1 | 0.65mi |
| 9119 E Citrus Ln S Sun Lakes, AZ | 3.0 | 2.0 | 1440 | $1,400 | $0.97 | 12d | 1 | 0.69mi |
| 9438 E Michigan Ave Sun Lakes, AZ | 3.0 | 2.0 | 1658 | $4,000 | $2.41 | 5d | 1 | 0.71mi |
| 9554 E Fairway Blvd Sun Lakes, AZ | 2.0 | 2.0 | 1348 | $2,100 | $1.56 | 24d | 1 | 0.89mi |
| 9635 E Palomino Pl Sun Lakes, AZ | 2.0 | 3.0 | 1792 | $1,850 | $1.03 | 24d | 1 | 0.97mi |
| 26618 S Maricopa Pl Sun Lakes, AZ | 3.0 | 2.0 | 1596 | $1,800 | $1.13 | 24d | 1 | 0.98mi |
| 9647 E Palomino Pl Sun Lakes, AZ | 2.0 | 2.0 | 1384 | $1,900 | $1.37 | 24d | 1 | 0.99mi |
| 9714 E Sherwood Way Sun Lakes, AZ | 2.0 | 2.0 | 1823 | $4,000 | $2.19 | 1d | 1 | 1.05mi |
| 25246 S Glenburn Dr Sun Lakes, AZ | 2.0 | 2.0 | 1384 | $3,200 | $2.31 | 11d | 1 | 1.09mi |
| 25246 S Glenburn Dr Sun Lakes, AZ | 2.0 | 2.0 | 1384 | $3,000 | $2.17 | 5d | 1 | 1.09mi |
| 9517 E Navajo Pl Sun Lakes, AZ | 2.0 | 2.0 | 1324 | $1,975 | $1.49 | 43d | 1 | 1.11mi |
| 9635 E Rocky Lake Dr Sun Lakes, AZ | 2.0 | 2.0 | 1575 | $2,500 | $1.59 | 43d | 1 | 1.15mi |
| 9222 E Crystal Dr Sun Lakes, AZ | 2.0 | 2.0 | 1841 | $2,200 | $1.20 | 5d | 1 | 1.16mi |
| 9746 E Coopers Hawk Dr Sun Lakes, AZ | 2.0 | 2.0 | 1566 | $4,500 | $2.87 | 24d | 1 | 1.17mi |
| 9746 E Coopers Hawk Dr Unit 1546352P Sun Lakes, AZ | 2.0 | 2.0 | 1560 | $3,066 | $1.97 | 12d | 1 | 1.17mi |
| 9559 E Sunburst Dr Sun Lakes, AZ | 2.0 | 2.0 | 1706 | $3,750 | $2.20 | 24d | 1 | 1.27mi |
| 23614 S Desert Moon Ct Sun Lakes, AZ | 2.0 | 2.0 | 1676 | $2,395 | $1.43 | 43d | 1 | 1.27mi |
| 25115 S Golfview Dr Sun Lakes, AZ | 2.0 | 2.0 | 1790 | $3,500 | $1.96 | 24d | 1 | 1.29mi |
| 25111 S Golfview Dr Sun Lakes, AZ | 2.0 | 2.0 | 1790 | $4,200 | $2.35 | 24d | 1 | 1.29mi |
| 25826 S Cedarcrest Dr Sun Lakes, AZ | 2.0 | 2.0 | 1823 | $3,950 | $2.17 | 1d | 1 | 1.45mi |
| 23833 S Pleasant Way Sun Lakes, AZ | 2.0 | 2.0 | 1572 | $2,500 | $1.59 | 24d | 1 | 1.45mi |
| 26646 S New Town Dr Sun Lakes, AZ | 2.0 | 2.0 | 1373 | $3,000 | $2.18 | 1d | 1 | 1.46mi |
| 23812 S Pleasant Way Sun Lakes, AZ | 2.0 | 2.0 | 1508 | $2,500 | $1.66 | 24d | 1 | 1.47mi |
HOA detail
- Monthly dues
- $154 · $1,848/yr
Listing history 6 events
-
2026-06-18days on market $264,900 Active 5 DOM
-
2026-06-17days on market $264,900 Active 4 DOM
-
2026-06-16days on market $264,900 Active 3 DOM
-
2026-06-15days on market $264,900 Active 2 DOM
-
2026-06-13remarks 632-char remark
-
2026-06-13$264,900 Active 1 DOM
ⓘ Source: listings_history table (triggers on properties + properties_extension) + one-shot
backfill from property_details.listing_events for pre-trigger history.
Tax reassessment forecast AZ · Resets to sale price
- Current annual tax
- $1,060 · $88/mo
- Projected year-2 tax
- $1,748 · $146/mo
- Expected delta
- +$688/yr (+$57/mo · 64.9%)
ⓘ Screening estimate from a state-policy table — verify with the county assessor before closing.
Climate risk First Street
- Flood 1/10 Low FEMA zone D · 0% chance over 30 yrs
- Wildfire 5/10 Major
- Heat 9/10 Extreme 4 d/yr ≥112°F today · 11 d/yr by 30 yrs out
- Wind 1/10 Low
- Air quality 1/10 Low 0 unhealthy d/yr today · 0 by 30 yrs out
Nearby sold comps map
Loading sold comps map…
Walkable amenities ~0.75 mi
Loading nearby amenities…
Taxation est. · year 1
- Rental income
- $28,870
- − Mortgage interest
- −$14,839
- − Property taxes
- −$1,060
- − Insurance
- −$1,324
- − Repairs & maintenance
- −$2,310
- − Management
- −$2,310
- − HOA
- −$1,848
- − Depreciation
- −$7,706
- Taxable loss
- −$2,527
- Est. tax savings @ 24.0%
- +$606
- After-tax cash flow
- $2,511/yr
For passive investors: Depreciation is non-cash, so a rental often shows a tax loss while cash-flowing — sheltering income. Rental losses are passive: they offset passive income freely, and up to $25,000/yr can offset ordinary (W-2) income if you actively participate and your MAGI is under $100k (phasing out to $0 by $150k); unused losses carry forward. On sale, claimed depreciation is recaptured at up to 25%, and gains may owe capital-gains tax (a 1031 exchange can defer both). Figures are a year-1 estimate at your 24.0% rate — not tax advice; consult a CPA.
Schools (NCES district)
- District
- Chandler Unified District #80 (4242)
- NCES district ID
- 0401870
- Math proficiency
- 49% ▼ -8.00%
- Reading proficiency
- 57% ▼ -2.00%
- Median HH income
- $74,048
- Composite
- 47.54/100
- National rank
- #2268
- State rank
- #31 of 249 in AZ
Livability — Sun Lakes
- Score
- 62/100
- State rank
- #135
- US rank
- #16572
Category grades
Schools grade is shown separately in the Schools card above.
Census & demographics
- Census place
- Sun Lakes, AZ
- County
- Maricopa County · 4,537,380 people
- City population
- 37,461
- Metro
- Phoenix-Mesa-Chandler, AZ
- Population (ZIP)
- 37,095
- Household income
- $94,495
- Rent vs Own
- Severe rent burden
- 1107.0
Population outlook (Maricopa County) Hauer SSP2
- Today (2025)
- 4,979,203 people
- By 2030
- 5,378,229 · +8.0%
- By 2040
- 6,156,598 · +23.6%
- By 2050
- 6,872,376 · +38.0%
- By 2075
- 8,401,270 · +68.7%
- By 2100
- 9,247,439 · +85.7%
Race, ethnicity, and origin ACS 2023
- Neighborhood character
- Predominantly White (70%)
- Race & ethnicity
- White 70% Asian 13% Hispanic / Latino 8% Two or more races 7% Black 3% Native American 2%
- Hispanic origin (detail)
- Mexican 5%
- Common ancestry
- Lithuanian 3% Portuguese 3% Romanian 3%
- Foreign-born
- 16% · Canada, China, South Korea
- Languages at home
- 83% English-only · Spanish 4% Other Asian/Pacific 3% Other Indo-European 3%
Political lean MEDSL · Maricopa
- 2024 margin
- Toss-up / Even · D 47.7% · R 51.2% · Other 1.1%
- 2008→2024 swing
- +7.1pp toward D · 2008: -10.6pp · 2024: -3.5pp
- All cycles
- 2024: R+3.5 2020: D+2.2 2016: R+3.5 2012: R+12.0 2008: R+10.6
Not yet ingested
- Civics
- —
Market trends
- HPI YoY
- ▼ -79.23%
- Current HPI
- 265.2743
- Rent YoY
- ▲ 1.40%
- Metro
- Phoenix-Mesa-Chandler, AZ
- State GDP YoY
- ▲ 4.54%
- F500 in state
- 20
Industry mix (Fortune 500 HQ in AZ)
| Industry | F500 HQs | Revenue |
|---|---|---|
| Technology | 2 | $13B |
|
||
| Mining / Metals | 1 | $23B |
|
||
| Environmental Services | 1 | $16B |
|
||
| Metals / Steel | 1 | $14B |
|
||
| Technology Distribution | 1 | $9B |
|
||
| Homebuilding | 1 | $8B |
|
||
Price history
-51.4% since first listed17 events — show timeline
- 2026-06-13 Listed $264,900 ARMLS
- 2016-07-29 Sold (Public Records) $103,000 Public Records
- 2016-07-29 Sold (MLS) $103,000 ARMLS
- 2016-07-22 Pending — ARMLS
- 2016-06-28 Price Changed $112,000 ARMLS
- 2016-06-17 Relisted — ARMLS
- 2016-06-11 Pending — ARMLS
- 2016-05-31 Listed $109,500 ARMLS
- 2013-08-16 Sold (Public Records) $75,000 Public Records
- 2011-07-28 Listing Removed — ARMLS
- 2011-04-30 Listed $74,900 ARMLS
- 2011-04-06 Listing Removed — ARMLS
- 2011-01-31 Price Changed $79,900 ARMLS
- 2010-12-16 Price Changed $85,900 ARMLS
- 2010-10-06 Listed $83,900 ARMLS
- 1987-03-16 Sold (Public Records) $58,000 Public Records
- 1984-12-07 Sold (Public Records) $545,340 Public Records
Property tax history
+3.5%/yrLatest (2025): $1,060 · +1.8% YoY. Source: county tax records.
Cash-flow waterfall
monthlySold comps — $/sqft
last 12 mo · ≤1 miLoading sold comps…