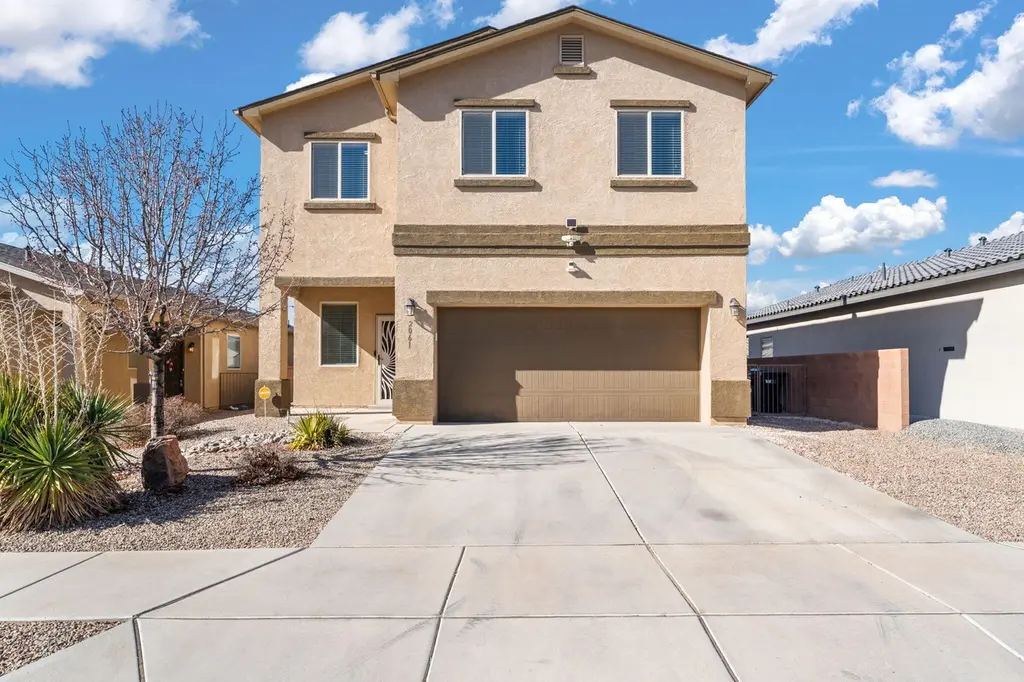
2061 Solara Loop NE · Rio Rancho, NM
Flood risk 1/10 · Minimal
- FEMA flood zone
- X (unshaded)
- Chance of flooding over 30 yrs
- 0.0%
- Est. flood insurance / yr
- $507 – $1,088
Fire risk 4/10 · Minor
- Est. fire insurance / yr
- $706 – $1,312
Heat risk 4/10 · Minor
- Hot days now (above 95°F)
- 7 days/yr
- Hot days in 30 yrs
- 18 days/yr
Wind risk 1/10 · Minimal
- Chance of severe wind over 30 yrs
- —
Air-quality risk 1/10 · Minimal
- Unhealthy air days now
- 0 days/yr
- Unhealthy air days in 30 yrs
- 0 days/yr
Risk factors via First Street. Map © Google.
Why this score? — see what drove the D- grade
The composite is a weighted blend of 9 inputs, each scored 0–100. Each bar is that input's sub-score; the figure is the points it added to the 100-point composite (weight × sub-score).
- ARV discount +11.3/15.0
- Cash flow +8.1/30.0
- Schools +5.2/10.0
- Rent growth +4.2/5.0
- Livability +3.6/5.0
- Condition / age +2.5/5.0
- DSCR +2.1/10.0
- 1% rule +1.8/10.0
- Appreciation +0.0/10.0
$379,900
🖨 Deal sheet (PDF) 📄 Offer letter ✓ Due diligence
Listing remarks MLS
Located in the heart of Rio Rancho, this spacious two-story home offers 4 bedrooms and 2.5 bathrooms with a functional and inviting layout. Enjoy year-round comfort with two refrigerated air units. The fully landscaped backyard is perfect for entertaining or relaxing, featuring a pergola, playground set and additional storage space. Conveniently situated near shopping, dining, parks, and schools, this home combines comfort, space, and location don't miss this opportunity!
Key facts
- Pergola
- Playground set
- 5,663 sq ft lot
Tags
Neighborhood map
What this means for you Summary
Snapshot
- This is a 4-bed/2.5-bath single-family listed at $380k.
Deal economics
- At list price, monthly cash flow is $-375 ($-5k/yr) — negative.
- To cash-flow at today's rent, offer at most $314k (17.5% below list).
- To meet the 1% rule (rent ≥ 1% of price), the offer needs to be $258k (32.1% below list).
- Recommended offer: $258k (32.1% below list) — sets the bar for 1% rule.
- Cap rate 5.1% vs local median 3.6% in Rio Rancho — top-decile yield for the area; either an underpriced asset or a hidden risk that comps aren't pricing in. Stress-test before assuming the spread holds.
Location & tenants
- Location reads 71/100 on livability (#17 in NM) — a middle-class / working-renter tenant base. Strengths: housing A+, cost of living A; Watch: amenities D, commute F.
- Rio Rancho Public Schools (suburban): math 48% / reading 73% proficiency, ranked #4 of 29 in NM (top 14%) — acceptable for families but not a draw, mixed tenant base, ~2y average lease.
- Zoned schools: Ernest Stapleton Elementary (815 students, 17% FRL); Eagle Ridge Middle (823 students, 100% FRL); Cleveland High School (math 46% / reading 70%, grade C, #32 of 110 statewide, top 28%, 2,631 students, 18% FRL).
- Market conditions: Rents rising fast (+6.9%/yr); 1325 active listings in the ZIP; 9 comparable units currently listed for rent nearby; rentals leasing fast (median 14d on market — plan ~1-2 weeks tenant-placement turnaround); solid renter incomes; 1,278 units permitted in Sandoval County in 2024 (216 in 5+ unit buildings).
- This rent runs 33% of the median local income ($95k/yr) — at the standard rent-burdened threshold; future hikes will face affordability resistance.
Forward outlook
- Local home prices are declining (-3.0%/yr); year-one equity from $3k of loan paydown is wiped out by about $11k of value loss. Plan a longer hold.
- Sandoval County population projected at +15% by 2050 — long-run rental-demand tailwind backs the buy-and-hold thesis.
Negotiation context
- It's been on market 87 days — a 6% lower offer ($357k) is reasonable based on typical stale-listing flexibility.
Questions for the listing agent
- What do current leases actually rent for vs. the listed asking? Can we see a recent rent roll and the last 12 months of T-12 income?
- It's been on market 87 days. Have you received any prior offers? Is the seller open to a 32% concession, seller financing, or rate buy-down credit?
- What does the HOA fee cover, when was the last increase, and are there any pending special assessments or reserve-fund shortfalls?
- Why hasn't it sold? Are there any deal-killer items the seller is aware of (foundation, flood, title, zoning, code violations)?
- Is there a deadline driving the sale (1031 exchange, divorce, estate, relocation)? That informs how much negotiation room exists.
- The area grade is low — what's the realistic commute time and amenity access for the typical tenant pool here? Any planned neighborhood developments (good or bad) we should know about?
- What's the average days-on-market for RENTAL listings here right now (not sales)? A rising rental-DOM trend means longer vacancies and softer asking-rent achievability than the comps imply.
- What's the recent tenant-quality profile in this submarket — average credit score on applications, eviction rate, late-payment / NSF rate, and stable-employment percentage? A property-management company in the area should have these aggregated.
- How much new for-sale + rental construction is in the pipeline within 1–3 miles? Heavy new supply typically softens prices + rents 12–24 months out; constrained supply supports both.
Investment metrics
- 1% rule
- 0.68% ✗
- Cap rate
- 5.11%
- Cash-on-cash
- -4.24%
- DSCR
- 0.81
- GRM
- 12.3
CMA / ARV
- ARV (median comp)
- $415,116
- List price
- $379,900
- Delta
- -8.48%
- Verdict
- FAIR
- Comps
- 20 within 1.0 mi
Show comp detail 12 sales within ~0.75 mi
| Address | Dist | Beds/Ba | Sqft | Sold | Price | $/sf | Match |
|---|---|---|---|---|---|---|---|
| 2061 Solara Loop NE | 0.00mi | 4/2.5 | 2,395 (+2%) | 0mo | $379,900 | $159 | 96 |
| 2744 Camino Plata Loop NE | 0.22mi | 4/3.0 | 2,349 (+0%) | 1mo | $495,000 | $211 | 86 |
| 2677 Camino Azul Loop | 0.32mi | 4/2.5 | 2,440 (+4%) | 1mo | $461,180 | $189 | 77 |
| 2562 Seaforth Cir | 0.43mi | 4/3.0 | 2,390 (+2%) | 1mo | $469,995 | $197 | 74 |
| 1044 Grace Ct NE | 0.10mi | 4/3.5 | 2,674 (+14%) | 1mo | $530,000 | $198 | 67 |
| 2665 Seaforth Cir | 0.38mi | 3/2.5 (-1) | 2,164 (-8%) | 2mo | $495,900 | $229 | 63 |
| 2701 Seaforth Cir | 0.37mi | 3/2.5 (-1) | 2,099 (-10%) | 0mo | $492,000 | $234 | 60 |
| 2582 Seaforth Cir | 0.43mi | 4/3.0 | 2,080 (-11%) | 2mo | $464,995 | $224 | 58 |
| 2570 Seaforth Cir | 0.43mi | 4/3.0 | 2,080 (-11%) | 2mo | $442,995 | $213 | 58 |
| 2569 Eglisfield Loop NE | 0.46mi | 4/2.5 | 2,078 (-11%) | 3mo | $429,990 | $207 | 58 |
| 2609 Eglisfield Loop NE | 0.51mi | 4/2.5 | 2,078 (-11%) | 1mo | $429,990 | $207 | 57 |
| 707 Bulb Ct NE | 0.72mi | 3/2.5 (-1) | 2,415 (+3%) | 1mo | $550,000 | $228 | 55 |
Match score weights: distance 35% · size 25% · config 20% · recency 20%. Top-matched comps best support the ARV.
Projected returns pro-forma
-3.0% appreciation · 6.88% rent growth · sell at horizon
- IRR
- -19.6%
- Equity multiple
- 0.29×
- Total profit
- $-75,104
- Equity at exit
- $56,644
- IRR
- -6.4%
- Equity multiple
- 0.53×
- Total profit
- $-50,060
- Equity at exit
- $32,847
Cash invested: $106,372 (down + closing). Projections, not guarantees.
Landlord ↔ Tenant lean methodology
- Overall (STATE)
- 55 Moderately Landlord-Leaning
- State New Mexico
- 55 Moderately Landlord-Leaning · D+3
- County
- — inherits STATE
- City
- — inherits STATE
ZIP-level market 87144
- Home prices YoY
- -30.8%
- Rents YoY
- 6.9%
- Active inventory
- 1325
- Price-to-rent
- 12.3×
Monthly cashflow live
- Estimated rent
- $2,579 high interval (Pro) →
- Mortgage (P&I)
- −$1,992
- Tax from tax record
- −$228 /mo · $2,731/yr
- Insurance
- −$158
- HOA
- −$35
- Vacancy / Maint / Mgmt
- −$542
- Net cashflow
- $-375
Break-even live
Sensitivity live
| Price | -10% $-160 | -5% $-268 | +0% $-375 | +5% $-483 | +10% $-591 |
|---|---|---|---|---|---|
| Rent | -10% $-579 | -5% $-477 | +0% $-375 | +5% $-274 | +10% $-172 |
| Rate | -1.0pp $-184 | -0.5pp $-279 | base $-375 | +0.5pp $-474 | +1.0pp $-574 |
UW: 25.0% down · 7.5% · 30yr · 1.5% tax · 5.0% vac · 8.0% maint · 8.0% mgmt
Financing live
Cash to close
- Down payment
- $94,975
- Closing costs
- $11,397
- Reserves months
- —
- Total cash needed
- —
Loan-product check · same deal, 3 products live
Conventional
25% down · 7.5% · 30yr
- Down + closing
- —
- Monthly P&I
- —
- Monthly cashflow
- —
- DSCR
- —
- Eligible?
- —
Personal DTI + credit; lowest rate.
DSCR
20% down · 8.5% · 30yr
- Down + closing
- —
- Monthly P&I
- —
- Monthly cashflow
- —
- DSCR
- —
- Eligible?
- —
No personal income docs; deal must DSCR.
Hard money
10% down · 12.0% · 12mo
- Down + closing
- —
- Monthly P&I
- —
- Monthly cashflow
- —
- DSCR
- —
- Eligible?
- —
Short-term bridge; refi at stabilization.
Rent comps 9 comps
| Address | Beds | Baths | Sqft | Rent | $/sqft | DOM | Units | Dist |
|---|---|---|---|---|---|---|---|---|
| 2590 Camino Plata Loop NE Rio Rancho, NM | 3.0 | 2.0 | 1694 | $2,600 | $1.53 | 45d | 1 | 0.18mi |
| 2600 Idalia Rd NE Rio Rancho, NM | 3.0 | 2.0 | 1750 | $2,500 | $1.43 | 4d | 1 | 0.42mi |
| 1832 Chicoma Rd NE Rio Rancho, NM | 4.0 | 2.5 | 2198 | $2,500 | $1.14 | 4d | 1 | 0.99mi |
| 1817 San Pedro Rd NE Rio Rancho, NM | 4.0 | 2.5 | 2130 | $2,000 | $0.94 | 25d | 1 | 1.01mi |
| 3533 Wild Horse Rd NE Rio Rancho, NM | 5.0 | 3.0 | 2522 | $2,670 | $1.06 | 45d | 1 | 1.05mi |
| 3716 Rancher Loop NE Rio Rancho, NM | 4.0 | 2.0 | 1680 | $2,100 | $1.25 | 3d | 1 | 1.23mi |
| 2011 Dillon Dr NE Rio Rancho, NM | 4.0 | 2.5 | 2367 | $2,750 | $1.16 | 13d | 1 | 1.24mi |
| 450 Minturn Loop NE Rio Rancho, NM | 4.0 | 2.5 | 2327 | $2,400 | $1.03 | 25d | 1 | 1.26mi |
| 154 Prado Verde Ct NE Rio Rancho, NM | 4.0 | 2.5 | 2399 | $2,500 | $1.04 | 3d | 1 | 1.32mi |
HOA detail
- Monthly dues
- $35 · $420/yr
Listing history 4 events
-
2026-05-02status Pending 476-char remark
Show marketing remark (476 chars)
Located in the heart of Rio Rancho, this spacious two-story home offers 4 bedrooms and 2.5 bathrooms with a functional and inviting layout. Enjoy year-round comfort with two refrigerated air units. The fully landscaped backyard is perfect for entertaining or relaxing, featuring a pergola, playground set and additional storage space. Conveniently situated near shopping, dining, parks, and schools, this home combines comfort, space, and location don't miss this opportunity!
-
2026-04-23price $379,900 476-char remark
Show marketing remark (476 chars)
Located in the heart of Rio Rancho, this spacious two-story home offers 4 bedrooms and 2.5 bathrooms with a functional and inviting layout. Enjoy year-round comfort with two refrigerated air units. The fully landscaped backyard is perfect for entertaining or relaxing, featuring a pergola, playground set and additional storage space. Conveniently situated near shopping, dining, parks, and schools, this home combines comfort, space, and location don't miss this opportunity!
-
2026-01-19$389,900 Active 476-char remark
Show marketing remark (476 chars)
Located in the heart of Rio Rancho, this spacious two-story home offers 4 bedrooms and 2.5 bathrooms with a functional and inviting layout. Enjoy year-round comfort with two refrigerated air units. The fully landscaped backyard is perfect for entertaining or relaxing, featuring a pergola, playground set and additional storage space. Conveniently situated near shopping, dining, parks, and schools, this home combines comfort, space, and location don't miss this opportunity!
-
2021-07-30soldstatus
ⓘ Source: listings_history table (triggers on properties + properties_extension) + one-shot
backfill from property_details.listing_events for pre-trigger history.
Tax reassessment forecast NM · Resets to sale price
- Current annual tax
- $2,731 · $228/mo
- Projected year-2 tax
- $3,039 · $253/mo
- Expected delta
- +$309/yr (+$26/mo · 11.3%)
ⓘ Screening estimate from a state-policy table — verify with the county assessor before closing.
Climate risk First Street
- Flood 1/10 Low FEMA zone X (unshaded) · 0% chance over 30 yrs
- Wildfire 4/10 Moderate
- Heat 4/10 Moderate 7 d/yr ≥95°F today · 18 d/yr by 30 yrs out
- Wind 1/10 Low
- Air quality 1/10 Low 0 unhealthy d/yr today · 0 by 30 yrs out
Nearby sold comps map
Loading sold comps map…
Walkable amenities ~0.75 mi
Loading nearby amenities…
Taxation est. · year 1
- Rental income
- $30,951
- − Mortgage interest
- −$21,280
- − Property taxes
- −$2,731
- − Insurance
- −$1,900
- − Repairs & maintenance
- −$2,476
- − Management
- −$2,476
- − HOA
- −$420
- − Depreciation
- −$11,052
- Taxable loss
- −$11,383
- Est. tax savings @ 24.0%
- +$2,732
- After-tax cash flow
- $-1,774/yr
For passive investors: Depreciation is non-cash, so a rental often shows a tax loss while cash-flowing — sheltering income. Rental losses are passive: they offset passive income freely, and up to $25,000/yr can offset ordinary (W-2) income if you actively participate and your MAGI is under $100k (phasing out to $0 by $150k); unused losses carry forward. On sale, claimed depreciation is recaptured at up to 25%, and gains may owe capital-gains tax (a 1031 exchange can defer both). Figures are a year-1 estimate at your 24.0% rate — not tax advice; consult a CPA.
Schools (NCES district)
- District
- Rio Rancho Public Schools
- NCES district ID
- 3500010
- Math proficiency
- 48% ▲ 38.00%
- Reading proficiency
- 73% ▲ 48.00%
- Median HH income
- $59,410
- Composite
- 52.29/100
- National rank
- #1595
- State rank
- #4 of 29 in NM
Livability — Rio Rancho
- Score
- 71/100
- State rank
- #17
- US rank
- #7253
Category grades
Schools grade is shown separately in the Schools card above.
Census & demographics
- Census place
- Rio Rancho, NM
- County
- Sandoval County · 110,336 people
- City population
- 110,336
- Metro
- Albuquerque, NM
- Population (ZIP)
- 51,837
- Household income
- $94,550
- Rent vs Own
- Severe rent burden
- 528.0
Population outlook (Sandoval County) Hauer SSP2
- Today (2025)
- 155,072 people
- By 2030
- 161,714 · +4.3%
- By 2040
- 171,831 · +10.8%
- By 2050
- 178,536 · +15.1%
- By 2075
- 192,517 · +24.1%
- By 2100
- 197,952 · +27.7%
Race, ethnicity, and origin ACS 2023
- Neighborhood character
- Diverse neighborhood (Simpson 0.61)
- Race & ethnicity
- White 44% Hispanic / Latino 44% Two or more races 24% Native American 4% Black 3% Asian 1%
- Hispanic origin (detail)
- Mexican 23% Puerto Rican 1%
- Common ancestry
- Slovak 3% Lithuanian 3% Italian 2%
- Foreign-born
- 5% · Canada
- Languages at home
- 80% English-only · Spanish 16%
Political lean MEDSL · Sandoval
- 2024 margin
- Lean D (+5.8) · D 51.8% · R 46.0% · Other 2.2%
- 2008→2024 swing
- -7.0pp toward R · 2008: 12.8pp · 2024: 5.8pp
- All cycles
- 2024: D+5.8 2020: D+8.4 2016: D+2.7 2012: D+5.1 2008: D+12.8
Not yet ingested
- Civics
- —
Market trends
- HPI YoY
- ▼ -95.68%
- Current HPI
- 215.124
- Rent YoY
- ▲ 6.88%
- Metro
- Albuquerque, NM
- State GDP YoY
- —
- F500 in state
- 0
Price history
-2.6% since first listed4 events — show timeline
- 2026-05-02 Pending — Southwest MLS
- 2026-04-23 Price Changed $379,900 Southwest MLS
- 2026-01-19 Listed $389,900 Southwest MLS
- 2021-07-30 Sold (Public Records) — Public Records
Property tax history
+114.7%/yrLatest (2023): $2,731 · +1.9% YoY. Source: county tax records.
Cash-flow waterfall
monthlySold comps — $/sqft
last 12 mo · ≤1 miLoading sold comps…