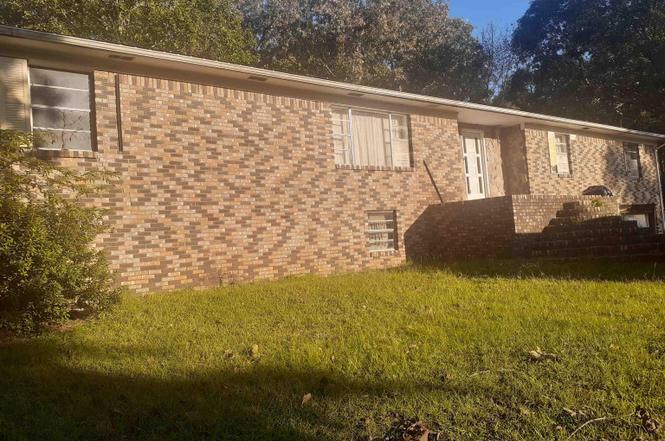
3367 Settlement Rd · Sylacauga, AL
Flood risk 1/10 · Minimal
- FEMA flood zone
- X (unshaded)
- Chance of flooding over 30 yrs
- 0.0%
- Est. flood insurance / yr
- $507 – $1,088
Fire risk 4/10 · Minor
- Est. fire insurance / yr
- $916 – $1,700
Heat risk 6/10 · Moderate
- Hot days now (above 105°F)
- 7 days/yr
- Hot days in 30 yrs
- 19 days/yr
Wind risk 6/10 · Moderate
- Chance of severe wind over 30 yrs
- 45.0%
Air-quality risk 2/10 · Minimal
- Unhealthy air days now
- 1 days/yr
- Unhealthy air days in 30 yrs
- 3 days/yr
Risk factors via First Street. Map © Google.
Why this score? — see what drove the C+ grade
The composite is a weighted blend of 9 inputs, each scored 0–100. Each bar is that input's sub-score; the figure is the points it added to the 100-point composite (weight × sub-score).
- Cash flow +27.7/30.0
- DSCR +9.8/10.0
- ARV discount +7.5/15.0
- 1% rule +6.5/10.0
- Livability +3.2/5.0
- Rent growth +2.5/5.0
- Schools +2.5/10.0
- Condition / age +2.5/5.0
- Appreciation +0.0/10.0
$130,000
🖨 Deal sheet (PDF) 📄 Offer letter ✓ Due diligence
Listing remarks
THIS HOUSE IS BEING SOLD IN AS IS CONDITION WITH ALL KNOWN AND UNKNOW LATENT DEFECTS & HAS DEN/DINNING ROOM COMBO, LIVING ROOM, KITCHEN, HALL BATH, 3 BEDROOM, 1 MASTER BEDROOM, 1 HALL BATH & 1 MASTER BATH. HOUSE ALSO HAS UNFINISED BASEMENT.
Key facts
- Unfinished basement
- 1.3 acre lot
- 4 garage spots
Tags
Neighborhood map
What this means for you Summary
Snapshot
- This is a 4-bed/1.5-bath single-family listed at $130k.
Deal economics
- At list price, monthly cash flow is $393 ($5k/yr) — positive.
- The deal already cash-flows at list — no discount required.
- Meets the 1% rule at list price ($1k rent vs $130k).
- Recommended offer: $114k (12.0% below list) — sets the bar for market timing.
- Cap rate 9.9% vs local median 4.3% in Sylacauga — top-decile yield for the area; either an underpriced asset or a hidden risk that comps aren't pricing in. Stress-test before assuming the spread holds.
Location & tenants
- Location reads 64/100 on livability (#157 in AL) — a middle-class / working-renter tenant base. Strengths: cost of living A+, housing A, health & safety A-; Watch: schools D+, crime F, amenities F.
- Talladega County (rural): math 15% / reading 44% proficiency, ranked #75 of 129 in AL (top 58%) — low school quality limits family demand, transient renter base, plan for 1-2y turnover; 64% free/reduced lunch — lower-income household profile, screen leases tightly.
- Market conditions: 135 active listings in the ZIP; 189 units permitted in Talladega County in 2024 (6 in 5+ unit buildings).
Forward outlook
- Local home prices are declining (-3.0%/yr); year-one equity from $899 of loan paydown is wiped out by about $4k of value loss. Plan a longer hold.
- Talladega County population projected at -14% by 2050 — secular population decline; favor cash flow + early exit over multi-decade hold.
- At projected returns (-3.0% appreciation + 3.0% rent growth), your $36k cash investment doubles in ~9 years — after that, you're playing with house money.
Negotiation context
- It's been on market 519 days — a 12% lower offer ($114k) is reasonable based on typical stale-listing flexibility.
- 3 sale attempts since 2y ago; this cycle's ask has dropped $30k (19%) from the opening price — seller is motivated, your offer sets the floor, not the list.
Risks & watch-outs
- Climate carrying-cost: major wind risk, 45% chance of damaging wind over 30y; extreme-heat days projected 7→19/yr by 2055 (HVAC capex compounding) — expect insurance premiums to compound above CPI over the hold.
Questions for the listing agent
- It's been on market 519 days. Have you received any prior offers? Is the seller open to a 12% concession, seller financing, or rate buy-down credit?
- Built in 1979 — when were the roof, HVAC, electrical panel, plumbing, and water heater last replaced?
- Why hasn't it sold? Are there any deal-killer items the seller is aware of (foundation, flood, title, zoning, code violations)?
- Is there a deadline driving the sale (1031 exchange, divorce, estate, relocation)? That informs how much negotiation room exists.
- Schools are D-rated, which usually means shorter tenancies and higher turnover. Who's the typical renter profile here, and what's been the actual vacancy rate?
- Crime grade is F in this area — have there been break-ins, vandalism, or insurance claims at this property in the last 3 years? What carrier currently insures it and at what premium?
- What's the average days-on-market for RENTAL listings here right now (not sales)? A rising rental-DOM trend means longer vacancies and softer asking-rent achievability than the comps imply.
- What's the recent tenant-quality profile in this submarket — average credit score on applications, eviction rate, late-payment / NSF rate, and stable-employment percentage? A property-management company in the area should have these aggregated.
- How much new for-sale + rental construction is in the pipeline within 1–3 miles? Heavy new supply typically softens prices + rents 12–24 months out; constrained supply supports both.
Investment metrics
- 1% rule
- 1.15% ✓
- Cap rate
- 9.92%
- Cash-on-cash
- 12.96%
- DSCR
- 1.58
- GRM
- 7.3
CMA / ARV
No comps found within radius.
Projected returns pro-forma
-3.0% appreciation · 3.0% rent growth · sell at horizon
- IRR
- 2.8%
- Equity multiple
- 1.11×
- Total profit
- $3,928
- Equity at exit
- $19,383
- IRR
- 12.3%
- Equity multiple
- 1.97×
- Total profit
- $35,471
- Equity at exit
- $11,240
Cash invested: $36,400 (down + closing). Projections, not guarantees.
Landlord ↔ Tenant lean methodology
- Overall (STATE)
- 90 Strongly Landlord-Friendly
- State Alabama
- 90 Strongly Landlord-Friendly · R+15
- County
- — inherits STATE
- City
- — inherits STATE
ZIP-level market 35150
- Home prices YoY
- -7.9%
- Active inventory
- 135
- Price-to-rent
- 7.3×
Monthly cashflow live
- Estimated rent
- $1,490 medium interval (Pro) →
- Mortgage (P&I)
- −$682
- Tax from tax record
- −$48 /mo · $578/yr
- Insurance
- −$54
- HOA
- −$0
- Lot rent
- −$0
- Vacancy / Maint / Mgmt
- −$313
- Net cashflow
- $393
Break-even live
Sensitivity live
| Price | -10% $467 | -5% $430 | +0% $393 | +5% $356 | +10% $320 |
|---|---|---|---|---|---|
| Rent | -10% $275 | -5% $334 | +0% $393 | +5% $452 | +10% $511 |
| Rate | -1.0pp $459 | -0.5pp $426 | base $393 | +0.5pp $359 | +1.0pp $325 |
UW: 25.0% down · 7.5% · 30yr · 1.5% tax · 5.0% vac · 8.0% maint · 8.0% mgmt
Financing live
Cash to close
- Down payment
- $32,500
- Closing costs
- $3,900
- Reserves months
- —
- Total cash needed
- —
Loan-product check · same deal, 3 products live
Conventional
25% down · 7.5% · 30yr
- Down + closing
- —
- Monthly P&I
- —
- Monthly cashflow
- —
- DSCR
- —
- Eligible?
- —
Personal DTI + credit; lowest rate.
DSCR
20% down · 8.5% · 30yr
- Down + closing
- —
- Monthly P&I
- —
- Monthly cashflow
- —
- DSCR
- —
- Eligible?
- —
No personal income docs; deal must DSCR.
Hard money
10% down · 12.0% · 12mo
- Down + closing
- —
- Monthly P&I
- —
- Monthly cashflow
- —
- DSCR
- —
- Eligible?
- —
Short-term bridge; refi at stabilization.
Listing history 9 events
-
2026-02-28status Pending
-
2025-09-22status Active
-
2025-09-22historical
-
2025-05-19price $130,000
-
2025-03-29status Active
-
2025-03-22historical
-
2025-01-29price $148,500
-
2025-01-08price $154,900
-
2024-09-21$159,900 Active
ⓘ Source: listings_history table (triggers on properties + properties_extension) + one-shot
backfill from property_details.listing_events for pre-trigger history.
Tax reassessment forecast AL · Resets to sale price
- Current annual tax
- $578 · $48/mo
- Projected year-2 tax
- $578 · $48/mo
- Expected delta
- $0/yr ($0/mo · 0.0%)
ⓘ Screening estimate from a state-policy table — verify with the county assessor before closing.
Climate risk First Street
- Flood 1/10 Low FEMA zone X (unshaded) · 0% chance over 30 yrs
- Wildfire 4/10 Moderate
- Heat 6/10 Major 7 d/yr ≥105°F today · 19 d/yr by 30 yrs out
- Wind 6/10 Major 45% chance of damaging wind over 30 yrs
- Air quality 2/10 Low 1 unhealthy d/yr today · 3 by 30 yrs out
Nearby sold comps map
Loading sold comps map…
Walkable amenities ~0.75 mi
Loading nearby amenities…
Taxation est. · year 1
- Rental income
- $17,882
- − Mortgage interest
- −$7,282
- − Property taxes
- −$578
- − Insurance
- −$650
- − Repairs & maintenance
- −$1,431
- − Management
- −$1,431
- − Depreciation
- −$3,782
- Taxable income
- $2,729
- Est. tax owed @ 24.0%
- −$655
- After-tax cash flow
- $4,063/yr
For passive investors: Depreciation is non-cash, so a rental often shows a tax loss while cash-flowing — sheltering income. Rental losses are passive: they offset passive income freely, and up to $25,000/yr can offset ordinary (W-2) income if you actively participate and your MAGI is under $100k (phasing out to $0 by $150k); unused losses carry forward. On sale, claimed depreciation is recaptured at up to 25%, and gains may owe capital-gains tax (a 1031 exchange can defer both). Figures are a year-1 estimate at your 24.0% rate — not tax advice; consult a CPA.
Schools (NCES district)
- District
- Talladega County
- NCES district ID
- 0103180
- Math proficiency
- 15% ▼ -24.00%
- Reading proficiency
- 44% ▲ 3.00%
- Median HH income
- $37,715
- Composite
- 24.5/100
- National rank
- #7650
- State rank
- #75 of 129 in AL
Livability — Sylacauga
- Score
- 64/100
- State rank
- #157
- US rank
- #14297
Category grades
Schools grade is shown separately in the Schools card above.
Census & demographics
- City population
- 17,118
- Population (ZIP)
- 17,118
Population outlook (Talladega County) Hauer SSP2
- Today (2025)
- 78,905 people
- By 2030
- 77,160 · -2.2%
- By 2040
- 72,937 · -7.6%
- By 2050
- 68,279 · -13.5%
- By 2075
- 57,884 · -26.6%
- By 2100
- 47,220 · -40.2%
Race, ethnicity, and origin ACS 2023
- Neighborhood character
- Majority White (62%)
- Race & ethnicity
- White 62% Black 32% Two or more races 3% Hispanic / Latino 2%
- Common ancestry
- Slovak 1% Hispanic 1% Italian 1%
- Foreign-born
- 1% · Canada
- Languages at home
- 97% English-only · Spanish 2% Other Indo-European 1%
Political lean MEDSL · Talladega
- 2024 margin
- Solid R (+33.8) · D 32.9% · R 66.6%
- 2008→2024 swing
- -15.3pp toward R · 2008: -18.5pp · 2024: -33.8pp
- All cycles
- 2024: R+33.8 2020: R+25.5 2016: R+25.6 2012: R+16.0 2008: R+18.5
Not yet ingested
- Civics
- —
Market trends
- HPI YoY
- ▼ -20.65%
- Current HPI
- 240.527
- Rent YoY
- —
- Metro
- —
- State GDP YoY
- ▲ 2.94%
- F500 in state
- 4
Industry mix (Fortune 500 HQ in AL)
| Industry | F500 HQs | Revenue |
|---|---|---|
| Financial Services | 1 | $8B |
|
||
| Healthcare | 1 | $5B |
|
||
Price history
-18.7% since first listed9 events — show timeline
- 2026-02-28 Pending — Greater Alabama MLS
- 2025-09-22 Relisted — Greater Alabama MLS
- 2025-09-22 Delisted — Greater Alabama MLS
- 2025-05-19 Price Changed $130,000 Greater Alabama MLS
- 2025-03-29 Relisted — Greater Alabama MLS
- 2025-03-22 Delisted — Greater Alabama MLS
- 2025-01-29 Price Changed $148,500 Greater Alabama MLS
- 2025-01-08 Price Changed $154,900 Greater Alabama MLS
- 2024-09-21 Listed $159,900 Greater Alabama MLS
Property tax history
+2.9%/yrLatest (2025): $578 · +25.0% YoY. Source: county tax records.
Cash-flow waterfall
monthlySold comps — $/sqft
last 12 mo · ≤1 miLoading sold comps…