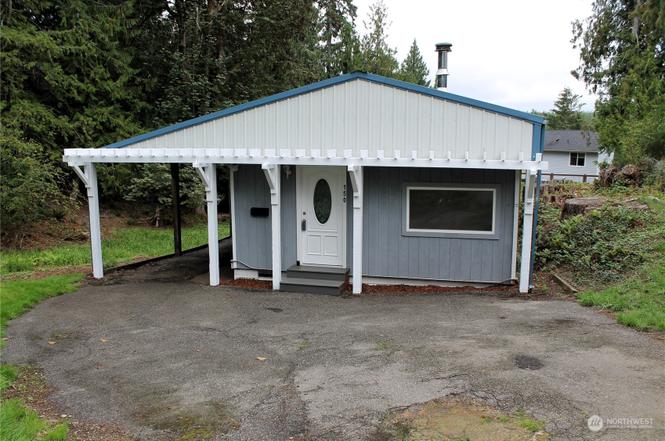
150 SE Lupine Pl · Shelton, WA
Flood risk 1/10 · Minimal
- FEMA flood zone
- X (unshaded)
- Chance of flooding over 30 yrs
- 0.0%
- Est. flood insurance / yr
- $507 – $1,088
Fire risk 3/10 · Minor
- Est. fire insurance / yr
- $604 – $1,122
Heat risk 3/10 · Minor
- Hot days now (above 88°F)
- 7 days/yr
- Hot days in 30 yrs
- 14 days/yr
Wind risk 1/10 · Minimal
- Chance of severe wind over 30 yrs
- —
Air-quality risk 7/10 · Major
- Unhealthy air days now
- 9 days/yr
- Unhealthy air days in 30 yrs
- 10 days/yr
Risk factors via First Street. Map © Google.
Why this score? — see what drove the D grade
The composite is a weighted blend of 9 inputs, each scored 0–100. Each bar is that input's sub-score; the figure is the points it added to the 100-point composite (weight × sub-score).
- Cash flow +13.7/30.0
- ARV discount +7.5/15.0
- DSCR +4.1/10.0
- 1% rule +3.8/10.0
- Livability +3.7/5.0
- Schools +3.4/10.0
- Rent growth +2.5/5.0
- Condition / age +2.5/5.0
- Appreciation +0.0/10.0
$139,900
🖨 Deal sheet (PDF) 📄 Offer letter ✓ Due diligence
Listing remarks
New Price! This is a clean little single wide mobile home in this great Fawn Lake community behind a locked gate. Fawn Lake has a nice non-motorized lake that is great for fishing or kayaking, and they have parks, tennis & basketball courts, even horse-shoe pits. The home is nestled back at the end of a cul-de-sac, and has vinyl-planked flooring throughout - no carpets anywhere. It has a new electrical panel, too! There is a wonderful stick-built cover over the entire home with a sturdy metal roof, and a carport. Affordable for sure! Special financing may be available (a regular loan is not available due to the age of the home). Ask your Broker for details. Come check it out!
Key facts
- New electrical panel
- 0.45 acre lot
- Parking
Tags
Property features AI
Finance
- Other: Lot number 44; irregular lot shape; approximately 0.45 acres; Zoned RR5 (county jurisdiction)
- Financial info: Listing terms: Cash, Conventional (see remarks)
- HOA & community: Fawn Lake Community association; Annual association fee of $1,200; Association covers common area maintenance, road maintenance, security, and water; Community features include CCRs and a club house
Exterior
- Parking: Attached carport (1 covered/carport space)
- Security: Security gate; Security service
- Utilities: Electric energy source; Electric water heater; Community water (Fawn Lake Community Water); Septic tank (private septic system); Power by PUD #3; Cable by Comcast/Xfinity; Internet by Comcast/Xfinity
- Home design: Manufactured single-wide home; Manufactured on land (residential); One story; Main-level entry; Paramount make; single wide body type; Average condition
- Construction: Metal/vinyl construction materials; Metal and torch-down roof; Pillar/post/pier foundation; Built as a manufactured home
- Exterior features: Metal/vinyl exterior; Partially fenced lot; Gated entry; Cable TV available; High-speed internet available; Community waterfront / private beach access; Cul-de-sac, dead-end street; paved access; Level to rolling topography; View
Interior
- Kitchen: Refrigerator; Stove / Range
- Bedrooms: 2 bedrooms (both on the main level); Primary bedroom on the main level
- Flooring: Vinyl plank
- Bathrooms: 1 full bathroom with bathtub and shower (main level)
- Heating & cooling: Wall furnace (heating); No cooling
- Interior features: Water heater; Partially fenced
- Laundry & utility: Washer; Dryer; Utility room on the main level
Neighborhood map
What this means for you Summary
Snapshot
- This is a 1-bed/1.0-bath manufactured listed at $140k.
Deal economics
- At list price, monthly cash flow is $11 ($129/yr) — positive.
- The deal already cash-flows at list — no discount required.
- To meet the 1% rule (rent ≥ 1% of price), the offer needs to be $123k (11.9% below list).
- Recommended offer: $123k (12.0% below list) — sets the bar for market timing.
- Cap rate 6.4% vs local median 3.1% in Shelton — top-decile yield for the area; either an underpriced asset or a hidden risk that comps aren't pricing in. Stress-test before assuming the spread holds.
Location & tenants
- Location reads 73/100 on livability (#203 in WA) — a middle-class / working-renter tenant base. Strengths: housing A+, health & safety A+, amenities A-; Watch: employment D+, crime F, commute F.
- Shelton School District (town): math 31% / reading 43% proficiency, ranked #237 of 291 in WA (top 81%) — families likely to look elsewhere, expect single-tenant / working-renter base with shorter leases.
- Zoned schools: Bordeaux Elementary School (504 students, 68% FRL); Shelton High School (1,473 students, 62% FRL).
- Market conditions: 439 active listings in the ZIP; solid renter incomes; 299 units permitted in Mason County in 2024 (0 in 5+ unit buildings).
Forward outlook
- Local home prices are declining (-3.0%/yr); year-one equity from $967 of loan paydown is wiped out by about $4k of value loss. Plan a longer hold.
- Mason County population projected at -14% by 2050 — secular population decline; favor cash flow + early exit over multi-decade hold.
Negotiation context
- It's been on market 579 days — a 12% lower offer ($123k) is reasonable based on typical stale-listing flexibility.
- 3 sale attempts since 8y ago; this cycle's ask has dropped $35k (20%) from the opening price — seller is motivated, your offer sets the floor, not the list.
- Current owner paid $45k; list at $140k implies a 211% gain — meaningful room to come down on a strong offer.
Questions for the listing agent
- It's been on market 579 days. Have you received any prior offers? Is the seller open to a 12% concession, seller financing, or rate buy-down credit?
- Built in 1964 — when were the roof, HVAC, electrical panel, plumbing, and water heater last replaced?
- What does the HOA fee cover, when was the last increase, and are there any pending special assessments or reserve-fund shortfalls?
- Why hasn't it sold? Are there any deal-killer items the seller is aware of (foundation, flood, title, zoning, code violations)?
- Is there a deadline driving the sale (1031 exchange, divorce, estate, relocation)? That informs how much negotiation room exists.
- Schools are D-rated, which usually means shorter tenancies and higher turnover. Who's the typical renter profile here, and what's been the actual vacancy rate?
- Crime grade is F in this area — have there been break-ins, vandalism, or insurance claims at this property in the last 3 years? What carrier currently insures it and at what premium?
- The area grade is low — what's the realistic commute time and amenity access for the typical tenant pool here? Any planned neighborhood developments (good or bad) we should know about?
- What's the average days-on-market for RENTAL listings here right now (not sales)? A rising rental-DOM trend means longer vacancies and softer asking-rent achievability than the comps imply.
- What's the recent tenant-quality profile in this submarket — average credit score on applications, eviction rate, late-payment / NSF rate, and stable-employment percentage? A property-management company in the area should have these aggregated.
- How much new for-sale + rental construction is in the pipeline within 1–3 miles? Heavy new supply typically softens prices + rents 12–24 months out; constrained supply supports both.
Investment metrics
- 1% rule
- 0.88% ✗
- Cap rate
- 6.39%
- Cash-on-cash
- 0.33%
- DSCR
- 1.01
- GRM
- 9.5
CMA / ARV
- ARV (on-the-fly)
- $374,400
- Comps found
- 1
Show comp detail 1 sale within ~0.75 mi
| Address | Dist | Beds/Ba | Sqft | Sold | Price | $/sf | Match |
|---|---|---|---|---|---|---|---|
| 800 SE Crescent Dr | 0.57mi | 1/1.0 | 500 (-4%) | 7mo | $360,000 | $720 | 61 |
Match score weights: distance 35% · size 25% · config 20% · recency 20%. Top-matched comps best support the ARV.
Projected returns pro-forma
-3.0% appreciation · 3.0% rent growth · sell at horizon
- IRR
- -15.8%
- Equity multiple
- 0.44×
- Total profit
- $-21,967
- Equity at exit
- $20,860
- IRR
- -7.3%
- Equity multiple
- 0.54×
- Total profit
- $-18,177
- Equity at exit
- $12,096
Cash invested: $39,172 (down + closing). Projections, not guarantees.
Landlord ↔ Tenant lean methodology
- Overall (STATE)
- 28 Tenant-Leaning
- State Washington
- 28 Tenant-Leaning · D+8
- County
- — inherits STATE
- City
- — inherits STATE
ZIP-level market 98584
- Active inventory
- 439
- Price-to-rent
- 9.5×
Monthly cashflow live
- Estimated rent
- $1,233 medium interval (Pro) →
- Mortgage (P&I)
- −$734
- Tax from tax record
- −$71 /mo · $857/yr
- Insurance
- −$58
- HOA
- −$100
- Vacancy / Maint / Mgmt
- −$259
- Net cashflow
- $11
Break-even live
Sensitivity live
| Price | -10% $90 | -5% $50 | +0% $11 | +5% $-29 | +10% $-68 |
|---|---|---|---|---|---|
| Rent | -10% $-87 | -5% $-38 | +0% $11 | +5% $59 | +10% $108 |
| Rate | -1.0pp $81 | -0.5pp $46 | base $11 | +0.5pp $-25 | +1.0pp $-62 |
UW: 25.0% down · 7.5% · 30yr · 1.5% tax · 5.0% vac · 8.0% maint · 8.0% mgmt
Financing live
Cash to close
- Down payment
- $34,975
- Closing costs
- $4,197
- Reserves months
- —
- Total cash needed
- —
Loan-product check · same deal, 3 products live
Conventional
25% down · 7.5% · 30yr
- Down + closing
- —
- Monthly P&I
- —
- Monthly cashflow
- —
- DSCR
- —
- Eligible?
- —
Personal DTI + credit; lowest rate.
DSCR
20% down · 8.5% · 30yr
- Down + closing
- —
- Monthly P&I
- —
- Monthly cashflow
- —
- DSCR
- —
- Eligible?
- —
No personal income docs; deal must DSCR.
Hard money
10% down · 12.0% · 12mo
- Down + closing
- —
- Monthly P&I
- —
- Monthly cashflow
- —
- DSCR
- —
- Eligible?
- —
Short-term bridge; refi at stabilization.
HOA detail
- Monthly dues
- $100 · $1,200/yr
- Likely covers
- electric
Listing history 26 events
-
2026-06-19days on market $139,900 Active 579 DOM
-
2026-06-18days on market $139,900 Active 578 DOM
-
2026-06-17days on market $139,900 Active 577 DOM
-
2026-06-16days on market $139,900 Active 576 DOM
-
2026-06-15days on market $139,900 Active 575 DOM
-
2026-06-14days on market $139,900 Active 573 DOM
-
2026-06-12days on market $139,900 Active 572 DOM
-
2026-06-09days on market $139,900 Active 569 DOM
-
2026-06-08days on market $139,900 Active 568 DOM
-
2026-06-07days on market $139,900 Active 567 DOM
-
2026-06-02days on market $139,900 Active 562 DOM
-
2026-06-01days on market $139,900 Active 561 DOM
-
2026-05-31days on market $139,900 Active 560 DOM
-
2026-05-30days on market $139,900 Active 559 DOM
-
2026-04-17price $139,900
-
2025-09-06price $149,900
-
2025-07-01price $159,900
-
2025-05-02price $164,900
-
2025-03-07price $169,900
-
2024-11-22status Active
-
2024-11-15status Pending
-
2024-11-09$174,900 Active
-
2018-06-20soldstatus $45,000
-
2018-06-07status Pending Inspection
-
2018-06-01soldstatus $45,000 Sold
-
2018-05-29$49,000 Active
ⓘ Source: listings_history table (triggers on properties + properties_extension) + one-shot
backfill from property_details.listing_events for pre-trigger history.
Tax reassessment forecast WA · Resets to sale price
- Current annual tax
- $857 · $71/mo
- Projected year-2 tax
- $1,371 · $114/mo
- Expected delta
- +$514/yr (+$43/mo · 59.9%)
ⓘ Screening estimate from a state-policy table — verify with the county assessor before closing.
Climate risk First Street
- Flood 1/10 Low FEMA zone X (unshaded) · 0% chance over 30 yrs
- Wildfire 3/10 Moderate
- Heat 3/10 Moderate 7 d/yr ≥88°F today · 14 d/yr by 30 yrs out
- Wind 1/10 Low
- Air quality 7/10 Severe 9 unhealthy d/yr today · 10 by 30 yrs out
Nearby sold comps map
Loading sold comps map…
Walkable amenities ~0.75 mi
Loading nearby amenities…
Taxation est. · year 1
- Rental income
- $14,797
- − Mortgage interest
- −$7,837
- − Property taxes
- −$857
- − Insurance
- −$700
- − Repairs & maintenance
- −$1,184
- − Management
- −$1,184
- − HOA
- −$1,200
- − Depreciation
- −$4,070
- Taxable loss
- −$2,233
- Est. tax savings @ 24.0%
- +$536
- After-tax cash flow
- $665/yr
For passive investors: Depreciation is non-cash, so a rental often shows a tax loss while cash-flowing — sheltering income. Rental losses are passive: they offset passive income freely, and up to $25,000/yr can offset ordinary (W-2) income if you actively participate and your MAGI is under $100k (phasing out to $0 by $150k); unused losses carry forward. On sale, claimed depreciation is recaptured at up to 25%, and gains may owe capital-gains tax (a 1031 exchange can defer both). Figures are a year-1 estimate at your 24.0% rate — not tax advice; consult a CPA.
Schools (NCES district)
- District
- Shelton School District
- NCES district ID
- 5307900
- Math proficiency
- 31% ▼ -1.00%
- Reading proficiency
- 43% ▼ -3.00%
- Median HH income
- $45,467
- Composite
- 34.1/100
- National rank
- #10288
- State rank
- #237 of 291 in WA
Livability — Shelton
- Score
- 73/100
- State rank
- #203
- US rank
- #5586
Category grades
Schools grade is shown separately in the Schools card above.
Census & demographics
- County
- Mason County · 40,606 people
- City population
- 40,606
- Metro
- Shelton, WA
- Population (ZIP)
- 40,606
- Household income
- $78,610
- Rent vs Own
- Severe rent burden
- 687.0
Population outlook (Mason County) Hauer SSP2
- Today (2025)
- 60,005 people
- By 2030
- 58,567 · -2.4%
- By 2040
- 54,735 · -8.8%
- By 2050
- 51,470 · -14.2%
- By 2075
- 46,276 · -22.9%
- By 2100
- 39,883 · -33.5%
Race, ethnicity, and origin ACS 2023
- Neighborhood character
- Predominantly White (72%)
- Race & ethnicity
- White 72% Hispanic / Latino 15% Two or more races 11% Native American 3%
- Hispanic origin (detail)
- Mexican 8%
- Common ancestry
- Portuguese 4% Slovak 3% Italian 2%
- Foreign-born
- 8% · Canada
- Languages at home
- 88% English-only · Spanish 10%
Political lean MEDSL · Mason
- 2024 margin
- Toss-up / Even · D 47.2% · R 49.7% · Other 3.2%
- 2008→2024 swing
- -11.2pp toward R · 2008: 8.7pp · 2024: -2.5pp
- All cycles
- 2024: R+2.5 2020: R+3.9 2016: R+6.0 2012: D+6.9 2008: D+8.7
Not yet ingested
- Civics
- —
Market trends
- HPI YoY
- ▼ -232.42%
- Current HPI
- 199.0698
- Rent YoY
- —
- Metro
- Shelton, WA
- State GDP YoY
- ▲ 4.65%
- F500 in state
- 22
Industry mix (Fortune 500 HQ in WA)
| Industry | F500 HQs | Revenue |
|---|---|---|
| Retail | 2 | $269B |
|
||
| Technology / Retail | 1 | $638B |
|
||
| Technology | 1 | $245B |
|
||
| Telecommunications | 1 | $38B |
|
||
| Food / Beverage | 1 | $36B |
|
||
| Automotive / Trucks | 1 | $34B |
|
||
Price history
+185.5% since first listed12 events — show timeline
- 2026-04-17 Price Changed $139,900 NWMLS as Distributed by MLS Grid
- 2025-09-06 Price Changed $149,900 NWMLS as Distributed by MLS Grid
- 2025-07-01 Price Changed $159,900 NWMLS as Distributed by MLS Grid
- 2025-05-02 Price Changed $164,900 NWMLS as Distributed by MLS Grid
- 2025-03-07 Price Changed $169,900 NWMLS as Distributed by MLS Grid
- 2024-11-22 Relisted — NWMLS as Distributed by MLS Grid
- 2024-11-15 Pending — NWMLS as Distributed by MLS Grid
- 2024-11-09 Listed $174,900 NWMLS as Distributed by MLS Grid
- 2018-06-20 Sold (Public Records) $45,000 Public Records
- 2018-06-07 Pending — NWMLS as Distributed by MLS Grid
- 2018-06-01 Sold (MLS) $45,000 NWMLS as Distributed by MLS Grid
- 2018-05-29 Listed $49,000 NWMLS as Distributed by MLS Grid
Property tax history
+0.1%/yrLatest (2026): $857 · +4.5% YoY. Source: county tax records.
Cash-flow waterfall
monthlySold comps — $/sqft
last 12 mo · ≤1 miLoading sold comps…