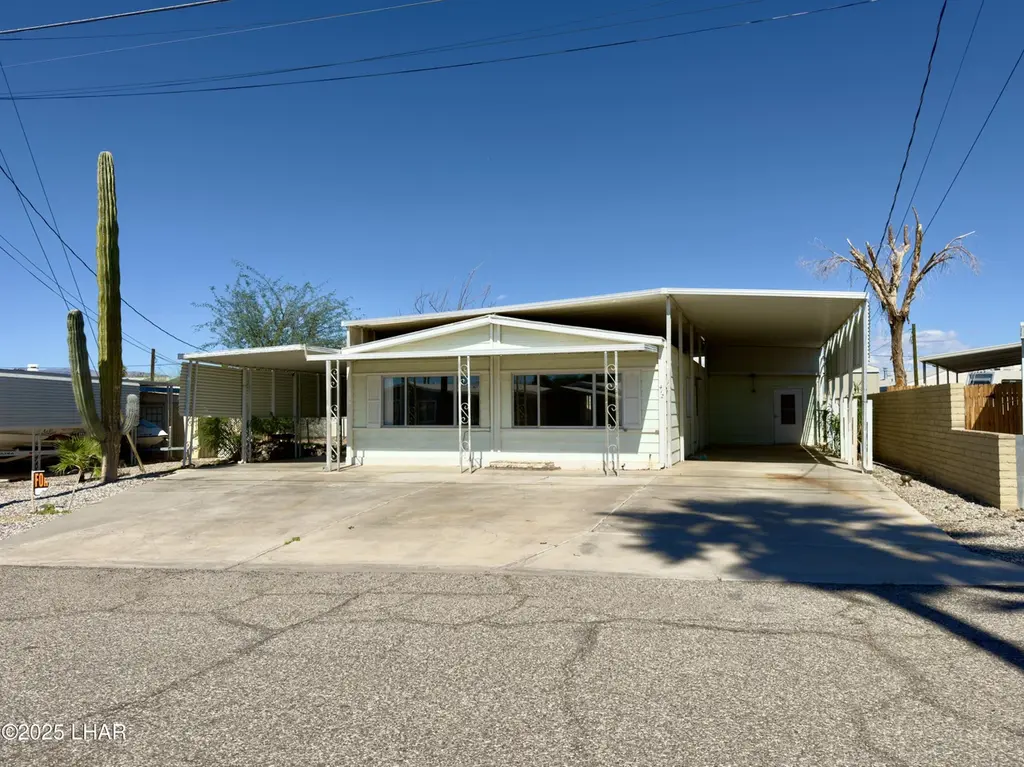
412 N Misty Ln · Bluewater, AZ
Flood risk No data
- FEMA flood zone
- —
- Chance of flooding over 30 yrs
- —
- Est. flood insurance / yr
- —
Fire risk No data
- Est. fire insurance / yr
- —
Heat risk No data
- Hot days now (above threshold)
- —
- Hot days in 30 yrs
- —
Wind risk No data
- Chance of severe wind over 30 yrs
- —
Air-quality risk No data
- Unhealthy air days now
- —
- Unhealthy air days in 30 yrs
- —
Risk factors via First Street. Map © Google.
Why this score? — see what drove the C- grade
The composite is a weighted blend of 9 inputs, each scored 0–100. Each bar is that input's sub-score; the figure is the points it added to the 100-point composite (weight × sub-score).
- Cash flow +21.6/30.0
- ARV discount +7.5/15.0
- DSCR +6.9/10.0
- 1% rule +5.7/10.0
- Condition / age +3.8/5.0
- Livability +3.2/5.0
- Rent growth +2.5/5.0
- Schools +1.5/10.0
- Appreciation +0.0/10.0
$175,000
🖨 Deal sheet 📄 Offer letter ✓ Due diligence
Listing remarks
Welcome to 412 N Misty Ln -- a clean, comfortable river community home located inside a gated community with guard-monitored access. Perfect as a full-time residence, winter retreat, or second river home, this well-cared-for property offers 1,860 sq ft with 2 bedrooms, 2 bathrooms, and an oversized primary suite. The ADA-friendly layout includes wider doorways and easy accessibility throughout. The property features covered RV/boat parking, additional covered parking, workshop, Arizona room, extended awnings, fencing, water feature, ceiling fans, and full concrete surrounding the home for easy maintenance. The home sits on a permanent foundation with copper plumbing already in place. One of
Key facts
- Gated community
- Arizona room
- Ada-friendly layout
Tags
Property features AI
Finance
- Financial info: Land is leased
Exterior
- Parking: Carport
- Utilities: Public water; Public sewer; 200+ amp electric service
- Home design: Manufactured home (double wide)
- Construction: Vertical siding
- Exterior features: Patio; Back yard fencing; Block and chain-link fencing; Shed(s); Water-smart landscaping; Level lot; Private maintained road
Interior
- Kitchen: Laminate countertops (kitchen); Breakfast bar
- Bedrooms: Total rooms: 5
- Flooring: Laminate flooring
- Bathrooms: 1 full bathroom; 1 three-quarter bathroom
- Heating & cooling: Central heat; Heat pump; Central air conditioning; Ceiling fans
- Interior features: Laminate countertops; Breakfast bar; Ceiling fans; Walk-in closet(s); Wet bar
- Laundry & utility: Inside laundry with electric dryer hookup; Electric water heater
Neighborhood map
What this means for you Summary
Snapshot
- This is a 2-bed/2.0-bath manufactured listed at $175k. Condition is rated good.
Deal economics
- At list price, monthly cash flow is $265 ($3k/yr) — positive.
- The deal already cash-flows at list — no discount required.
- Meets the 1% rule at list price ($2k rent vs $175k).
- Recommended offer: $172k (1.5% below list) — sets the bar for market timing.
Location & tenants
- Location reads 65/100 on livability (#81 in AZ) — a middle-class / working-renter tenant base. Strengths: cost of living A+, housing A+, crime A-; Watch: health & safety C-, employment D+, schools F.
- Parker Unified School District (4510) (town): math 18% / reading 18% proficiency, ranked #200 of 249 in AZ (top 80%) — low school quality limits family demand, transient renter base, plan for 1-2y turnover; 69% free/reduced lunch — lower-income household profile, screen leases tightly.
- Market conditions: 147 active listings in the ZIP; 92 units permitted in La Paz County in 2024 (0 in 5+ unit buildings).
Forward outlook
- Local home prices are declining (-3.0%/yr); year-one equity from $1k of loan paydown is wiped out by about $5k of value loss. Plan a longer hold.
- La Paz County population projected at -11% by 2050 — secular population decline; favor cash flow + early exit over multi-decade hold.
Negotiation context
- It's been on market 22 days — a 2% lower offer ($172k) is reasonable based on typical stale-listing flexibility.
- 2 sale attempts with the ask held roughly flat each time — persistent listings suggest the price (not the market) is what's stuck; bring a comps-based counter.
Questions for the listing agent
- Built in 1978 — when were the roof, HVAC, electrical panel, plumbing, and water heater last replaced?
- Is there a deadline driving the sale (1031 exchange, divorce, estate, relocation)? That informs how much negotiation room exists.
- Schools are F-rated, which usually means shorter tenancies and higher turnover. Who's the typical renter profile here, and what's been the actual vacancy rate?
- What's the average days-on-market for RENTAL listings here right now (not sales)? A rising rental-DOM trend means longer vacancies and softer asking-rent achievability than the comps imply.
- What's the recent tenant-quality profile in this submarket — average credit score on applications, eviction rate, late-payment / NSF rate, and stable-employment percentage? A property-management company in the area should have these aggregated.
- How much new for-sale + rental construction is in the pipeline within 1–3 miles? Heavy new supply typically softens prices + rents 12–24 months out; constrained supply supports both.
Investment metrics
- 1% rule
- 1.07% ✓
- Cap rate
- 8.11%
- Cash-on-cash
- 6.49%
- DSCR
- 1.29
- GRM
- 7.8
CMA / ARV
- ARV (on-the-fly)
- $401,760
- Comps found
- 2
Show comp detail 2 sales within ~0.75 mi
| Address | Dist | Beds/Ba | Sqft | Sold | Price | $/sf | Match |
|---|---|---|---|---|---|---|---|
| 358 E Riverfront Dr | 0.15mi | 3/2.0 (+1) | 1,792 (-4%) | 9mo | $387,500 | $216 | 75 |
| 435 Bluewater Dr | 0.05mi | 3/2.0 (+1) | 1,592 (-14%) | 18mo | $145,000 | $91 | 53 |
Match score weights: distance 35% · size 25% · config 20% · recency 20%. Top-matched comps best support the ARV.
Projected returns pro-forma
-3.0% appreciation · 3.0% rent growth · sell at horizon
- IRR
- -6.3%
- Equity multiple
- 0.77×
- Total profit
- $-11,440
- Equity at exit
- $26,093
- IRR
- 3.4%
- Equity multiple
- 1.24×
- Total profit
- $11,900
- Equity at exit
- $15,131
Cash invested: $49,000 (down + closing). Projections, not guarantees.
Landlord ↔ Tenant lean methodology
- Overall (STATE)
- 87 Strongly Landlord-Friendly
- State Arizona
- 87 Strongly Landlord-Friendly · R+3
- County
- — inherits STATE
- City
- — inherits STATE
ZIP-level market 85344
- Active inventory
- 147
- Price-to-rent
- 7.8×
Monthly cashflow live
- Estimated rent
- $1,867 medium interval (Pro) →
- Mortgage (P&I)
- −$918
- Tax est. 1.5%
- −$219 /mo · $2,625/yr
- Insurance
- −$73
- HOA
- −$0
- Vacancy / Maint / Mgmt
- −$392
- Net cashflow
- $265
Break-even live
UW: 25.0% down · 7.5% · 30yr · 1.5% tax · 5.0% vac · 8.0% maint · 8.0% mgmt
Financing live
Cash to close
- Down payment
- $43,750
- Closing costs
- $5,250
- Reserves months
- —
- Total cash needed
- —
Loan-product check · same deal, 3 products live
Conventional
25% down · 7.5% · 30yr
- Down + closing
- —
- Monthly P&I
- —
- Monthly cashflow
- —
- DSCR
- —
- Eligible?
- —
Personal DTI + credit; lowest rate.
DSCR
20% down · 8.5% · 30yr
- Down + closing
- —
- Monthly P&I
- —
- Monthly cashflow
- —
- DSCR
- —
- Eligible?
- —
No personal income docs; deal must DSCR.
Hard money
10% down · 12.0% · 12mo
- Down + closing
- —
- Monthly P&I
- —
- Monthly cashflow
- —
- DSCR
- —
- Eligible?
- —
Short-term bridge; refi at stabilization.
Listing history 18 events
-
2026-06-18days on market $175,000 Active 22 DOM
-
2026-06-17days on market $175,000 Active 21 DOM
-
2026-06-16days on market $175,000 Active 20 DOM
-
2026-06-15days on market $175,000 Active 19 DOM
-
2026-06-14days on market $175,000 Active 17 DOM
-
2026-06-13days on market $175,000 Active 16 DOM
-
2026-06-10days on market $175,000 Active 14 DOM
-
2026-06-09days on market $175,000 Active 13 DOM
-
2026-06-08days on market $175,000 Active 12 DOM
-
2026-06-07days on market $175,000 Active 11 DOM
-
2026-06-05days on market $175,000 Active 8 DOM
-
2026-06-03days on market $175,000 Active 7 DOM
-
2026-06-02days on market $175,000 Active 6 DOM
-
2026-06-01days on market $175,000 Active 5 DOM
-
2026-05-31days on market $175,000 Active 4 DOM
-
2026-05-30days on market $175,000 Active 3 DOM
-
2026-05-28$175,000 Active
-
2025-10-16$200,000 Active
ⓘ Source: listings_history table (triggers on properties + properties_extension) + one-shot
backfill from property_details.listing_events for pre-trigger history.
Nearby sold comps map
Loading sold comps map…
Walkable amenities ~0.75 mi
Loading nearby amenities…
Taxation est. · year 1
- Rental income
- $22,398
- − Mortgage interest
- −$9,803
- − Property taxes
- −$2,625
- − Insurance
- −$875
- − Repairs & maintenance
- −$1,792
- − Management
- −$1,792
- − Depreciation
- −$5,091
- Taxable income
- $421
- Est. tax owed @ 24.0%
- −$101
- After-tax cash flow
- $3,081/yr
For passive investors: Depreciation is non-cash, so a rental often shows a tax loss while cash-flowing — sheltering income. Rental losses are passive: they offset passive income freely, and up to $25,000/yr can offset ordinary (W-2) income if you actively participate and your MAGI is under $100k (phasing out to $0 by $150k); unused losses carry forward. On sale, claimed depreciation is recaptured at up to 25%, and gains may owe capital-gains tax (a 1031 exchange can defer both). Figures are a year-1 estimate at your 24.0% rate — not tax advice; consult a CPA.
Condition & rehab AI · 12 photos
This manufactured home is in good condition with minimal repairs needed. A fresh coat of paint and updated fixtures would significantly enhance its value.
Repairs flagged
- Minor kitchen cabinets — Worn appearance
- Minor bathroom fixtures — No visible damage, but may need updating
Value-add opportunities
- Both Paint interior walls — Fresh paint enhances curb appeal and interior aesthetics
- Both Replace kitchen cabinets — New cabinets improve functionality and aesthetics
- Both Update bathroom fixtures — Modern fixtures improve functionality and aesthetics
- Both Landscaping — Enhances curb appeal and adds value
Renovation cost estimate screening
| Repair item | Severity | Est. cost |
|---|---|---|
| kitchen cabinets · Worn appearance | Minor | $500–3,000 |
| bathroom fixtures · No visible damage, but may need updating | Minor | $500–3,000 |
| Total estimated repair cost · 2 items | $1,000–6,000 |
Value-add ROI direction
- Both Paint interior walls — Fresh paint enhances curb appeal and interior aesthetics ↑
- Both Replace kitchen cabinets — New cabinets improve functionality and aesthetics ↑
- Both Update bathroom fixtures — Modern fixtures improve functionality and aesthetics ↑
- Both Landscaping — Enhances curb appeal and adds value ↑
ⓘ Cost ranges are severity-bucket heuristics (US national rule-of-thumb). Get contractor quotes + a written scope before underwriting a rehab budget.
Schools (NCES district)
- District
- Parker Unified School District (4510)
- NCES district ID
- 0405980
- Math proficiency
- 18% ▼ -10.00%
- Reading proficiency
- 18% ▼ -7.00%
- Median HH income
- $34,354
- Composite
- 14.76/100
- National rank
- #9392
- State rank
- #200 of 249 in AZ
Livability — Bluewater
- Score
- 65/100
- State rank
- #81
- US rank
- #12872
Category grades
Schools grade is shown separately in the Schools card above.
Census & demographics
- Census place
- Bluewater, AZ
- Population (ZIP)
- 9,069
Population outlook (La Paz County) Hauer SSP2
- Today (2025)
- 18,409 people
- By 2030
- 17,592 · -4.4%
- By 2040
- 16,600 · -9.8%
- By 2050
- 16,328 · -11.3%
- By 2075
- 17,075 · -7.2%
- By 2100
- 17,042 · -7.4%
Race, ethnicity, and origin ACS 2023
- Neighborhood character
- Highly diverse neighborhood (Simpson 0.72)
- Race & ethnicity
- White 40% Hispanic / Latino 34% Native American 23% Two or more races 19% Asian 2%
- Hispanic origin (detail)
- Mexican 32%
- Common ancestry
- Slovak 1% Lithuanian 1% Portuguese 1%
- Foreign-born
- 10% · Canada
- Languages at home
- 74% English-only · Spanish 21% Other Indo-European 1% Tagalog/Filipino 1%
Political lean MEDSL · La Paz
- 2024 margin
- Solid R (+44.2) · D 27.6% · R 71.8%
- 2008→2024 swing
- -15.7pp toward R · 2008: -28.5pp · 2024: -44.2pp
- All cycles
- 2024: R+44.2 2020: R+38.8 2016: R+41.8 2012: R+32.2 2008: R+28.5
Not yet ingested
- Civics
- —
Market trends
- HPI YoY
- ▼ -155.38%
- Current HPI
- 198.2271
- Rent YoY
- —
- Metro
- —
- State GDP YoY
- ▲ 4.54%
- F500 in state
- 20
Industry mix (Fortune 500 HQ in AZ)
| Industry | F500 HQs | Revenue |
|---|---|---|
| Technology | 2 | $13B |
|
||
| Mining / Metals | 1 | $23B |
|
||
| Environmental Services | 1 | $16B |
|
||
| Metals / Steel | 1 | $14B |
|
||
| Technology Distribution | 1 | $9B |
|
||
| Homebuilding | 1 | $8B |
|
||
Price history
-12.5% since first listed2 events — show timeline
- 2026-05-28 Listed $175,000 LHAR
- 2025-10-16 Listed $200,000 LHAR
Cash-flow waterfall
monthlySold comps — $/sqft
last 12 mo · ≤1 miLoading sold comps…