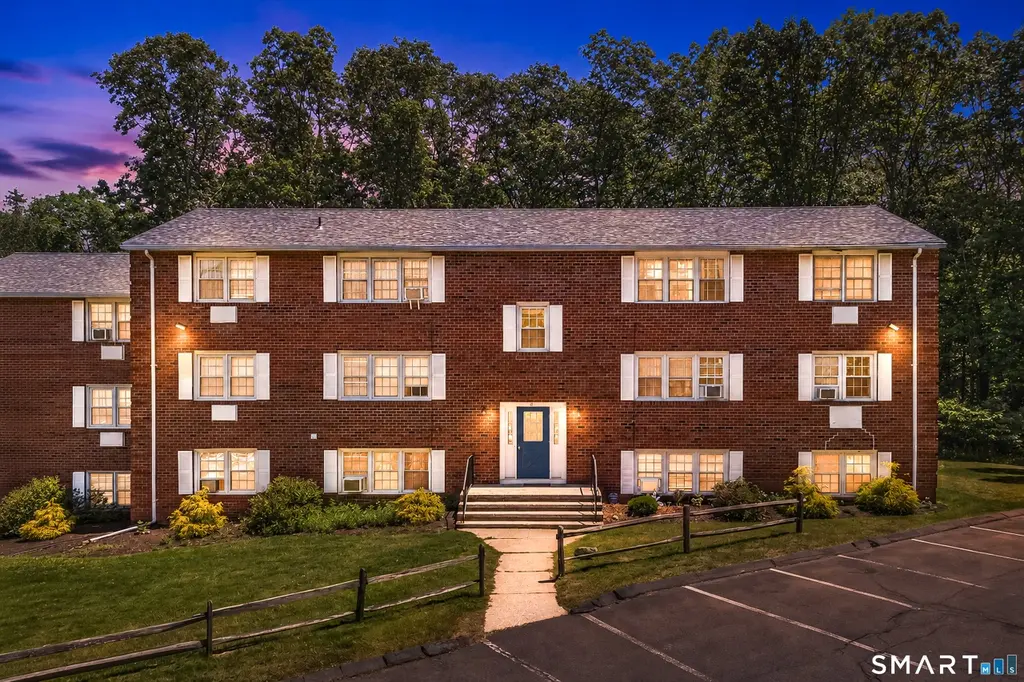
41 Briarwood Ln Unit F · Branford, CT
Flood risk No data
- FEMA flood zone
- —
- Chance of flooding over 30 yrs
- —
- Est. flood insurance / yr
- —
Fire risk No data
- Est. fire insurance / yr
- —
Heat risk No data
- Hot days now (above threshold)
- —
- Hot days in 30 yrs
- —
Wind risk No data
- Chance of severe wind over 30 yrs
- —
Air-quality risk No data
- Unhealthy air days now
- —
- Unhealthy air days in 30 yrs
- —
Risk factors via First Street. Map © Google.
Why this score? — see what drove the C- grade
The composite is a weighted blend of 9 inputs, each scored 0–100. Each bar is that input's sub-score; the figure is the points it added to the 100-point composite (weight × sub-score).
- Cash flow +17.8/30.0
- ARV discount +7.5/15.0
- 1% rule +7.1/10.0
- DSCR +5.6/10.0
- Rent growth +5.0/5.0
- Schools +4.2/10.0
- Livability +2.5/5.0
- Condition / age +2.5/5.0
- Appreciation +0.0/10.0
$179,900
🖨 Deal sheet 📄 Offer letter ✓ Due diligence
Listing remarks
Nestled in a quiet, well-maintained complex of just 18 units and surrounded by peaceful wooded views, this move-in-ready second-floor condo offers comfort, privacy, and value. This 2-bedroom layout features a generously sized primary bedroom, a new dishwasher, and a new water heater. Enjoy relaxing or entertaining in the tranquil patio area, perfect for grilling and outdoor enjoyment. An excellent opportunity for homeowners and investors alike, with the current rental income below market value, offering future upside potential. Water included in HOA. Simply move in and enjoy all this charming condo offers near beaches and shopping. Tenant lease until end of Sept 2026, pay electric.
Key facts
- Tranquil patio area
- Near shopping
- Near beaches
Tags
Property features AI
Finance
- Other: Part of the Sunrise complex; Total of 18 units in the building
- HOA & community: Monthly HOA fee of $409; HOA covers grounds maintenance, trash pickup, snow removal, water, and property management; Has homeowners association; Pets allowed with restrictions per bylaws; Professional off-site property management
Exterior
- Parking: Off-street parking; 1 parking space
- Utilities: Public water; Public sewer
- Home design: Condominium (Condo/Co-Op for sale); Unit located on 3rd floor (unit number listed as on floor 2 in building data)
- Construction: Brick construction
- Exterior features: Brick siding; Secluded lot
Interior
- Kitchen: Oven/Range; Refrigerator; Dishwasher
- Bedrooms: 2 bedrooms
- Bathrooms: 1 full bathroom
- Heating & cooling: Electric baseboard heat; 40-gallon hot water tank
- Interior features: 4 total rooms; No basement
- Laundry & utility: Common laundry area on lower level
Neighborhood map
What this means for you Summary
Snapshot
- This is a 2-bed/1.0-bath condo listed at $180k.
Deal economics
- At list price, monthly cash flow is $147 ($2k/yr) — positive.
- The deal already cash-flows at list — no discount required.
- Meets the 1% rule at list price ($2k rent vs $180k).
Location & tenants
- Location reads: area grade C — affects rentability + tenant quality, not the cash-flow math above.
- Branford School District (suburban): math 41% / reading 52% proficiency, ranked #85 of 153 in CT (top 56%) — families likely to look elsewhere, expect single-tenant / working-renter base with shorter leases; only 18% free/reduced lunch — higher-income household profile.
- Market conditions: Rents rising fast (+10.6%/yr); 114 active listings in the ZIP; 19 comparable units currently listed for rent nearby; rentals at typical pace (median 23d on market — plan ~3-4 weeks tenant-placement turnaround); 47% of comp listings sitting > 30 days — soft ceiling on asking rent; solid renter incomes; 1,059 units permitted in South Central Connecticut Planning Region in 2024 (779 in 5+ unit buildings).
Forward outlook
- Local home prices are declining (-3.0%/yr); year-one equity from $1k of loan paydown is wiped out by about $5k of value loss. Plan a longer hold.
- At projected returns (-3.0% appreciation + 8.0% rent growth), your $50k cash investment doubles in ~9 years — after that, you're playing with house money.
Negotiation context
- Only 10 days on market — expect competitive offers; lowballing is unlikely to land.
- Current owner paid $120k; 50% above their basis — modest negotiation headroom, anchor on the comps not their cost.
Questions for the listing agent
- Built in 1967 — when were the roof, HVAC, electrical panel, plumbing, and water heater last replaced?
- What does the HOA fee cover, when was the last increase, and are there any pending special assessments or reserve-fund shortfalls?
- Any open or pending special assessments — roof, HVAC, plumbing, elevator, façade? What's the per-unit balance and payoff schedule, and is the seller paying it off at close or rolling it to the buyer?
- Is there a deadline driving the sale (1031 exchange, divorce, estate, relocation)? That informs how much negotiation room exists.
- What's the average days-on-market for RENTAL listings here right now (not sales)? A rising rental-DOM trend means longer vacancies and softer asking-rent achievability than the comps imply.
- What's the recent tenant-quality profile in this submarket — average credit score on applications, eviction rate, late-payment / NSF rate, and stable-employment percentage? A property-management company in the area should have these aggregated.
- How much new apartment / multifamily construction is in the pipeline within 1–3 miles? Heavy new supply (>2% of stock underway) typically softens rents 12–24 months out; light construction supports rent growth.
Investment metrics
- 1% rule
- 1.21% ✓
- Cap rate
- 7.27%
- Cash-on-cash
- 3.50%
- DSCR
- 1.16
- GRM
- 6.9
CMA / ARV
No comps found within radius.
Projected returns pro-forma
-3.0% appreciation · 8.0% rent growth · sell at horizon
- IRR
- -4.0%
- Equity multiple
- 0.84×
- Total profit
- $-8,054
- Equity at exit
- $26,824
- IRR
- 11.5%
- Equity multiple
- 2.16×
- Total profit
- $58,343
- Equity at exit
- $15,554
Cash invested: $50,372 (down + closing). Projections, not guarantees.
Landlord ↔ Tenant lean methodology
- Overall (STATE)
- 27 Tenant-Leaning
- State Connecticut
- 27 Tenant-Leaning · D+7
- County
- — inherits STATE
- City
- — inherits STATE
ZIP-level market 06405
- Rents YoY
- 10.6%
- Active inventory
- 114
- Price-to-rent
- 6.9×
Monthly cashflow live
- Estimated rent
- $2,176 high interval (Pro) →
- Mortgage (P&I)
- −$943
- Tax from tax record
- −$145 /mo · $1,740/yr
- Insurance
- −$75
- HOA
- −$409
- Vacancy / Maint / Mgmt
- −$457
- Net cashflow
- $147
Break-even live
UW: 25.0% down · 7.5% · 30yr · 1.5% tax · 5.0% vac · 8.0% maint · 8.0% mgmt
Financing live
Cash to close
- Down payment
- $44,975
- Closing costs
- $5,397
- Reserves months
- —
- Total cash needed
- —
Loan-product check · same deal, 3 products live
Conventional
25% down · 7.5% · 30yr
- Down + closing
- —
- Monthly P&I
- —
- Monthly cashflow
- —
- DSCR
- —
- Eligible?
- —
Personal DTI + credit; lowest rate.
DSCR
20% down · 8.5% · 30yr
- Down + closing
- —
- Monthly P&I
- —
- Monthly cashflow
- —
- DSCR
- —
- Eligible?
- —
No personal income docs; deal must DSCR.
Hard money
10% down · 12.0% · 12mo
- Down + closing
- —
- Monthly P&I
- —
- Monthly cashflow
- —
- DSCR
- —
- Eligible?
- —
Short-term bridge; refi at stabilization.
Rent comps 19 comps
| Address | Beds | Baths | Sqft | Rent | $/sqft | DOM | Units | Dist |
|---|---|---|---|---|---|---|---|---|
| 40 Briarwood Ln Branford, CT | 2.0 | 1.0 | 850 | $1,850 | $2.18 | 43d | 1 | 0.10mi |
| 43-59 Briarwood Ln Branford, CT | 2.0 | 1.0 | 900 | $1,825 | $2.03 | 2d | 1 | 0.14mi |
| 30 Grove St Unit B Branford, CT | 2.0 | 1.0 | 900 | $1,825 | $2.03 | 43d | 1 | 0.36mi |
| 245 Alps Rd Branford, CT | 2.0 | 1.0 | 763 | $3,000 | $3.93 | 2d | 1 | 0.56mi |
| 322 Clark Ave Branford, CT | 2.0 | 2.0 | 960 | $2,500 | $2.60 | 2d | 1 | 0.72mi |
| 45 Jefferson Pl Unit 15 Branford, CT | 2.0 | 1.0 | 900 | $1,999 | $2.22 | 2d | 1 | 0.79mi |
| 35 Harbor St Branford, CT | 1.0 | 1.0 | 900 | $2,350 | $2.61 | 3d | 1 | 0.95mi |
| 7 Mona Ave Unit 7 Branford, CT | 2.0 | 1.0 | 1000 | $2,200 | $2.20 | 43d | 1 | 1.03mi |
| 245 W Main St Unit 1 Branford, CT | 2.0 | 2.0 | 950 | $2,850 | $3.00 | 2d | 1 | 1.11mi |
| 96 Main St #2 Branford, CT | 1.0 | 1.0 | 1073 | $1,400 | $1.30 | 23d | 1 | 1.11mi |
| 49 N Harbor St Unit 1 Branford, CT | 3.0 | 1.0 | 1118 | $2,150 | $1.92 | 44d | 1 | 1.12mi |
| 27 Gilbert Ln Branford, CT | 3.0 | 1.0 | 925 | $1,975 | $2.14 | 3d | 1 | 1.14mi |
| 57 Montoya Cir Branford, CT | 1.0–2.0 | 1.0–2.0 | 1180 | $2,698 | $2.29 | 2d | 1 | 1.15mi |
| 56 Maple St Branford, CT | 1.0–2.0 | 1.0–2.0 | 1083 | $4,100 | $3.79 | 2d | 6 | 1.18mi |
| 155 W Main St Unit 2 Branford, CT | 3.0 | 1.5 | 1100 | $2,300 | $2.09 | 43d | 1 | 1.18mi |
| 52 Maple St Unit 402 Branford, CT | 1.0 | 1.0 | 690 | $2,500 | $3.62 | 43d | 1 | 1.19mi |
| 52 Maple St Unit 206 Branford, CT | 1.0 | 1.0 | 540 | $2,150 | $3.98 | 43d | 1 | 1.19mi |
| 52 Maple St Unit 414 Branford, CT | 2.0 | 2.0 | 1029 | $3,700 | $3.60 | 43d | 1 | 1.19mi |
| 40 Rogers St Unit 1 Branford, CT | 2.0 | 1.0 | 1081 | $2,400 | $2.22 | 43d | 1 | 1.46mi |
HOA detail condo
- Monthly dues
- $409 · $4,908/yr
- Likely covers
- waterelectric
- Assessments
- None detected in remarks — confirm with the listing agent.
Listing history 9 events
-
2026-06-18status $179,900 Under Contract 10 DOM
-
2026-06-18days on market $179,900 Active 10 DOM
-
2026-06-17days on market $179,900 Active 9 DOM
-
2026-06-16days on market $179,900 Active 8 DOM
-
2026-06-15days on market $179,900 Active 7 DOM
-
2026-06-14days on market $179,900 Active 5 DOM
-
2026-06-10days on market $179,900 Active 2 DOM
-
2026-06-09remarks 690-char remark
-
2026-06-09$179,900 Active 1 DOM
ⓘ Source: listings_history table (triggers on properties + properties_extension) + one-shot
backfill from property_details.listing_events for pre-trigger history.
Tax reassessment forecast CT · Partial reset (capped growth)
- Current annual tax
- $1,740 · $145/mo
- Projected year-2 tax
- $2,795 · $233/mo
- Expected delta
- +$1,055/yr (+$88/mo · 60.6%)
ⓘ Screening estimate from a state-policy table — verify with the county assessor before closing.
Nearby sold comps map
Loading sold comps map…
Walkable amenities ~0.75 mi
Loading nearby amenities…
Taxation est. · year 1
- Rental income
- $26,117
- − Mortgage interest
- −$10,077
- − Property taxes
- −$1,740
- − Insurance
- −$900
- − Repairs & maintenance
- −$2,089
- − Management
- −$2,089
- − HOA
- −$4,908
- − Depreciation
- −$5,233
- Taxable loss
- −$920
- Est. tax savings @ 24.0%
- +$221
- After-tax cash flow
- $1,984/yr
For passive investors: Depreciation is non-cash, so a rental often shows a tax loss while cash-flowing — sheltering income. Rental losses are passive: they offset passive income freely, and up to $25,000/yr can offset ordinary (W-2) income if you actively participate and your MAGI is under $100k (phasing out to $0 by $150k); unused losses carry forward. On sale, claimed depreciation is recaptured at up to 25%, and gains may owe capital-gains tax (a 1031 exchange can defer both). Figures are a year-1 estimate at your 24.0% rate — not tax advice; consult a CPA.
Schools (NCES district)
- District
- Branford School District
- NCES district ID
- 0900420
- Math proficiency
- 41% ▼ -14.00%
- Reading proficiency
- 52% ▼ -10.00%
- Median HH income
- $70,979
- Composite
- 41.85/100
- National rank
- #3377
- State rank
- #85 of 153 in CT
Livability — Branford
No livability data for this city. (Only ~50 U.S. cities are tracked.)
Census & demographics
- County
- New Haven County · 688,236 people
- City population
- 28,217
- Metro
- New Haven-Milford, CT
- Population (ZIP)
- 28,217
- Household income
- $105,225
- Rent vs Own
- Severe rent burden
- 1132.0
Population outlook (South Central Connecticut County) Hauer SSP2
- By 2040
- 608,362
Race, ethnicity, and origin ACS 2023
- Neighborhood character
- Predominantly White (85%)
- Race & ethnicity
- White 85% Hispanic / Latino 5% Asian 4% Two or more races 4% Black 3%
- Hispanic origin (detail)
- Puerto Rican 1%
- Common ancestry
- Romanian 7% Lithuanian 2% Slovak 2%
- Foreign-born
- 10% · Canada, South Korea
- Languages at home
- 90% English-only · Spanish 4% Other Indo-European 3% Other Asian/Pacific 1%
Political lean MEDSL · South Central Connecticut
- 2024 margin
- Strong D (+20.1) · D 59.0% · R 38.9% · Other 2.1%
- All cycles
- 2024: D+20.1
Not yet ingested
- Civics
- —
Market trends
- HPI YoY
- ▼ -455.72%
- Current HPI
- 189.8481
- Rent YoY
- ▲ 10.58%
- Metro
- New Haven-Milford, CT
- State GDP YoY
- ▲ 1.06%
- F500 in state
- 38
Industry mix (Fortune 500 HQ in CT)
| Industry | F500 HQs | Revenue |
|---|---|---|
| Industrial Machinery | 4 | $38B |
|
||
| Insurance | 3 | $71B |
|
||
| Financial Services | 2 | $25B |
|
||
| Transportation / Logistics | 2 | $18B |
|
||
| Healthcare | 1 | $247B |
|
||
| Telecommunications | 1 | $55B |
|
||
Price history
+274.8% since first listed3 events — show timeline
- 2026-06-08 Listed $179,900 Smart MLS
- 2004-03-11 Sold (Public Records) $120,000 Public Records
- 1994-05-13 Sold (Public Records) $48,000 Public Records
Property tax history
+0.6%/yrLatest (2022): $1,740 · +0.0% YoY. Source: county tax records.
Cash-flow waterfall
monthlySold comps — $/sqft
last 12 mo · ≤1 miLoading sold comps…