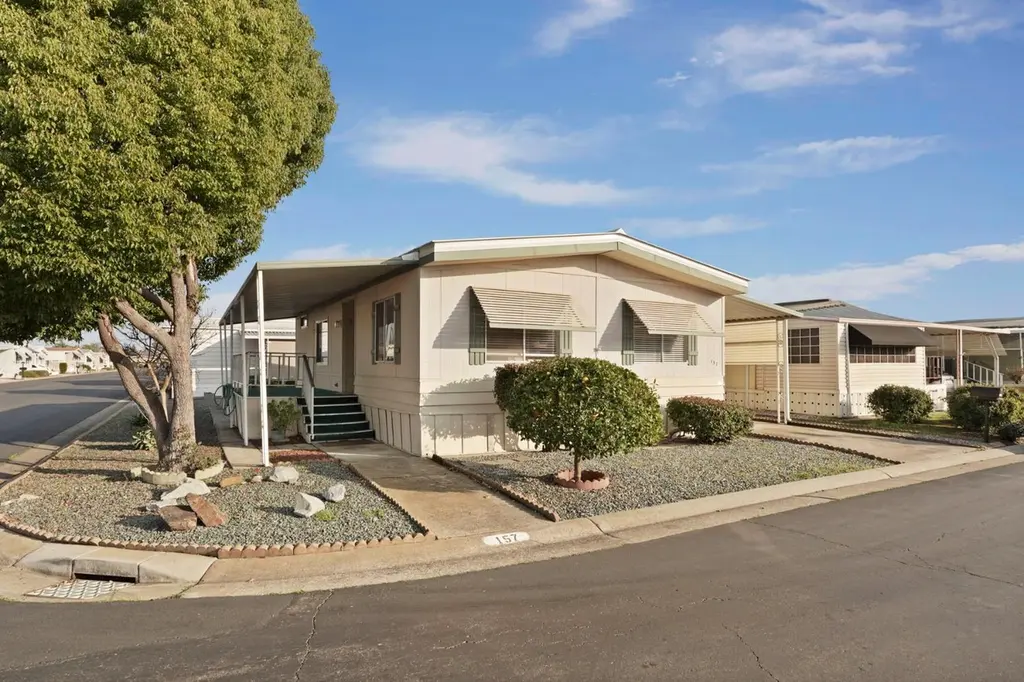
8700 West Ln #157 · Stockton, CA
Flood risk 1/10 · Minimal
- FEMA flood zone
- X
- Chance of flooding over 30 yrs
- 0.0%
- Est. flood insurance / yr
- $507 – $1,088
Fire risk 2/10 · Minimal
- Est. fire insurance / yr
- $659 – $1,223
Heat risk 7/10 · Major
- Hot days now (above 102°F)
- 6 days/yr
- Hot days in 30 yrs
- 13 days/yr
Wind risk 1/10 · Minimal
- Chance of severe wind over 30 yrs
- —
Air-quality risk 10/10 · Severe
- Unhealthy air days now
- 30 days/yr
- Unhealthy air days in 30 yrs
- 30 days/yr
Risk factors via First Street. Map © Google.
Why this score? — see what drove the B- grade
The composite is a weighted blend of 9 inputs, each scored 0–100. Each bar is that input's sub-score; the figure is the points it added to the 100-point composite (weight × sub-score).
- Cash flow +30.0/30.0
- 1% rule +10.0/10.0
- DSCR +10.0/10.0
- ARV discount +7.5/15.0
- Rent growth +4.3/5.0
- Livability +2.9/5.0
- Schools +2.7/10.0
- Condition / age +2.5/5.0
- Appreciation +0.0/10.0
$105,000
🖨 Deal sheet 📄 Offer letter ✓ Due diligence
Listing remarks
Positioned at 8700 West Ln #157, in Stockton, CA, this property extends a compelling invitation. It stands as a great it is a wonder home, particularly appealing to handy homeowners and those with an eye for potential. Within this residence, two inviting bedrooms provide comfortable spaces for rest and rejuvenation, each offering a private retreat. Complementing these sleeping quarters are two bathrooms, ensuring convenience and practicality for daily routines. The kitchen, a central area for culinary endeavors, features a practical stovetop, ready for preparing delightful meals. A dedicated laundry room offers essential utility, simplifying household tasks. Outside, a welcoming porch provi
Key facts
- Parking
- Built 1976
- Listed 143 days
Neighborhood map
What this means for you Summary
Snapshot
- This is a 2-bed/2.0-bath manufactured listed at $105k.
Deal economics
- At list price, monthly cash flow is $558 ($7k/yr) — positive.
- The deal already cash-flows at list — no discount required.
- Meets the 1% rule at list price ($2k rent vs $105k).
- Recommended offer: $92k (12.0% below list) — sets the bar for market timing.
- Cap rate 12.7% vs local median 3.6% in Stockton — top-decile yield for the area; either an underpriced asset or a hidden risk that comps aren't pricing in. Stress-test before assuming the spread holds.
Location & tenants
- Location reads 57/100 on livability (#734 in CA) — a working-class tenant base; expect higher turnover. Strengths: housing A+, health & safety A, amenities A-; Watch: employment C-, schools D-, crime F.
- Lodi Unified (urban): math 24% / reading 36% proficiency, ranked #325 of 517 in CA (top 63%) — families likely to look elsewhere, expect single-tenant / working-renter base with shorter leases.
- Market conditions: Rents rising fast (+7.1%/yr); 102 active listings in the ZIP; 15 comparable units currently listed for rent nearby; rentals at typical pace (median 24d on market — plan ~3-4 weeks tenant-placement turnaround); 40% of comp listings sitting > 30 days — soft ceiling on asking rent; 3,779 units permitted in San Joaquin County in 2024 (0 in 5+ unit buildings).
Forward outlook
- Local home prices are declining (-3.0%/yr); year-one equity from $726 of loan paydown is wiped out by about $3k of value loss. Plan a longer hold.
- San Joaquin County population projected at +17% by 2050 — long-run rental-demand tailwind backs the buy-and-hold thesis.
- At projected returns (-3.0% appreciation + 7.1% rent growth), your $29k cash investment doubles in ~5 years — after that, you're playing with house money.
Negotiation context
- It's been on market 143 days — a 12% lower offer ($92k) is reasonable based on typical stale-listing flexibility.
Risks & watch-outs
- Climate carrying-cost: extreme-heat days projected 6→13/yr by 2055 (HVAC capex compounding) — expect insurance premiums to compound above CPI over the hold.
Questions for the listing agent
- It's been on market 143 days. Have you received any prior offers? Is the seller open to a 12% concession, seller financing, or rate buy-down credit?
- Built in 1976 — when were the roof, HVAC, electrical panel, plumbing, and water heater last replaced?
- Why hasn't it sold? Are there any deal-killer items the seller is aware of (foundation, flood, title, zoning, code violations)?
- Is there a deadline driving the sale (1031 exchange, divorce, estate, relocation)? That informs how much negotiation room exists.
- Schools are D-rated, which usually means shorter tenancies and higher turnover. Who's the typical renter profile here, and what's been the actual vacancy rate?
- Crime grade is F in this area — have there been break-ins, vandalism, or insurance claims at this property in the last 3 years? What carrier currently insures it and at what premium?
- What's the average days-on-market for RENTAL listings here right now (not sales)? A rising rental-DOM trend means longer vacancies and softer asking-rent achievability than the comps imply.
- What's the recent tenant-quality profile in this submarket — average credit score on applications, eviction rate, late-payment / NSF rate, and stable-employment percentage? A property-management company in the area should have these aggregated.
- How much new for-sale + rental construction is in the pipeline within 1–3 miles? Heavy new supply typically softens prices + rents 12–24 months out; constrained supply supports both.
Investment metrics
- 1% rule
- 1.55% ✓
- Cap rate
- 12.67%
- Cash-on-cash
- 22.78%
- DSCR
- 2.01
- GRM
- 5.4
CMA / ARV
- ARV (median comp)
- $66,994
- List price
- $105,000
- Delta
- 56.73%
- Verdict
- OVERPRICED
- Comps
- 7 within 1.0 mi
Show comp detail 8 sales within ~0.75 mi
| Address | Dist | Beds/Ba | Sqft | Sold | Price | $/sf | Match |
|---|---|---|---|---|---|---|---|
| 8600 West Ln #116 | 0.15mi | 2/2.0 | 960 (0%) | 8mo | $60,500 | $63 | 87 |
| 8600 West Ln #68 | 0.12mi | 2/1.0 | 960 (0%) | 6mo | $85,000 | $89 | 85 |
| 8600 West Ln | 0.16mi | 2/2.0 | 1,000 (+4%) | 1mo | $34,000 | $34 | 84 |
| 8600 N West Ln #95 | 0.12mi | 2/2.0 | 940 (-2%) | 14mo | $67,000 | $71 | 79 |
| 8600 West Ln #19 | 0.15mi | 2/2.0 | 1,040 (+8%) | 15mo | $110,000 | $106 | 66 |
| 8600 West Ln #25 | 0.15mi | 3/2.0 (+1) | 1,064 (+11%) | 11mo | $143,000 | $134 | 61 |
| 8600 N West Ln #129 | 0.17mi | 3/2.0 (+1) | 1,022 (+6%) | 20mo | $140,000 | $137 | 60 |
| 8700 NW 8700 West Ln #44 | 0.16mi | 2/2.0 | 1,080 (+12%) | 16mo | $110,000 | $102 | 59 |
Match score weights: distance 35% · size 25% · config 20% · recency 20%. Top-matched comps best support the ARV.
Projected returns pro-forma
-3.0% appreciation · 7.09% rent growth · sell at horizon
- IRR
- 20.2%
- Equity multiple
- 1.87×
- Total profit
- $25,515
- Equity at exit
- $15,656
- IRR
- 31.1%
- Equity multiple
- 4.37×
- Total profit
- $99,169
- Equity at exit
- $9,078
Cash invested: $29,400 (down + closing). Projections, not guarantees.
Landlord ↔ Tenant lean methodology
- Overall (STATE)
- 18 Strongly Tenant-Friendly
- State California
- 18 Strongly Tenant-Friendly · D+13
- County
- — inherits STATE
- City
- — inherits STATE
ZIP-level market 95210
- Rents YoY
- 7.1%
- Active inventory
- 102
- Price-to-rent
- 5.4×
Monthly cashflow live
- Estimated rent
- $1,625 high interval (Pro) →
- Mortgage (P&I)
- −$551
- Tax est. 1.5%
- −$131 /mo · $1,575/yr
- Insurance
- −$44
- HOA
- −$0
- Vacancy / Maint / Mgmt
- −$341
- Net cashflow
- $558
Break-even live
UW: 25.0% down · 7.5% · 30yr · 1.5% tax · 5.0% vac · 8.0% maint · 8.0% mgmt
Financing live
Cash to close
- Down payment
- $26,250
- Closing costs
- $3,150
- Reserves months
- —
- Total cash needed
- —
Loan-product check · same deal, 3 products live
Conventional
25% down · 7.5% · 30yr
- Down + closing
- —
- Monthly P&I
- —
- Monthly cashflow
- —
- DSCR
- —
- Eligible?
- —
Personal DTI + credit; lowest rate.
DSCR
20% down · 8.5% · 30yr
- Down + closing
- —
- Monthly P&I
- —
- Monthly cashflow
- —
- DSCR
- —
- Eligible?
- —
No personal income docs; deal must DSCR.
Hard money
10% down · 12.0% · 12mo
- Down + closing
- —
- Monthly P&I
- —
- Monthly cashflow
- —
- DSCR
- —
- Eligible?
- —
Short-term bridge; refi at stabilization.
Rent comps 15 comps
| Address | Beds | Baths | Sqft | Rent | $/sqft | DOM | Units | Dist |
|---|---|---|---|---|---|---|---|---|
| 9211 Dalewood St Stockton, CA | 2.0 | 1.0 | 898 | $1,495 | $1.66 | 3d | 1 | 0.17mi |
| 1031 Fallbrook Dr Stockton, CA | 2.0 | 2.0 | 962 | $1,695 | $1.76 | 43d | 1 | 0.49mi |
| 7936 Montauban Ave Unit Labs Stockton, CA | 2.0 | 2.0 | 1000 | $1,700 | $1.70 | 10d | 1 | 0.65mi |
| 826 Astor Dr Stockton, CA | 2.0 | 1.0 | 850 | $1,400 | $1.65 | 23d | 1 | 0.76mi |
| 718 Bedlow Dr Stockton, CA | 2.0 | 1.0 | 929 | $1,250 | $1.35 | 43d | 1 | 0.80mi |
| 718 Bedlow Dr Unit 720 Stockton, CA | 2.0 | 1.0 | 929 | $1,250 | $1.35 | 2d | 1 | 0.80mi |
| 7926 Diana Marie Dr Unit 7926 Stockton, CA | 2.0 | 1.0 | 900 | $1,800 | $2.00 | 2d | 1 | 1.04mi |
| 307 Goya Dr Stockton, CA | 2.0 | 1.0 | 808 | $1,395 | $1.73 | 43d | 1 | 1.14mi |
| 6465 West Ln Stockton, CA | 1.0 | 1.0 | 539 | $1,270 | $2.36 | 11d | 1 | 1.26mi |
| 6465 West Ln Stockton, CA | 1.0 | 1.0 | 539 | $1,270 | $2.36 | 23d | 1 | 1.26mi |
| 6465 West Ln Stockton, CA | 1.0 | 1.0 | 539 | $1,320 | $2.45 | 43d | 1 | 1.26mi |
| 7620 N El Dorado St Stockton, CA | 1.0–3.0 | 1.0–2.0 | 827 | $1,538 | $1.86 | 43d | 1 | 1.38mi |
| 8125 Kiltie Way Unit 8125 Stockton, CA | 2.0 | 1.0 | 800 | $1,600 | $2.00 | 19d | 1 | 1.42mi |
| 6807 N El Dorado St Stockton, CA | 2.0 | 1.5 | 980 | $1,750 | $1.79 | 23d | 1 | 1.43mi |
| 8650 Acapulco Way Stockton, CA | 3.0 | 1.5 | 1100 | $2,000 | $1.82 | 43d | 1 | 1.50mi |
Listing history 14 events
-
2026-06-18days on market $105,000 Active 143 DOM
-
2026-06-17days on market $105,000 Active 142 DOM
-
2026-06-16days on market $105,000 Active 141 DOM
-
2026-06-15days on market $105,000 Active 140 DOM
-
2026-06-14days on market $105,000 Active 138 DOM
-
2026-06-10days on market $105,000 Active 135 DOM
-
2026-06-09days on market $105,000 Active 134 DOM
-
2026-06-08days on market $105,000 Active 133 DOM
-
2026-06-07days on market $105,000 Active 132 DOM
-
2026-06-05days on market $105,000 Active 129 DOM
-
2026-06-03days on market $105,000 Active 128 DOM
-
2026-06-03days on market $105,000 Active 127 DOM
-
2026-06-01days on market $105,000 Active 126 DOM
-
2026-05-31days on market $105,000 Active 125 DOM
ⓘ Source: listings_history table (triggers on properties + properties_extension) + one-shot
backfill from property_details.listing_events for pre-trigger history.
Climate risk First Street
- Flood 1/10 Low FEMA zone X · 0% chance over 30 yrs
- Wildfire 2/10 Low
- Heat 7/10 Severe 6 d/yr ≥102°F today · 13 d/yr by 30 yrs out
- Wind 1/10 Low
- Air quality 10/10 Extreme 30 unhealthy d/yr today · 30 by 30 yrs out
Nearby sold comps map
Loading sold comps map…
Walkable amenities ~0.75 mi
Loading nearby amenities…
Taxation est. · year 1
- Rental income
- $19,499
- − Mortgage interest
- −$5,882
- − Property taxes
- −$1,575
- − Insurance
- −$525
- − Repairs & maintenance
- −$1,560
- − Management
- −$1,560
- − Depreciation
- −$3,055
- Taxable income
- $5,343
- Est. tax owed @ 24.0%
- −$1,282
- After-tax cash flow
- $5,414/yr
For passive investors: Depreciation is non-cash, so a rental often shows a tax loss while cash-flowing — sheltering income. Rental losses are passive: they offset passive income freely, and up to $25,000/yr can offset ordinary (W-2) income if you actively participate and your MAGI is under $100k (phasing out to $0 by $150k); unused losses carry forward. On sale, claimed depreciation is recaptured at up to 25%, and gains may owe capital-gains tax (a 1031 exchange can defer both). Figures are a year-1 estimate at your 24.0% rate — not tax advice; consult a CPA.
Schools (NCES district)
- District
- Lodi Unified
- NCES district ID
- 0622230
- Math proficiency
- 24% ▼ -8.00%
- Reading proficiency
- 36% ▼ -8.00%
- Median HH income
- $57,165
- Composite
- 26.84/100
- National rank
- #7108
- State rank
- #325 of 517 in CA
Livability — Stockton
- Score
- 57/100
- State rank
- #734
- US rank
- #21638
Category grades
Schools grade is shown separately in the Schools card above.
Census & demographics
- Census place
- Stockton, CA
- County
- San Joaquin County · 729,570 people
- City population
- 332,006
- Metro
- Stockton, CA
- Population (ZIP)
- 41,549
- Household income
- $67,991
- Rent vs Own
- Severe rent burden
- 1817.0
Population outlook (San Joaquin County) Hauer SSP2
- Today (2025)
- 796,965 people
- By 2030
- 828,849 · +4.0%
- By 2040
- 885,611 · +11.1%
- By 2050
- 929,798 · +16.7%
- By 2075
- 994,578 · +24.8%
- By 2100
- 971,291 · +21.9%
Race, ethnicity, and origin ACS 2023
- Neighborhood character
- Highly diverse neighborhood (Simpson 0.73)
- Race & ethnicity
- Hispanic / Latino 38% Asian 31% Two or more races 21% White 13% Black 11% Pacific Islander 1%
- Hispanic origin (detail)
- Mexican 34%
- Common ancestry
- Italian 1% Russian 1%
- Foreign-born
- 27% · Canada, Vietnam, China
- Languages at home
- 49% English-only · Spanish 25% Other Asian/Pacific 12% Other Indo-European 6%
Political lean MEDSL · San Joaquin
- 2024 margin
- Toss-up / Even · D 48.0% · R 48.9% · Other 3.0%
- 2008→2024 swing
- -11.6pp toward R · 2008: 10.7pp · 2024: -0.9pp
- All cycles
- 2024: R+0.9 2020: D+13.9 2016: D+12.9 2012: D+8.9 2008: D+10.7
Not yet ingested
- Civics
- —
Market trends
- HPI YoY
- ▼ -283.31%
- Current HPI
- 349.495
- Rent YoY
- ▲ 7.09%
- Metro
- Stockton, CA
- State GDP YoY
- ▲ 3.21%
- F500 in state
- 116
Industry mix (Fortune 500 HQ in CA)
| Industry | F500 HQs | Revenue |
|---|---|---|
| Technology | 27 | $1,492B |
|
||
| Financial Services | 3 | $174B |
|
||
| Retail | 3 | $44B |
|
||
| Insurance | 3 | $26B |
|
||
| Media / Entertainment | 2 | $115B |
|
||
| Pharmaceuticals / Biotech | 2 | $62B |
|
||
Cash-flow waterfall
monthlySold comps — $/sqft
last 12 mo · ≤1 miLoading sold comps…