806 Sunset Trl · Franklin, NY
Flood risk 1/10 · Minimal
- FEMA flood zone
- X (unshaded)
- Chance of flooding over 30 yrs
- 0.0%
- Est. flood insurance / yr
- $473 – $860
Fire risk 2/10 · Minimal
- Est. fire insurance / yr
- $691 – $1,283
Heat risk 1/10 · Minimal
- Hot days now (above 89°F)
- 6 days/yr
- Hot days in 30 yrs
- 14 days/yr
Wind risk 2/10 · Minimal
- Chance of severe wind over 30 yrs
- 1.0%
Air-quality risk 2/10 · Minimal
- Unhealthy air days now
- 0 days/yr
- Unhealthy air days in 30 yrs
- 1 days/yr
Risk factors via First Street. Map © Google.
Why this score? — see what drove the D grade
The composite is a weighted blend of 9 inputs, each scored 0–100. Each bar is that input's sub-score; the figure is the points it added to the 100-point composite (weight × sub-score).
- ARV discount +15.0/15.0
- Appreciation +10.0/10.0
- Cash flow +4.9/30.0
- Schools +3.5/10.0
- Livability +3.0/5.0
- Rent growth +2.5/5.0
- Condition / age +2.5/5.0
- 1% rule +0.7/10.0
- DSCR +0.0/10.0
$289,900
🖨 Deal sheet (PDF) 📄 Offer letter ✓ Due diligence
Listing remarks
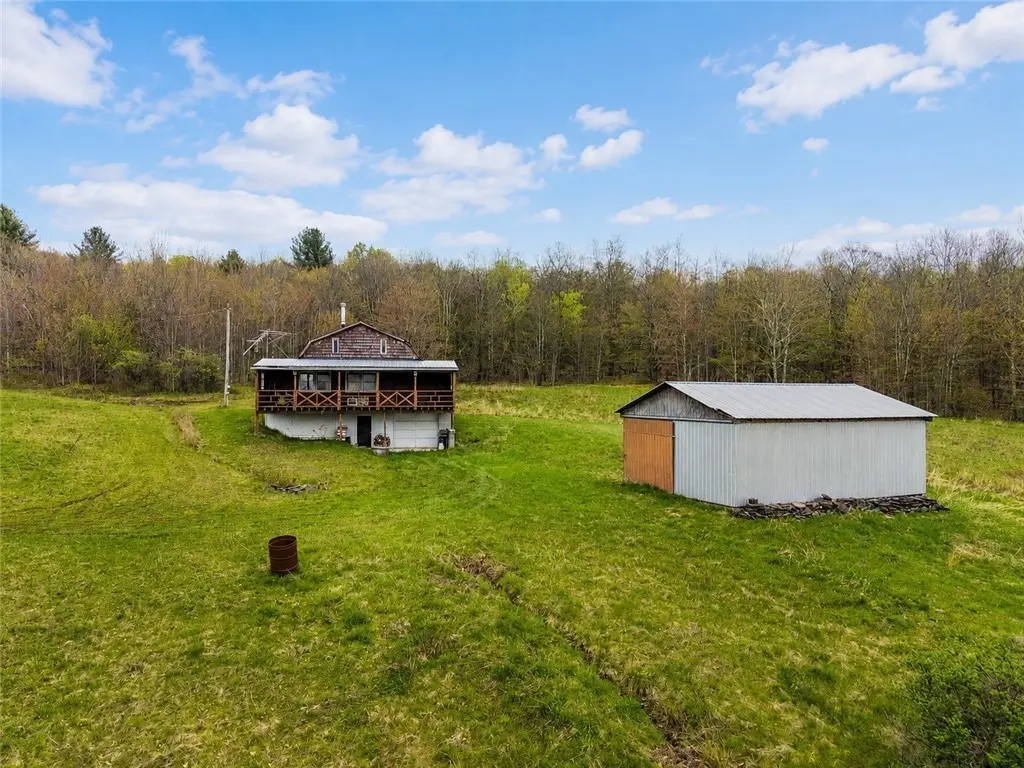
A Sportsman’s Paradise on 49.2 acres of rolling countryside, complete with trails and tree stands throughout. You'll enjoy breathtaking views that stretch for miles and the peace and seclusion outdoor enthusiasts dream of. Designed as the ultimate hunting cabin, you'll find all the necessities to make getting away a breeze. The lower level features a kitchen, large dining area, half bath, and a cozy spot to unwind. Upstairs, you’ll find a living room with a woodstove, two bedrooms, and a full bath. With a few updates like flooring and fresh paint you'll have a great space to enjoy. The loft offers more space for storage or another bedroom. Step onto the covered porch with your c
Key facts
- Covered porch
- 49.2 acres
- Tree stands
Tags
Property features AI
Exterior
- Parking: Attached garage with workshop; 1 garage space
- Utilities: Electricity connected; Well water; Septic tank
- Home design: 3-story property; Existing structure
- Construction: Block, frame and concrete construction with shake siding; Metal and shingle roof; Block and slab foundation
- Exterior features: Balcony; Covered porch; Porch; Dirt driveway; Gravel driveway; TV antenna; Barn(s); Outbuilding; Pond; Irregular, rural, wooded lot; Right-of-way road frontage
Interior
- Kitchen: Electric oven; Electric range; Refrigerator; Galley layout
- Bedrooms: Third-level bedroom; Second-level bedroom; Second-level bedroom
- Flooring: Carpet; Varied flooring
- Bathrooms: One full bathroom; One half bathroom; One main-level bathroom
- Heating & cooling: Electric heating; Wood heating; Baseboard heating
- Interior features: Cathedral ceilings; Separate/formal living room; Galley kitchen; Storage; Convertible bedroom; Egress windows in basement; Walk-out basement access; Two fireplaces
- Laundry & utility: Electric water heater
Neighborhood map
What this means for you Summary
Snapshot
- This is a 3-bed/1.5-bath single-family listed at $290k.
Deal economics
- At list price, monthly cash flow is $-693 ($-8k/yr) — negative.
- To cash-flow at today's rent, offer at most $190k (34.6% below list).
- To meet the 1% rule (rent ≥ 1% of price), the offer needs to be $166k (42.8% below list).
- Recommended offer: $166k (42.8% below list) — sets the bar for 1% rule.
Location & tenants
- Location reads 59/100 on livability (#1,035 in NY) — a working-class tenant base; expect higher turnover. Strengths: housing A+, employment B+, cost of living B+; Watch: health & safety C-, crime D-, amenities F.
- Franklin Central School District (rural): math 35% / reading 40% proficiency, ranked #664 of 755 in NY (top 88%) — families likely to look elsewhere, expect single-tenant / working-renter base with shorter leases.
- Market conditions: 121 active listings in the ZIP; 66 units permitted in Delaware County in 2024 (0 in 5+ unit buildings).
- This rent runs 30% of the median local income ($66k/yr) — at the standard rent-burdened threshold; future hikes will face affordability resistance.
Forward outlook
- In year one you build about $31k of equity ($2k loan paydown + $29k appreciation (10.0% local appreciation)).
- Delaware County population projected at -27% by 2050 — secular population decline; favor cash flow + early exit over multi-decade hold.
- By year 2, paydown + projected appreciation supports a ~$50k cash-out refi (75% LTV) — recoverable capital for the next deal without selling this one.
Negotiation context
- It's been on market 38 days — a 3% lower offer ($281k) is reasonable based on typical stale-listing flexibility.
Questions for the listing agent
- What do current leases actually rent for vs. the listed asking? Can we see a recent rent roll and the last 12 months of T-12 income?
- It's been on market 38 days. Have you received any prior offers? Is the seller open to a 43% concession, seller financing, or rate buy-down credit?
- Is there a deadline driving the sale (1031 exchange, divorce, estate, relocation)? That informs how much negotiation room exists.
- Crime grade is D in this area — have there been break-ins, vandalism, or insurance claims at this property in the last 3 years? What carrier currently insures it and at what premium?
- The area grade is low — what's the realistic commute time and amenity access for the typical tenant pool here? Any planned neighborhood developments (good or bad) we should know about?
- What's the average days-on-market for RENTAL listings here right now (not sales)? A rising rental-DOM trend means longer vacancies and softer asking-rent achievability than the comps imply.
- What's the recent tenant-quality profile in this submarket — average credit score on applications, eviction rate, late-payment / NSF rate, and stable-employment percentage? A property-management company in the area should have these aggregated.
- How much new for-sale + rental construction is in the pipeline within 1–3 miles? Heavy new supply typically softens prices + rents 12–24 months out; constrained supply supports both.
Investment metrics
- 1% rule
- 0.57% ✗
- Cap rate
- 3.43%
- Cash-on-cash
- -10.24%
- DSCR
- 0.54
- GRM
- 14.6
CMA / ARV
- ARV (median comp)
- $439,095
- List price
- $289,900
- Delta
- -33.98%
- Verdict
- UNDERPRICED
- Comps
- 6 within 2.0 mi
Projected returns pro-forma
10.0% appreciation · 3.0% rent growth · sell at horizon
- IRR
- 17.1%
- Equity multiple
- 2.40×
- Total profit
- $113,806
- Equity at exit
- $261,165
- IRR
- 16.2%
- Equity multiple
- 5.56×
- Total profit
- $369,875
- Equity at exit
- $563,212
Cash invested: $81,172 (down + closing). Projections, not guarantees.
Landlord ↔ Tenant lean methodology
- Overall (STATE)
- 15 Strongly Tenant-Friendly
- State New York
- 15 Strongly Tenant-Friendly · D+10
- County
- — inherits STATE
- City
- — inherits STATE
ZIP-level market 13820
- Home prices YoY
- 22.7%
- Active inventory
- 121
- Price-to-rent
- 14.6×
Monthly cashflow live
- Estimated rent
- $1,659 medium interval (Pro) →
- Mortgage (P&I)
- −$1,520
- Tax est. 1.5%
- −$362 /mo · $4,348/yr
- Insurance
- −$121
- HOA
- −$0
- Vacancy / Maint / Mgmt
- −$348
- Net cashflow
- $-693
Break-even live
Sensitivity live
| Price | -10% $-492 | -5% $-592 | +0% $-693 | +5% $-793 | +10% $-893 |
|---|---|---|---|---|---|
| Rent | -10% $-824 | -5% $-758 | +0% $-693 | +5% $-627 | +10% $-561 |
| Rate | -1.0pp $-547 | -0.5pp $-619 | base $-693 | +0.5pp $-768 | +1.0pp $-844 |
UW: 25.0% down · 7.5% · 30yr · 1.5% tax · 5.0% vac · 8.0% maint · 8.0% mgmt
Financing live
Cash to close
- Down payment
- $72,475
- Closing costs
- $8,697
- Reserves months
- —
- Total cash needed
- —
Loan-product check · same deal, 3 products live
Conventional
25% down · 7.5% · 30yr
- Down + closing
- —
- Monthly P&I
- —
- Monthly cashflow
- —
- DSCR
- —
- Eligible?
- —
Personal DTI + credit; lowest rate.
DSCR
20% down · 8.5% · 30yr
- Down + closing
- —
- Monthly P&I
- —
- Monthly cashflow
- —
- DSCR
- —
- Eligible?
- —
No personal income docs; deal must DSCR.
Hard money
10% down · 12.0% · 12mo
- Down + closing
- —
- Monthly P&I
- —
- Monthly cashflow
- —
- DSCR
- —
- Eligible?
- —
Short-term bridge; refi at stabilization.
Listing history 17 events
-
2026-06-22days on market $289,900 Active 38 DOM
-
2026-06-19days on market $289,900 Active 35 DOM
-
2026-06-18days on market $289,900 Active 34 DOM
-
2026-06-17days on market $289,900 Active 33 DOM
-
2026-06-16days on market $289,900 Active 32 DOM
-
2026-06-15days on market $289,900 Active 31 DOM
-
2026-06-14days on market $289,900 Active 29 DOM
-
2026-06-12days on market $289,900 Active 28 DOM
-
2026-06-09days on market $289,900 Active 25 DOM
-
2026-06-08days on market $289,900 Active 24 DOM
-
2026-06-07days on market $289,900 Active 23 DOM
-
2026-06-07days on market $289,900 Active 22 DOM
-
2026-06-02days on market $289,900 Active 18 DOM
-
2026-06-01days on market $289,900 Active 17 DOM
-
2026-05-31days on market $289,900 Active 16 DOM
-
2026-05-31days on market $289,900 Active 15 DOM
-
2026-05-15$289,900 Active 865-char remark
ⓘ Source: listings_history table (triggers on properties + properties_extension) + one-shot
backfill from property_details.listing_events for pre-trigger history.
Climate risk First Street
- Flood 1/10 Low FEMA zone X (unshaded) · 0% chance over 30 yrs
- Wildfire 2/10 Low
- Heat 1/10 Low 6 d/yr ≥89°F today · 14 d/yr by 30 yrs out
- Wind 2/10 Low 100% chance of damaging wind over 30 yrs
- Air quality 2/10 Low 0 unhealthy d/yr today · 1 by 30 yrs out
Nearby sold comps map
Loading sold comps map…
Walkable amenities ~0.75 mi
Loading nearby amenities…
Taxation est. · year 1
- Rental income
- $19,913
- − Mortgage interest
- −$16,239
- − Property taxes
- −$4,348
- − Insurance
- −$1,450
- − Repairs & maintenance
- −$1,593
- − Management
- −$1,593
- − Depreciation
- −$8,433
- Taxable loss
- −$13,744
- Est. tax savings @ 24.0%
- +$3,298
- After-tax cash flow
- $-5,012/yr
For passive investors: Depreciation is non-cash, so a rental often shows a tax loss while cash-flowing — sheltering income. Rental losses are passive: they offset passive income freely, and up to $25,000/yr can offset ordinary (W-2) income if you actively participate and your MAGI is under $100k (phasing out to $0 by $150k); unused losses carry forward. On sale, claimed depreciation is recaptured at up to 25%, and gains may owe capital-gains tax (a 1031 exchange can defer both). Figures are a year-1 estimate at your 24.0% rate — not tax advice; consult a CPA.
Schools (NCES district)
- District
- Franklin Central School District
- NCES district ID
- 3611430
- Math proficiency
- 35% ▼ -5.00%
- Reading proficiency
- 40% ▼ -5.00%
- Median HH income
- $51,231
- Composite
- 35.06/100
- National rank
- #9920
- State rank
- #664 of 755 in NY
Livability — Franklin
- Score
- 59/100
- State rank
- #1035
- US rank
- #20474
Category grades
Schools grade is shown separately in the Schools card above.
Census & demographics
- County
- Otsego County · 23,056 people
- Metro
- Oneonta, NY
- Population (ZIP)
- 23,056
- Household income
- $65,953
- Rent vs Own
- Severe rent burden
- 662.0
Population outlook (Delaware County) Hauer SSP2
- Today (2025)
- 42,668 people
- By 2030
- 40,337 · -5.5%
- By 2040
- 35,514 · -16.8%
- By 2050
- 31,265 · -26.7%
- By 2075
- 24,455 · -42.7%
- By 2100
- 19,529 · -54.2%
Race, ethnicity, and origin ACS 2023
- Neighborhood character
- Predominantly White (84%)
- Race & ethnicity
- White 84% Hispanic / Latino 6% Black 5% Two or more races 5% Asian 2%
- Hispanic origin (detail)
- Puerto Rican 2%
- Common ancestry
- Romanian 4% Slovak 2% Lithuanian 2%
- Foreign-born
- 5% · Canada, China
- Languages at home
- 94% English-only · Spanish 3% Russian/Polish/Slavic 1% Other Indo-European 1%
Political lean MEDSL · Delaware
- 2024 margin
- R (+19.8) · D 40.1% · R 59.9%
- 2008→2024 swing
- -14.6pp toward R · 2008: -5.2pp · 2024: -19.8pp
- All cycles
- 2024: R+19.8 2020: R+18.4 2016: R+29.2 2012: R+9.6 2008: R+5.2
Not yet ingested
- Civics
- —
Market trends
- HPI YoY
- ▲ 67.86%
- Current HPI
- 366.3391
- Rent YoY
- —
- Metro
- Oneonta, NY
- State GDP YoY
- ▲ 2.60%
- F500 in state
- 92
Industry mix (Fortune 500 HQ in NY)
| Industry | F500 HQs | Revenue |
|---|---|---|
| Financial Services | 10 | $950B |
|
||
| Consumer Goods | 9 | $162B |
|
||
| Insurance | 4 | $225B |
|
||
| Telecommunications | 2 | $144B |
|
||
| Pharmaceuticals | 2 | $112B |
|
||
| Media / Entertainment | 2 | $69B |
|
||
Price history
1 event — show timeline
- 2026-05-15 Listed $289,900 UNYREIS
Cash-flow waterfall
monthlySold comps — $/sqft
last 12 mo · ≤1 miLoading sold comps…