4097 46th Ave N · Lealman, FL
Flood risk 1/10 · Minimal
- FEMA flood zone
- X (unshaded)
- Chance of flooding over 30 yrs
- 0.0%
- Est. flood insurance / yr
- $507 – $1,088
Fire risk 1/10 · Minimal
- Est. fire insurance / yr
- $947 – $1,759
Heat risk 10/10 · Severe
- Hot days now (above 106°F)
- 5 days/yr
- Hot days in 30 yrs
- 18 days/yr
Wind risk 10/10 · Severe
- Chance of severe wind over 30 yrs
- 99.0%
Air-quality risk 4/10 · Minor
- Unhealthy air days now
- 4 days/yr
- Unhealthy air days in 30 yrs
- 4 days/yr
Risk factors via First Street. Map © Google.
Why this score? — see what drove the B grade
The composite is a weighted blend of 9 inputs, each scored 0–100. Each bar is that input's sub-score; the figure is the points it added to the 100-point composite (weight × sub-score).
- Cash flow +30.0/30.0
- 1% rule +10.0/10.0
- DSCR +10.0/10.0
- ARV discount +7.5/15.0
- Schools +4.3/10.0
- Livability +4.0/5.0
- Condition / age +2.5/5.0
- Rent growth +2.0/5.0
- Appreciation +0.0/10.0
$72,500
🖨 Deal sheet 📄 Offer letter ✓ Due diligence
Listing remarks
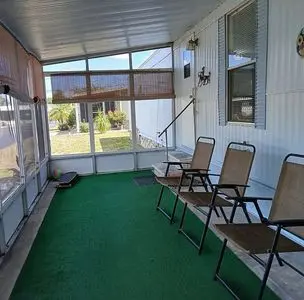
LOVELY 2 br, 1.5 ba, MOBILE HOME IN QUAINT PARK (St. Petersburg) $72,900!! 4097 46th Avenue North, Saint Petersburg, FL 33714. Make time to see this beautiful, totally renovated mobile home in a RESIDENT-OWNED, 55 PLUS park, (First person MUST BE 55, second person 45 and up) where YOU OWN a share of the land. (price includes share of land) Low HOA fee of $150 includes water & amp; lawn care rec hall with laundry room. You are responsible for your own electric and cable/Wifi. NO LOT RENT!!! Owner highly motivated to sell! This absolutely lovely home is complete with a 2-car carport, a lovely, screened patio and 2 large sheds. Tastefully furnished (all of which comes with the home inc
Key facts
- Screened patio
- Resident-owned park
- 2 car carport
Tags
Property features AI
Exterior
- Home design: Built in 1982
- Construction: Living area approximately 728; Built in 1982 construction
- Exterior features: Located in the Twin Gables subdivision
Neighborhood map
What this means for you Summary
Snapshot
- This is a 2-bed/2.0-bath manufactured listed at $72k.
Deal economics
- At list price, monthly cash flow is $1k ($17k/yr) — positive.
- The deal already cash-flows at list — no discount required.
- Meets the 1% rule at list price ($2k rent vs $72k).
- Cap rate 29.6% vs local median 4.7% in Lealman — top-decile yield for the area; either an underpriced asset or a hidden risk that comps aren't pricing in. Stress-test before assuming the spread holds.
Location & tenants
- Location reads 81/100 on livability (#83 in FL, #1,394 nationally) — a professional / high-income tenant draw. Strengths: commute A+, cost of living A+, housing A+; Watch: crime D+, schools F, employment F.
- Pinellas (suburban): math 51% / reading 51% proficiency, ranked #31 of 73 in FL (top 42%) — acceptable for families but not a draw, mixed tenant base, ~2y average lease.
- Market conditions: Rents soft (-2.1%/yr); 165 active listings in the ZIP; 21 comparable units currently listed for rent nearby; rentals at typical pace (median 22d on market — plan ~3-4 weeks tenant-placement turnaround); 2,676 units permitted in Pinellas County in 2024 (1,422 in 5+ unit buildings).
- At $2,418/mo this rent would consume 61% of the median local household income ($47k/yr) (locally 915% of renters already pay >50% of income on rent) — very limited rent-growth headroom before tenants either downsize or default.
Forward outlook
- Local home prices are declining (-3.0%/yr); year-one equity from $501 of loan paydown is wiped out by about $2k of value loss. Plan a longer hold.
- Pinellas County population projected at +14% by 2050 — modest demand growth; plan on rents tracking national, not racing it.
- At projected returns (-3.0% appreciation + 0.0% rent growth), your $20k cash investment doubles in ~2 years — after that, you're playing with house money.
Negotiation context
- Only 14 days on market — expect competitive offers; lowballing is unlikely to land.
- 3 sale attempts since 9y ago with the ask held roughly flat each time — persistent listings suggest the price (not the market) is what's stuck; bring a comps-based counter.
Risks & watch-outs
- Climate carrying-cost: severe wind risk, 99% chance of damaging wind over 30y; extreme-heat days projected 5→18/yr by 2055 (HVAC capex compounding) — expect insurance premiums to compound above CPI over the hold.
Questions for the listing agent
- Is there a deadline driving the sale (1031 exchange, divorce, estate, relocation)? That informs how much negotiation room exists.
- Schools are F-rated, which usually means shorter tenancies and higher turnover. Who's the typical renter profile here, and what's been the actual vacancy rate?
- Crime grade is D in this area — have there been break-ins, vandalism, or insurance claims at this property in the last 3 years? What carrier currently insures it and at what premium?
- What's the average days-on-market for RENTAL listings here right now (not sales)? A rising rental-DOM trend means longer vacancies and softer asking-rent achievability than the comps imply.
- What's the recent tenant-quality profile in this submarket — average credit score on applications, eviction rate, late-payment / NSF rate, and stable-employment percentage? A property-management company in the area should have these aggregated.
- How much new for-sale + rental construction is in the pipeline within 1–3 miles? Heavy new supply typically softens prices + rents 12–24 months out; constrained supply supports both.
Investment metrics
- 1% rule
- 3.34% ✓
- Cap rate
- 29.62%
- Cash-on-cash
- 83.31%
- DSCR
- 4.71
- GRM
- 2.5
CMA / ARV
No comps found within radius.
Projected returns pro-forma
-3.0% appreciation · 0.0% rent growth · sell at horizon
- IRR
- 80.2%
- Equity multiple
- 4.50×
- Total profit
- $70,966
- Equity at exit
- $10,810
- IRR
- 82.9%
- Equity multiple
- 8.40×
- Total profit
- $150,142
- Equity at exit
- $6,268
Cash invested: $20,300 (down + closing). Projections, not guarantees.
Landlord ↔ Tenant lean methodology
- Overall (STATE)
- 87 Strongly Landlord-Friendly
- State Florida
- 87 Strongly Landlord-Friendly · R+3
- County
- — inherits STATE
- City
- — inherits STATE
ZIP-level market 33714
- Home prices YoY
- -30.9%
- Rents YoY
- -2.1%
- Active inventory
- 165
- Price-to-rent
- 2.5×
Monthly cashflow live
- Estimated rent
- $2,418 high interval (Pro) →
- Mortgage (P&I)
- −$380
- Tax est. 1.5%
- −$91 /mo · $1,088/yr
- Insurance
- −$30
- HOA
- −$0
- Vacancy / Maint / Mgmt
- −$508
- Net cashflow
- $1,409
Break-even live
UW: 25.0% down · 7.5% · 30yr · 1.5% tax · 5.0% vac · 8.0% maint · 8.0% mgmt
Financing live
Cash to close
- Down payment
- $18,125
- Closing costs
- $2,175
- Reserves months
- —
- Total cash needed
- —
Loan-product check · same deal, 3 products live
Conventional
25% down · 7.5% · 30yr
- Down + closing
- —
- Monthly P&I
- —
- Monthly cashflow
- —
- DSCR
- —
- Eligible?
- —
Personal DTI + credit; lowest rate.
DSCR
20% down · 8.5% · 30yr
- Down + closing
- —
- Monthly P&I
- —
- Monthly cashflow
- —
- DSCR
- —
- Eligible?
- —
No personal income docs; deal must DSCR.
Hard money
10% down · 12.0% · 12mo
- Down + closing
- —
- Monthly P&I
- —
- Monthly cashflow
- —
- DSCR
- —
- Eligible?
- —
Short-term bridge; refi at stabilization.
Rent comps 21 comps
| Address | Beds | Baths | Sqft | Rent | $/sqft | DOM | Units | Dist |
|---|---|---|---|---|---|---|---|---|
| 3735 39th Ave N Saint Petersburg, FL | 2.0 | 1.0 | 1291 | $2,200 | $1.70 | 4d | 1 | 0.51mi |
| 4220 37th Ave N Saint Petersburg, FL | 3.0 | 1.0 | 1245 | $2,250 | $1.81 | 17d | 1 | 0.61mi |
| 3725 57th Ave N Saint Petersburg, FL | 3.0 | 2.0 | 1800 | $3,200 | $1.78 | 4d | 1 | 0.74mi |
| 5246 Neil Dr Saint Petersburg, FL | 3.0 | 3.0 | 1713 | $3,450 | $2.01 | 21d | 1 | 0.96mi |
| 3132 56th Ave N Saint Petersburg, FL | 3.0 | 2.0 | 1063 | $2,850 | $2.68 | 24d | 1 | 0.98mi |
| 5261 48th Ter N Saint Petersburg, FL | 3.0 | 2.0 | 1283 | $2,400 | $1.87 | 10d | 1 | 1.01mi |
| 5290 48th Ave N Saint Petersburg, FL | 3.0 | 1.0 | 1320 | $2,415 | $1.83 | 4d | 1 | 1.04mi |
| 3200 33rd Ave N Saint Petersburg, FL | 2.0 | 1.5 | 1111 | $2,195 | $1.98 | 24d | 1 | 1.13mi |
| 3664 29th Ave N Saint Petersburg, FL | 2.0 | 1.0 | 1105 | $2,400 | $2.17 | 14d | 1 | 1.14mi |
| 5481 47th Ave N Saint Petersburg, FL | 3.0 | 1.0 | 1520 | $2,250 | $1.48 | 4d | 1 | 1.15mi |
| 5038 54th Way N Saint Petersburg, FL | 3.0 | 2.0 | 1366 | $2,500 | $1.83 | 24d | 1 | 1.17mi |
| 3722 28th St N Unit B St. Petersburg, FL | 1.0 | 1.0 | 1216 | $1,350 | $1.11 | 24d | 1 | 1.20mi |
| 3750 28th Ave N Saint Petersburg, FL | 3.0 | 2.0 | 1512 | $2,830 | $1.87 | 24d | 1 | 1.22mi |
| 5384 56th Ave N Saint Petersburg, FL | 3.0 | 2.0 | 1568 | $3,400 | $2.17 | 24d | 1 | 1.22mi |
| 4116 Yardley Ave N Saint Petersburg, FL | 3.0 | 2.0 | 1680 | $4,150 | $2.47 | 4d | 1 | 1.39mi |
| 4627 67th Ave N Pinellas Park, FL | 3.0 | 2.5 | 1610 | $2,500 | $1.55 | 24d | 1 | 1.39mi |
| 5345 60th Ave N Saint Petersburg, FL | 3.0 | 2.5 | 1740 | $2,400 | $1.38 | 7d | 1 | 1.43mi |
| 4218 24th Ave N Saint Petersburg, FL | 2.0 | 1.0 | 1121 | $1,925 | $1.72 | 4d | 1 | 1.44mi |
| 3300 55th St N Saint Petersburg, FL | 3.0 | 2.0 | 1677 | $3,011 | $1.80 | 21d | 1 | 1.45mi |
| 4732 68th Ave N Pinellas Park, FL | 2.0 | 3.0 | 1210 | $2,000 | $1.65 | 24d | 1 | 1.46mi |
| 6379 29th St N Saint Petersburg, FL | 3.0 | 2.0 | 1323 | $2,869 | $2.17 | 24d | 1 | 1.50mi |
Listing history 6 events
-
2026-05-12$72,500 Active
-
2022-02-25price $1,200
-
2018-03-06historical
-
2018-01-01status Active
-
2017-12-29historical
-
2017-04-17$42,000 Active
ⓘ Source: listings_history table (triggers on properties + properties_extension) + one-shot
backfill from property_details.listing_events for pre-trigger history.
Climate risk First Street
- Flood 1/10 Low FEMA zone X (unshaded) · 0% chance over 30 yrs
- Wildfire 1/10 Low
- Heat 10/10 Extreme 5 d/yr ≥106°F today · 18 d/yr by 30 yrs out
- Wind 10/10 Extreme 99% chance of damaging wind over 30 yrs
- Air quality 4/10 Moderate 4 unhealthy d/yr today · 4 by 30 yrs out
Nearby sold comps map
Loading sold comps map…
Walkable amenities ~0.75 mi
Loading nearby amenities…
Taxation est. · year 1
- Rental income
- $29,019
- − Mortgage interest
- −$4,061
- − Property taxes
- −$1,088
- − Insurance
- −$362
- − Repairs & maintenance
- −$2,322
- − Management
- −$2,322
- − Depreciation
- −$2,109
- Taxable income
- $16,756
- Est. tax owed @ 24.0%
- −$4,021
- After-tax cash flow
- $12,891/yr
For passive investors: Depreciation is non-cash, so a rental often shows a tax loss while cash-flowing — sheltering income. Rental losses are passive: they offset passive income freely, and up to $25,000/yr can offset ordinary (W-2) income if you actively participate and your MAGI is under $100k (phasing out to $0 by $150k); unused losses carry forward. On sale, claimed depreciation is recaptured at up to 25%, and gains may owe capital-gains tax (a 1031 exchange can defer both). Figures are a year-1 estimate at your 24.0% rate — not tax advice; consult a CPA.
Schools (NCES district)
- District
- Pinellas
- NCES district ID
- 1201560
- Math proficiency
- 51% ▼ -5.00%
- Reading proficiency
- 51% ▼ -3.00%
- Median HH income
- $46,270
- Composite
- 43.27/100
- National rank
- #3046
- State rank
- #31 of 73 in FL
Livability — Lealman
- Score
- 81/100
- State rank
- #83
- US rank
- #1394
Category grades
Schools grade is shown separately in the Schools card above.
Census & demographics
- Census place
- Lealman, FL
- County
- Pinellas County · 939,478 people
- City population
- 20,103
- Metro
- Tampa-St. Petersburg-Clearwater, FL
- Population (ZIP)
- 19,227
- Household income
- $47,487
- Rent vs Own
- Severe rent burden
- 915.0
Population outlook (Pinellas County) Hauer SSP2
- Today (2025)
- 1,027,532 people
- By 2030
- 1,063,586 · +3.5%
- By 2040
- 1,125,020 · +9.5%
- By 2050
- 1,168,637 · +13.7%
- By 2075
- 1,265,188 · +23.1%
- By 2100
- 1,260,357 · +22.7%
Race, ethnicity, and origin ACS 2023
- Neighborhood character
- Diverse neighborhood (Simpson 0.55)
- Race & ethnicity
- White 64% Hispanic / Latino 13% Two or more races 12% Black 10% Asian 6%
- Hispanic origin (detail)
- Mexican 2% Puerto Rican 2% Cuban 6% Dominican 1%
- Common ancestry
- Slovak 2% Italian 2% Romanian 2%
- Foreign-born
- 16% · Canada, Vietnam
- Languages at home
- 79% English-only · Spanish 11% Russian/Polish/Slavic 4% Vietnamese 3%
Political lean MEDSL · Pinellas
- 2024 margin
- Lean R (+5.2) · D 46.9% · R 52.1%
- 2008→2024 swing
- -13.5pp toward R · 2008: 8.3pp · 2024: -5.2pp
- All cycles
- 2024: R+5.2 2020: D+0.2 2016: R+1.1 2012: D+5.6 2008: D+8.3
Not yet ingested
- Civics
- —
Market trends
- HPI YoY
- ▼ -179.12%
- Current HPI
- 399.6253
- Rent YoY
- ▼ -2.08%
- Metro
- Tampa-St. Petersburg-Clearwater, FL
- State GDP YoY
- ▲ 3.28%
- F500 in state
- 36
Industry mix (Fortune 500 HQ in FL)
| Industry | F500 HQs | Revenue |
|---|---|---|
| Industrial Technology | 2 | $29B |
|
||
| Insurance | 2 | $17B |
|
||
| Retail | 1 | $60B |
|
||
| Technology Distribution | 1 | $58B |
|
||
| Homebuilding | 1 | $35B |
|
||
| Technology Manufacturing | 1 | $35B |
|
||
Price history
+72.6% since first listed6 events — show timeline
- 2026-05-12 Listed $72,500 FSBO.com
- 2022-02-25 Price Changed $1,200 RENT.
- 2018-03-06 Listing Removed — Stellar MLS as Distributed by MLS Grid
- 2018-01-01 Relisted — Stellar MLS as Distributed by MLS Grid
- 2017-12-29 Listing Removed — Stellar MLS as Distributed by MLS Grid
- 2017-04-17 Listed $42,000 Stellar MLS as Distributed by MLS Grid
Cash-flow waterfall
monthlySold comps — $/sqft
last 12 mo · ≤1 miLoading sold comps…