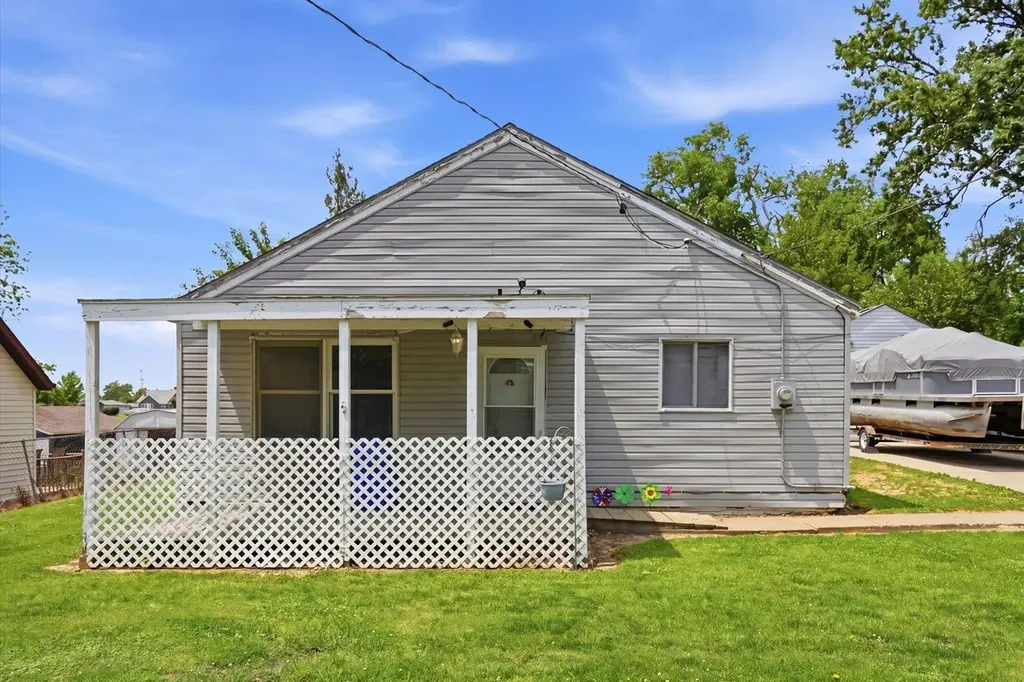
3008 SW Schaeffer Dr · Cedar Rapids, IA
Flood risk 1/10 · Minimal
- FEMA flood zone
- X (unshaded)
- Chance of flooding over 30 yrs
- 0.0%
- Est. flood insurance / yr
- $507 – $1,088
Fire risk 1/10 · Minimal
- Est. fire insurance / yr
- $902 – $1,676
Heat risk 3/10 · Minor
- Hot days now (above 103°F)
- 7 days/yr
- Hot days in 30 yrs
- 15 days/yr
Wind risk 2/10 · Minimal
- Chance of severe wind over 30 yrs
- —
Air-quality risk 2/10 · Minimal
- Unhealthy air days now
- 0 days/yr
- Unhealthy air days in 30 yrs
- 1 days/yr
Risk factors via First Street. Map © Google.
Why this score? — see what drove the C+ grade
The composite is a weighted blend of 9 inputs, each scored 0–100. Each bar is that input's sub-score; the figure is the points it added to the 100-point composite (weight × sub-score).
- Cash flow +19.2/30.0
- ARV discount +15.0/15.0
- DSCR +6.1/10.0
- 1% rule +4.9/10.0
- Rent growth +4.7/5.0
- Schools +4.7/10.0
- Livability +3.9/5.0
- Condition / age +2.5/5.0
- Appreciation +0.0/10.0
$129,900
🖨 Deal sheet 📄 Offer letter ✓ Due diligence
Listing remarks
Charming starter home or investment opportunity situated on a spacious 1/2 acre lot that features mature trees for plenty of shade on those hot summer days! With updated utilities and vinyl windows this home has tons of potential. This property offers plenty of outdoor space, a detached garage, carport, storage shed, and endless potential to make it your own. Enjoy the peaceful evenings in your park like back yard.
Key facts
- Spacious lot
- Outdoor space
- Endless potential
Tags
Property features AI
Finance
- Other: Zoned R-1
Exterior
- Parking: Carport (2 spaces)
- Utilities: Public water; Public sewer
- Home design: Single-family residence; Single-story
- Construction: Vinyl siding; Asphalt roof; Built on a concrete foundation
- Exterior features: Concrete road surface
Interior
- Bathrooms: 1 full bathroom
- Heating & cooling: Central air conditioning; Forced air heating (natural gas)
- Interior features: Basement with concrete construction; No fireplace
Neighborhood map
What this means for you Summary
Snapshot
- This is a 2-bed/1.0-bath single-family listed at $130k.
Deal economics
- At list price, monthly cash flow is $141 ($2k/yr) — positive.
- The deal already cash-flows at list — no discount required.
- To meet the 1% rule (rent ≥ 1% of price), the offer needs to be $129k (0.8% below list).
- Recommended offer: $128k (1.5% below list) — sets the bar for market timing.
- Cap rate 7.6% vs local median 3.5% in Cedar Rapids — top-decile yield for the area; either an underpriced asset or a hidden risk that comps aren't pricing in. Stress-test before assuming the spread holds.
Location & tenants
- Location reads 78/100 on livability (#134 in IA, #2,474 nationally) — a middle-class / working-renter tenant base. Strengths: cost of living A+, housing A+, health & safety A+; Watch: crime C-, commute F.
- Cedar Rapids Community School District (urban): math 50% / reading 59% proficiency, ranked #265 of 289 in IA (top 92%) — acceptable for families but not a draw, mixed tenant base, ~2y average lease.
- Zoned schools: Cedar Rapids Virtual Academy Elementary (17 students, 82% FRL); Cedar Rapids Virtual Academy (47 students, 64% FRL); Thomas Jefferson High School (math 41% / reading 62%, grade D+, #307 of 336 statewide, top 91%, 1,543 students, 56% FRL) — zoned schools average 68% FRL vs 43% district-wide (24 pts higher); higher-poverty schools than district average — tighter screening recommended.
- Market conditions: Rents rising fast (+8.8%/yr); 415 active listings in the ZIP; 1,023 units permitted in Linn County in 2024 (456 in 5+ unit buildings).
Forward outlook
- Local home prices are declining (-3.0%/yr); year-one equity from $898 of loan paydown is wiped out by about $4k of value loss. Plan a longer hold.
- Linn County population projected at +16% by 2050 — long-run rental-demand tailwind backs the buy-and-hold thesis.
- At projected returns (-3.0% appreciation + 8.0% rent growth), your $36k cash investment doubles in ~10 years — after that, you're playing with house money.
Negotiation context
- It's been on market 23 days — a 2% lower offer ($128k) is reasonable based on typical stale-listing flexibility.
- Current owner paid $52k; list at $130k implies a 150% gain — meaningful room to come down on a strong offer.
Risks & watch-outs
- Watch-outs: built in 1945 — expect roof / HVAC / electrical / plumbing capex.
Questions for the listing agent
- Built in 1945 — when were the roof, HVAC, electrical panel, plumbing, and water heater last replaced?
- Is there a deadline driving the sale (1031 exchange, divorce, estate, relocation)? That informs how much negotiation room exists.
- Schools are B-rated — typically a magnet for longer-tenancy family renters. What's the average tenant stay here, and is there a school-zone premium baked into asking?
- What's the average days-on-market for RENTAL listings here right now (not sales)? A rising rental-DOM trend means longer vacancies and softer asking-rent achievability than the comps imply.
- What's the recent tenant-quality profile in this submarket — average credit score on applications, eviction rate, late-payment / NSF rate, and stable-employment percentage? A property-management company in the area should have these aggregated.
- How much new for-sale + rental construction is in the pipeline within 1–3 miles? Heavy new supply typically softens prices + rents 12–24 months out; constrained supply supports both.
Investment metrics
- 1% rule
- 0.99% ✗
- Cap rate
- 7.60%
- Cash-on-cash
- 4.65%
- DSCR
- 1.21
- GRM
- 8.4
CMA / ARV
- ARV (on-the-fly)
- $182,016
- Comps found
- 12
Show comp detail 12 sales within ~0.75 mi
| Address | Dist | Beds/Ba | Sqft | Sold | Price | $/sf | Match |
|---|---|---|---|---|---|---|---|
| 42 Park Village Ave Ave SW | 0.26mi | 3/1.0 (+1) | 1,128 (-2%) | 5mo | $170,000 | $151 | 75 |
| 2910 Schaeffer Dr SW | 0.06mi | 2/2.0 | 1,008 (-12%) | 1mo | $134,000 | $133 | 72 |
| 2601 Teresa Dr Dr SW | 0.47mi | 3/1.5 (+1) | 1,210 (+5%) | 1mo | $195,000 | $161 | 62 |
| 205 26th Ave SW | 0.40mi | 2/1.5 | 1,298 (+13%) | 0mo | $190,000 | $146 | 58 |
| 2418 Victoria Dr | 0.54mi | 3/2.0 (+1) | 1,124 (-2%) | 6mo | $218,000 | $194 | 57 |
| 3203 Tamara Drive Dr SW | 0.31mi | 3/2.0 (+1) | 1,294 (+12%) | 1mo | $185,000 | $143 | 55 |
| 2324 Deborah Dr SW | 0.74mi | 3/1.0 (+1) | 1,202 (+4%) | 4mo | $155,000 | $129 | 50 |
| 2642 Fruitland Blvd SW | 0.66mi | 3/1.0 (+1) | 1,040 (-10%) | 0mo | $182,500 | $175 | 48 |
| 2400 Victoria Dr Dr SW | 0.57mi | 3/2.0 (+1) | 1,040 (-10%) | 1mo | $235,000 | $226 | 47 |
| 186 22nd Ave Ave SW | 0.69mi | 3/1.5 (+1) | 1,063 (-8%) | 4mo | $182,000 | $171 | 45 |
| 2214 Mallory St SW | 0.64mi | 3/1.0 (+1) | 1,283 (+11%) | 9mo | $197,000 | $154 | 38 |
| 189 21st Ave Ave SW | 0.73mi | 2/1.0 | 998 (-13%) | 9mo | $158,000 | $158 | 36 |
Match score weights: distance 35% · size 25% · config 20% · recency 20%. Top-matched comps best support the ARV.
Projected returns pro-forma
-3.0% appreciation · 8.0% rent growth · sell at horizon
- IRR
- -3.7%
- Equity multiple
- 0.86×
- Total profit
- $-5,253
- Equity at exit
- $19,369
- IRR
- 10.9%
- Equity multiple
- 2.05×
- Total profit
- $38,013
- Equity at exit
- $11,231
Cash invested: $36,372 (down + closing). Projections, not guarantees.
Landlord ↔ Tenant lean methodology
- Overall (STATE)
- 83 Strongly Landlord-Friendly
- State Iowa
- 83 Strongly Landlord-Friendly · R+6
- County
- — inherits STATE
- City
- — inherits STATE
ZIP-level market 52404
- Rents YoY
- 8.8%
- Active inventory
- 415
- Price-to-rent
- 8.4×
Monthly cashflow live
- Estimated rent
- $1,289 medium interval (Pro) →
- Mortgage (P&I)
- −$681
- Tax from tax record
- −$142 /mo · $1,702/yr
- Insurance
- −$54
- HOA
- −$0
- Vacancy / Maint / Mgmt
- −$271
- Net cashflow
- $141
Break-even live
UW: 25.0% down · 7.5% · 30yr · 1.5% tax · 5.0% vac · 8.0% maint · 8.0% mgmt
Financing live
Cash to close
- Down payment
- $32,475
- Closing costs
- $3,897
- Reserves months
- —
- Total cash needed
- —
Loan-product check · same deal, 3 products live
Conventional
25% down · 7.5% · 30yr
- Down + closing
- —
- Monthly P&I
- —
- Monthly cashflow
- —
- DSCR
- —
- Eligible?
- —
Personal DTI + credit; lowest rate.
DSCR
20% down · 8.5% · 30yr
- Down + closing
- —
- Monthly P&I
- —
- Monthly cashflow
- —
- DSCR
- —
- Eligible?
- —
No personal income docs; deal must DSCR.
Hard money
10% down · 12.0% · 12mo
- Down + closing
- —
- Monthly P&I
- —
- Monthly cashflow
- —
- DSCR
- —
- Eligible?
- —
Short-term bridge; refi at stabilization.
Listing history 20 events
-
2026-06-19days on market $129,900 Active 23 DOM
-
2026-06-18days on market $129,900 Active 22 DOM
-
2026-06-17days on market $129,900 Active 21 DOM
-
2026-06-16days on market $129,900 Active 20 DOM
-
2026-06-15days on market $129,900 Active 19 DOM
-
2026-06-14days on market $129,900 Active 17 DOM
-
2026-06-13pricedays on market $129,900 Active 16 DOM
-
2026-06-10days on market $139,900 Active 14 DOM
-
2026-06-09days on market $139,900 Active 13 DOM
-
2026-06-08days on market $139,900 Active 12 DOM
-
2026-06-07days on market $139,900 Active 11 DOM
-
2026-06-05days on market $139,900 Active 8 DOM
-
2026-06-03remarks 419-char remark
-
2026-06-03pricedays on market $139,900 Active 7 DOM
-
2026-06-02days on market $144,900 Active 6 DOM
-
2026-06-01days on market $144,900 Active 5 DOM
-
2026-05-31days on market $144,900 Active 4 DOM
-
2026-05-30days on market $144,900 Active 3 DOM
-
2026-05-27$144,900 Active
-
2007-01-10soldstatus $52,000
ⓘ Source: listings_history table (triggers on properties + properties_extension) + one-shot
backfill from property_details.listing_events for pre-trigger history.
Tax reassessment forecast IA · Partial reset (capped growth)
- Current annual tax
- $1,702 · $142/mo
- Projected year-2 tax
- $1,871 · $156/mo
- Expected delta
- +$169/yr (+$14/mo · 9.9%)
ⓘ Screening estimate from a state-policy table — verify with the county assessor before closing.
Climate risk First Street
- Flood 1/10 Low FEMA zone X (unshaded) · 0% chance over 30 yrs
- Wildfire 1/10 Low
- Heat 3/10 Moderate 7 d/yr ≥103°F today · 15 d/yr by 30 yrs out
- Wind 2/10 Low
- Air quality 2/10 Low 0 unhealthy d/yr today · 1 by 30 yrs out
Nearby sold comps map
Loading sold comps map…
Walkable amenities ~0.75 mi
Loading nearby amenities…
Taxation est. · year 1
- Rental income
- $15,465
- − Mortgage interest
- −$7,276
- − Property taxes
- −$1,702
- − Insurance
- −$650
- − Repairs & maintenance
- −$1,237
- − Management
- −$1,237
- − Depreciation
- −$3,779
- Taxable loss
- −$416
- Est. tax savings @ 24.0%
- +$100
- After-tax cash flow
- $1,791/yr
For passive investors: Depreciation is non-cash, so a rental often shows a tax loss while cash-flowing — sheltering income. Rental losses are passive: they offset passive income freely, and up to $25,000/yr can offset ordinary (W-2) income if you actively participate and your MAGI is under $100k (phasing out to $0 by $150k); unused losses carry forward. On sale, claimed depreciation is recaptured at up to 25%, and gains may owe capital-gains tax (a 1031 exchange can defer both). Figures are a year-1 estimate at your 24.0% rate — not tax advice; consult a CPA.
Schools (NCES district)
- District
- Cedar Rapids Community School District
- NCES district ID
- 1906540
- Math proficiency
- 50% ▼ -12.00%
- Reading proficiency
- 59% ▼ -6.00%
- Median HH income
- $53,568
- Composite
- 46.82/100
- National rank
- #2378
- State rank
- #265 of 289 in IA
Livability — Cedar Rapids
- Score
- 78/100
- State rank
- #134
- US rank
- #2474
Category grades
Schools grade is shown separately in the Schools card above.
Census & demographics
- Census place
- Cedar Rapids, IA
- County
- Linn County · 179,860 people
- City population
- 137,154
- Metro
- Cedar Rapids, IA
- Population (ZIP)
- 42,958
- Household income
- $61,870
- Rent vs Own
- Severe rent burden
- 1041.0
Population outlook (Linn County) Hauer SSP2
- Today (2025)
- 239,589 people
- By 2030
- 248,587 · +3.8%
- By 2040
- 264,817 · +10.5%
- By 2050
- 278,685 · +16.3%
- By 2075
- 311,754 · +30.1%
- By 2100
- 336,773 · +40.6%
Race, ethnicity, and origin ACS 2023
- Neighborhood character
- Predominantly White (74%)
- Race & ethnicity
- White 74% Black 10% Two or more races 10% Hispanic / Latino 7%
- Hispanic origin (detail)
- Mexican 5%
- Common ancestry
- Portuguese 3% Lithuanian 2% Romanian 2%
- Foreign-born
- 8% · Canada
- Languages at home
- 90% English-only · Spanish 3% French/Haitian/Cajun 2% Other Asian/Pacific 1%
Political lean MEDSL · Linn
- 2024 margin
- Lean D (+9.9) · D 54.2% · R 44.3% · Other 1.4%
- 2008→2024 swing
- -11.6pp toward R · 2008: 21.5pp · 2024: 9.9pp
- All cycles
- 2024: D+9.9 2020: D+13.7 2016: D+9.0 2012: D+17.6 2008: D+21.5
Not yet ingested
- Civics
- —
Market trends
- HPI YoY
- ▼ -154.96%
- Current HPI
- 241.81
- Rent YoY
- ▲ 8.79%
- Metro
- Cedar Rapids, IA
- State GDP YoY
- ▲ 2.48%
- F500 in state
- 4
Industry mix (Fortune 500 HQ in IA)
| Industry | F500 HQs | Revenue |
|---|---|---|
| Financial Services | 1 | $16B |
|
||
| Retail / Convenience | 1 | $15B |
|
||
Price history
+178.7% since first listed2 events — show timeline
- 2026-05-27 Listed $144,900 NEIRBR as distributed by MLS GRID
- 2007-01-10 Sold (Public Records) $52,000 Public Records
Property tax history
+2.1%/yrLatest (2025): $1,702 · +15.9% YoY. Source: county tax records.
Cash-flow waterfall
monthlySold comps — $/sqft
last 12 mo · ≤1 miLoading sold comps…