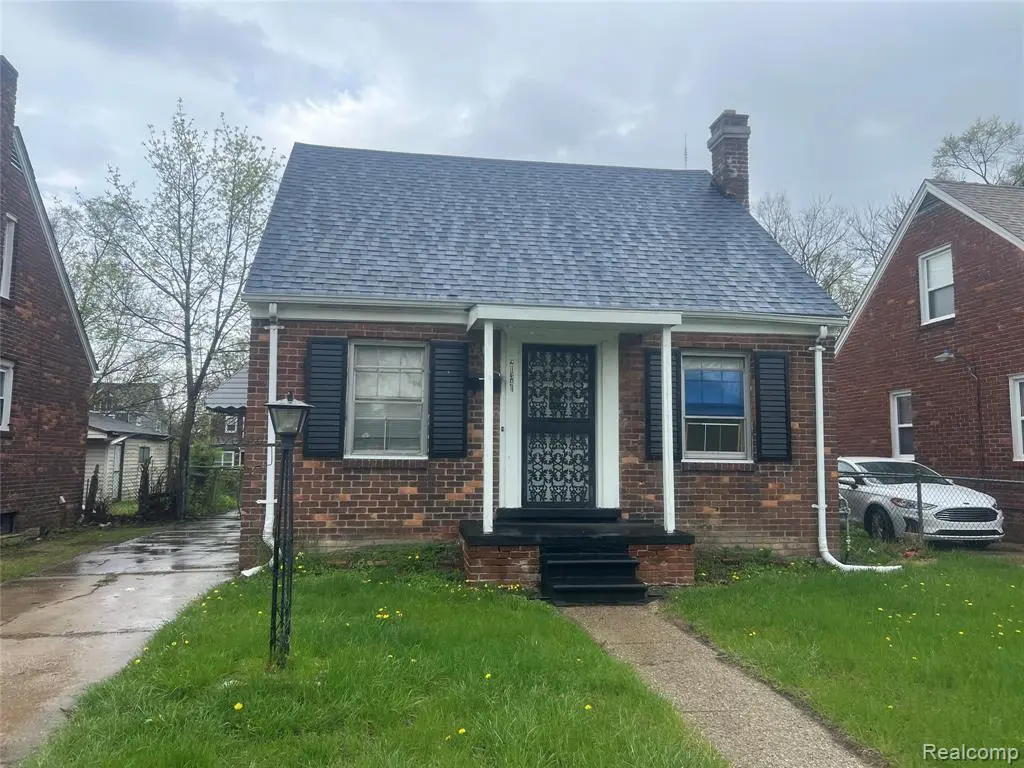
21341 Reimanville Ave · Ferndale, MI
Flood risk 1/10 · Minimal
- FEMA flood zone
- X (unshaded)
- Chance of flooding over 30 yrs
- 0.0%
- Est. flood insurance / yr
- $507 – $1,088
Fire risk 1/10 · Minimal
- Est. fire insurance / yr
- $784 – $1,456
Heat risk 3/10 · Minor
- Hot days now (above 97°F)
- 7 days/yr
- Hot days in 30 yrs
- 14 days/yr
Wind risk 2/10 · Minimal
- Chance of severe wind over 30 yrs
- —
Air-quality risk 4/10 · Minor
- Unhealthy air days now
- 3 days/yr
- Unhealthy air days in 30 yrs
- 6 days/yr
Risk factors via First Street. Map © Google.
Why this score? — see what drove the B+ grade
The composite is a weighted blend of 9 inputs, each scored 0–100. Each bar is that input's sub-score; the figure is the points it added to the 100-point composite (weight × sub-score).
- Cash flow +29.1/30.0
- ARV discount +15.0/15.0
- DSCR +10.0/10.0
- 1% rule +7.9/10.0
- Livability +4.5/5.0
- Rent growth +4.1/5.0
- Schools +2.5/10.0
- Condition / age +2.5/5.0
- Appreciation +0.0/10.0
$129,900
🖨 Deal sheet 📄 Offer letter ✓ Due diligence
Listing remarks MLS
Welcome Home! Discover this charming 3-bedroom bungalow in a prime Ferndale location, blending comfort, convenience, and classic Detroit-area character. Enjoy beautiful hardwood floors, inviting living spaces, and a fully fenced yard ideal for outdoor relaxation. Just minutes from downtown Ferndale's vibrant restaurants, shops, and entertainment, this home offers an incredible opportunity to join one of Metro Detroit's most desirable communities. Key Details: 3 Bedrooms | 1 Bathroom, Fully Fenced Yard, Hardwood Floors Throughout, Move-In Ready - Affordable and, Full of Charm, Minutes from Downtown Ferndale. Seller Prefers Cash Offers Only - please provide Proof of Funds (POF) with all offers.
Key facts
- Fully fenced yard
- Hardwood floors
- 4,792 sq ft lot
Tags
Property features AI
Exterior
- Parking: No garage
- Utilities: Public water; Public sewer; Water and sewer available
- Home design: Single-family residence; One-and-a-half story; Brick construction; Entry at ground level with steps
- Construction: Block foundation
- Exterior features: Paved road access; Lot approximately 0.11 acres (40 x 120.75)
Interior
- Bedrooms: Total of 6 rooms (bedroom count not specified)
- Bathrooms: 1 full bathroom
- Heating & cooling: Forced air heating (natural gas); No cooling
- Interior features: Ground-level entry with steps; Unfinished basement
Neighborhood map
What this means for you Summary
Snapshot
- This is a 3-bed/1.0-bath single-family listed at $130k.
Deal economics
- At list price, monthly cash flow is $447 ($5k/yr) — positive.
- The deal already cash-flows at list — no discount required.
- Meets the 1% rule at list price ($2k rent vs $130k).
- Recommended offer: $128k (1.5% below list) — sets the bar for market timing.
- Cap rate 10.4% vs local median 4.5% in Ferndale — top-decile yield for the area; either an underpriced asset or a hidden risk that comps aren't pricing in. Stress-test before assuming the spread holds.
Location & tenants
- Location reads 90/100 on livability (#8 in MI, #103 nationally) — a professional / high-income tenant draw. Strengths: amenities A+, commute A+, employment A+; Watch: schools D+.
- Ferndale Public Schools (suburban): math 18% / reading 39% proficiency, ranked #366 of 540 in MI (top 68%) — low school quality limits family demand, transient renter base, plan for 1-2y turnover.
- Market conditions: Rents rising fast (+6.2%/yr); 171 active listings in the ZIP; 40 comparable units currently listed for rent nearby; rentals at typical pace (median 25d on market — plan ~3-4 weeks tenant-placement turnaround); solid renter incomes; 2,614 units permitted in Oakland County in 2024 (721 in 5+ unit buildings).
Forward outlook
- Local home prices are declining (-3.0%/yr); year-one equity from $898 of loan paydown is wiped out by about $4k of value loss. Plan a longer hold.
- Oakland County population projected at +10% by 2050 — modest demand growth; plan on rents tracking national, not racing it.
- At projected returns (-3.0% appreciation + 6.2% rent growth), your $36k cash investment doubles in ~7 years — after that, you're playing with house money.
Negotiation context
- It's been on market 19 days — a 2% lower offer ($128k) is reasonable based on typical stale-listing flexibility.
- 14 sale attempts since 9y ago with the ask held roughly flat each time — persistent listings suggest the price (not the market) is what's stuck; bring a comps-based counter.
Risks & watch-outs
- Watch-outs: built in 1946 — expect roof / HVAC / electrical / plumbing capex.
Questions for the listing agent
- Built in 1946 — when were the roof, HVAC, electrical panel, plumbing, and water heater last replaced?
- Is there a deadline driving the sale (1031 exchange, divorce, estate, relocation)? That informs how much negotiation room exists.
- Schools are D-rated, which usually means shorter tenancies and higher turnover. Who's the typical renter profile here, and what's been the actual vacancy rate?
- What's the average days-on-market for RENTAL listings here right now (not sales)? A rising rental-DOM trend means longer vacancies and softer asking-rent achievability than the comps imply.
- What's the recent tenant-quality profile in this submarket — average credit score on applications, eviction rate, late-payment / NSF rate, and stable-employment percentage? A property-management company in the area should have these aggregated.
- How much new for-sale + rental construction is in the pipeline within 1–3 miles? Heavy new supply typically softens prices + rents 12–24 months out; constrained supply supports both.
Investment metrics
- 1% rule
- 1.29% ✓
- Cap rate
- 10.42%
- Cash-on-cash
- 14.76%
- DSCR
- 1.66
- GRM
- 6.5
CMA / ARV
- ARV (median comp)
- $160,303
- List price
- $129,900
- Delta
- -18.97%
- Verdict
- UNDERPRICED
- Comps
- 20 within 1.0 mi
Show comp detail 12 sales within ~0.75 mi
| Address | Dist | Beds/Ba | Sqft | Sold | Price | $/sf | Match |
|---|---|---|---|---|---|---|---|
| 21395 Westview Ave | 0.08mi | 3/1.0 | 1,100 (+5%) | 3mo | $125,000 | $114 | 86 |
| 20805 Bethlawn Blvd | 0.30mi | 3/1.5 | 1,083 (+3%) | 3mo | $168,500 | $156 | 76 |
| 1368 Northway St | 0.51mi | 3/1.0 | 1,017 (-3%) | 0mo | $264,900 | $260 | 71 |
| 1356 Albany St | 0.52mi | 4/1.0 (+1) | 1,032 (-2%) | 1mo | $205,000 | $199 | 68 |
| 1028 W Hazelhurst St | 0.59mi | 3/1.0 | 1,087 (+4%) | 2mo | $326,400 | $300 | 65 |
| 8796 Saratoga St | 0.57mi | 3/1.0 | 985 (-6%) | 0mo | $233,000 | $237 | 63 |
| 641 Stratford Rd | 0.59mi | 2/1.0 (-1) | 1,100 (+5%) | 0mo | $220,000 | $200 | 59 |
| 1169 W Marshall St | 0.39mi | 3/1.0 | 909 (-13%) | 1mo | $216,000 | $238 | 58 |
| 10311 Saratoga St | 0.72mi | 2/1.0 (-1) | 1,029 (-2%) | 0mo | $139,000 | $135 | 58 |
| 8570 Troy St | 0.58mi | 3/1.5 | 969 (-8%) | 1mo | $260,000 | $268 | 58 |
| 20110 Northlawn St | 0.71mi | 3/1.0 | 1,100 (+5%) | 3mo | $67,000 | $61 | 56 |
| 931 Emwill St | 0.62mi | 2/1.0 (-1) | 900 (-14%) | 1mo | $285,000 | $317 | 42 |
Match score weights: distance 35% · size 25% · config 20% · recency 20%. Top-matched comps best support the ARV.
Projected returns pro-forma
-3.0% appreciation · 6.24% rent growth · sell at horizon
- IRR
- 8.8%
- Equity multiple
- 1.36×
- Total profit
- $13,078
- Equity at exit
- $19,369
- IRR
- 20.6%
- Equity multiple
- 3.00×
- Total profit
- $72,812
- Equity at exit
- $11,231
Cash invested: $36,372 (down + closing). Projections, not guarantees.
Landlord ↔ Tenant lean methodology
- Overall (STATE)
- 62 Landlord-Friendly
- State Michigan
- 62 Landlord-Friendly · EVEN
- County
- — inherits STATE
- City
- — inherits STATE
ZIP-level market 48220
- Rents YoY
- 6.2%
- Active inventory
- 171
- Price-to-rent
- 6.5×
Monthly cashflow live
- Estimated rent
- $1,673 high interval (Pro) →
- Mortgage (P&I)
- −$681
- Tax from tax record
- −$139 /mo · $1,670/yr
- Insurance
- −$54
- HOA
- −$0
- Vacancy / Maint / Mgmt
- −$351
- Net cashflow
- $447
Break-even live
UW: 25.0% down · 7.5% · 30yr · 1.5% tax · 5.0% vac · 8.0% maint · 8.0% mgmt
Financing live
Cash to close
- Down payment
- $32,475
- Closing costs
- $3,897
- Reserves months
- —
- Total cash needed
- —
Loan-product check · same deal, 3 products live
Conventional
25% down · 7.5% · 30yr
- Down + closing
- —
- Monthly P&I
- —
- Monthly cashflow
- —
- DSCR
- —
- Eligible?
- —
Personal DTI + credit; lowest rate.
DSCR
20% down · 8.5% · 30yr
- Down + closing
- —
- Monthly P&I
- —
- Monthly cashflow
- —
- DSCR
- —
- Eligible?
- —
No personal income docs; deal must DSCR.
Hard money
10% down · 12.0% · 12mo
- Down + closing
- —
- Monthly P&I
- —
- Monthly cashflow
- —
- DSCR
- —
- Eligible?
- —
Short-term bridge; refi at stabilization.
Rent comps 40 comps
| Address | Beds | Baths | Sqft | Rent | $/sqft | DOM | Units | Dist |
|---|---|---|---|---|---|---|---|---|
| 21374 Ithaca Ave Ferndale, MI | 3.0 | 1.0 | 996 | $1,775 | $1.78 | 24d | 1 | 0.35mi |
| 1557 Leroy St Ferndale, MI | 3.0 | 2.0 | 1380 | $2,523 | $1.83 | 5d | 1 | 0.40mi |
| 631 Shasta Pl Ferndale, MI | 3.0 | 2.0 | 1317 | $2,100 | $1.59 | 44d | 1 | 0.48mi |
| 20458 Indiana St Detroit, MI | 3.0 | 1.0 | 1049 | $1,300 | $1.24 | 18d | 1 | 0.49mi |
| 20445 Kentucky St Detroit, MI | 3.0 | 1.0 | 1046 | $1,200 | $1.15 | 24d | 1 | 0.54mi |
| 578 Kensington Ave Ferndale, MI | 2.0 | 1.0 | 860 | $1,600 | $1.86 | 5d | 1 | 0.57mi |
| 20515 Ilene St Detroit, MI | 3.0 | 1.0 | 891 | $1,450 | $1.63 | 44d | 1 | 0.58mi |
| 22811 Rosewood St Oak Park, MI | 3.0 | 1.0 | 1000 | $1,600 | $1.60 | 24d | 1 | 0.61mi |
| 1491 W Nine Mile Rd Unit 9 Ferndale, MI | 2.0 | 1.0 | 900 | $1,350 | $1.50 | 44d | 1 | 0.62mi |
| 20185 Indiana St Detroit, MI | 2.0 | 1.5 | 1096 | $1,275 | $1.16 | 44d | 1 | 0.63mi |
| 510 Stratford Rd Ferndale, MI | 2.0 | 1.0 | 965 | $1,750 | $1.81 | 44d | 1 | 0.64mi |
| 20460 Griggs St Detroit, MI | 2.0 | 1.0 | 910 | $1,100 | $1.21 | 17d | 1 | 0.64mi |
| 695 Livernois St Unit 1 Ferndale, MI | 2.0 | 2.0 | 1500 | $2,750 | $1.83 | 13d | 1 | 0.67mi |
| 695 Livernois St Unit 2 Ferndale, MI | 2.0 | 1.0 | 950 | $2,350 | $2.47 | 4d | 1 | 0.67mi |
| 10020 Corning St Oak Park, MI | 2.0 | 1.0 | 829 | $1,400 | $1.69 | 24d | 1 | 0.67mi |
| 20110 Northlawn St Detroit, MI | 3.0 | 1.0 | 1100 | $1,350 | $1.23 | 17d | 1 | 0.67mi |
| 1260 W Nine Mile Rd Unit 13 Ferndale, MI | 2.0 | 1.0 | 1000 | $1,399 | $1.40 | 15d | 1 | 0.70mi |
| 10000 W Nine Mile Rd Unit 3 Oak Park, MI | 2.0 | 1.0 | 900 | $1,000 | $1.11 | 44d | 1 | 0.73mi |
| 20045 Greenlawn St Detroit, MI | 3.0 | 1.0 | 925 | $1,350 | $1.46 | 44d | 1 | 0.73mi |
| 10050 W Nine Mile Rd Unit 18 Oak Park, MI | 2.0 | 1.0 | 900 | $1,000 | $1.11 | 5d | 1 | 0.74mi |
| 20009 Wisconsin St Detroit, MI | 3.0 | 1.5 | 1051 | $1,400 | $1.33 | 17d | 1 | 0.76mi |
| 19986 Cherrylawn St Detroit, MI | 4.0 | 1.5 | 1144 | $1,700 | $1.49 | 17d | 1 | 0.77mi |
| 10400 Saratoga St Oak Park, MI | 2.0 | 1.0 | 829 | $1,450 | $1.75 | 5d | 1 | 0.77mi |
| 851 Gardendale St Ferndale, MI | 2.0 | 1.0 | 933 | $1,625 | $1.74 | 24d | 1 | 0.84mi |
| 20429 Monte Vista St Detroit, MI | 3.0 | 1.0 | 872 | $1,300 | $1.49 | 17d | 1 | 0.85mi |
| 20245 Manor Detroit, MI | 3.0 | 1.0 | 1018 | $1,400 | $1.38 | 3d | 1 | 0.92mi |
| 20038 Santa Rosa Dr Detroit, MI | 3.0 | 1.0 | 927 | $1,300 | $1.40 | 17d | 1 | 0.94mi |
| 20032 Monte Vista St Detroit, MI | 3.0 | 1.0 | 1000 | $1,294 | $1.29 | 20d | 1 | 0.97mi |
| 20122 Manor St Detroit, MI | 3.0 | 1.0 | 1028 | $1,200 | $1.17 | 44d | 1 | 0.98mi |
| 20643 Stratford Rd Unit 1 Detroit, MI | 2.0 | 1.5 | 1000 | $1,250 | $1.25 | 44d | 1 | 1.05mi |
| 23511 Majestic St Oak Park, MI | 3.0 | 1.0 | 1100 | $1,750 | $1.59 | 24d | 1 | 1.06mi |
| 19929 Monte Vista St Detroit, MI | 3.0 | 1.0 | 860 | $1,450 | $1.69 | 17d | 1 | 1.07mi |
| 430 W 9 Mile Rd Ferndale, MI | 1.0–2.0 | 1.0–2.0 | 754 | $2,827 | $3.75 | 2d | 3 | 1.07mi |
| 12800 W 9 Mile Rd Oak Park, MI | 1.0–2.0 | 1.0 | 775 | $1,250 | $1.61 | 24d | 1 | 1.12mi |
| 901 Saint Louis St Unit 901-02 Ferndale, MI | 2.0 | 1.0 | 800 | $1,395 | $1.74 | 24d | 1 | 1.13mi |
| 901 Saint Louis St Ferndale, MI | 2.0 | 1.0 | 800 | $1,395 | $1.74 | 44d | 1 | 1.13mi |
| 20129 Stratford Rd Unit 2 Detroit, MI | 2.0 | 1.0 | 1100 | $1,223 | $1.11 | 24d | 1 | 1.17mi |
| 22111 Woodward Ave Ferndale, MI | 2.0 | 1.0 | 816 | $3,355 | $4.11 | 17d | 1 | 1.24mi |
| 22148 Dante St #211 Oak Park, MI | 2.0 | 1.0 | 916 | $1,475 | $1.61 | 24d | 1 | 1.27mi |
| 22148 Dante St #211 Oak Park, MI | 2.0 | 2.0 | 916 | $1,475 | $1.61 | 18d | 1 | 1.27mi |
Listing history 38 events
-
2026-04-30$129,900 Active 705-char remark
Show marketing remark (705 chars)
Welcome Home! Discover this charming 3-bedroom bungalow in a prime Ferndale location, blending comfort, convenience, and classic Detroit-area character. Enjoy beautiful hardwood floors, inviting living spaces, and a fully fenced yard ideal for outdoor relaxation. Just minutes from downtown Ferndale's vibrant restaurants, shops, and entertainment, this home offers an incredible opportunity to join one of Metro Detroit's most desirable communities. Key Details: 3 Bedrooms | 1 Bathroom, Fully Fenced Yard, Hardwood Floors Throughout, Move-In Ready - Affordable and, Full of Charm, Minutes from Downtown Ferndale. Seller Prefers Cash Offers Only - please provide Proof of Funds (POF) with all offers.
-
2026-04-30$129,900 Active 725-char remark
Show marketing remark (705 chars)
Welcome Home! Discover this charming 3-bedroom bungalow in a prime Ferndale location, blending comfort, convenience, and classic Detroit-area character. Enjoy beautiful hardwood floors, inviting living spaces, and a fully fenced yard ideal for outdoor relaxation. Just minutes from downtown Ferndale's vibrant restaurants, shops, and entertainment, this home offers an incredible opportunity to join one of Metro Detroit's most desirable communities. Key Details: 3 Bedrooms | 1 Bathroom, Fully Fenced Yard, Hardwood Floors Throughout, Move-In Ready - Affordable and, Full of Charm, Minutes from Downtown Ferndale. Seller Prefers Cash Offers Only - please provide Proof of Funds (POF) with all offers.
-
2026-04-29historical
-
2026-04-29historical
-
2026-03-12price $135,000
-
2026-03-11price $135,000
-
2025-12-16$150,000 Active
-
2025-12-16$150,000 Active
-
2025-12-11historical
-
2025-09-15historical
-
2025-09-15historical
-
2025-08-05$150,000 Active
-
2025-08-05$150,000 Active
-
2024-02-03historical $1,200
-
2024-01-19$1,200
-
2017-09-21historical
-
2017-09-21historical
-
2017-08-18price $74,900
-
2017-08-18price $74,900
-
2017-08-17status Active
-
2017-08-17status Active
-
2017-08-15historical
-
2017-08-15historical
-
2017-08-01price $75,000
-
2017-08-01price $75,000
-
2017-07-31status Active
-
2017-07-31historical
-
2017-06-28price $88,900
-
2017-06-28price $88,900
-
2017-06-23status Active
-
2017-06-23status Active
-
2017-06-23status Pending
-
2017-06-23status Pending
-
2017-06-06price $89,000
-
2017-06-06price $89,000
-
2017-05-03$110,000 Active
-
2017-05-02$110,000 Active
-
2016-03-30soldstatus $80,000
ⓘ Source: listings_history table (triggers on properties + properties_extension) + one-shot
backfill from property_details.listing_events for pre-trigger history.
Tax reassessment forecast MI · Partial reset (capped growth)
- Current annual tax
- $1,670 · $139/mo
- Projected year-2 tax
- $1,835 · $153/mo
- Expected delta
- +$165/yr (+$14/mo · 9.9%)
ⓘ Screening estimate from a state-policy table — verify with the county assessor before closing.
Climate risk First Street
- Flood 1/10 Low FEMA zone X (unshaded) · 0% chance over 30 yrs
- Wildfire 1/10 Low
- Heat 3/10 Moderate 7 d/yr ≥97°F today · 14 d/yr by 30 yrs out
- Wind 2/10 Low
- Air quality 4/10 Moderate 3 unhealthy d/yr today · 6 by 30 yrs out
Nearby sold comps map
Loading sold comps map…
Walkable amenities ~0.75 mi
Loading nearby amenities…
Taxation est. · year 1
- Rental income
- $20,077
- − Mortgage interest
- −$7,276
- − Property taxes
- −$1,670
- − Insurance
- −$650
- − Repairs & maintenance
- −$1,606
- − Management
- −$1,606
- − Depreciation
- −$3,779
- Taxable income
- $3,490
- Est. tax owed @ 24.0%
- −$838
- After-tax cash flow
- $4,529/yr
For passive investors: Depreciation is non-cash, so a rental often shows a tax loss while cash-flowing — sheltering income. Rental losses are passive: they offset passive income freely, and up to $25,000/yr can offset ordinary (W-2) income if you actively participate and your MAGI is under $100k (phasing out to $0 by $150k); unused losses carry forward. On sale, claimed depreciation is recaptured at up to 25%, and gains may owe capital-gains tax (a 1031 exchange can defer both). Figures are a year-1 estimate at your 24.0% rate — not tax advice; consult a CPA.
Schools (NCES district)
- District
- Ferndale Public Schools
- NCES district ID
- 2614280
- Math proficiency
- 18% ▼ -3.00%
- Reading proficiency
- 39% ▲ 5.00%
- Median HH income
- $56,069
- Composite
- 25.46/100
- National rank
- #7449
- State rank
- #366 of 540 in MI
Livability — Ferndale
- Score
- 90/100
- State rank
- #8
- US rank
- #103
Category grades
Schools grade is shown separately in the Schools card above.
Census & demographics
- County
- Oakland County · 1,009,092 people
- City population
- 21,527
- Metro
- Detroit-Warren-Dearborn, MI
- Population (ZIP)
- 21,527
- Household income
- $89,881
- Rent vs Own
- Severe rent burden
- 670.0
Population outlook (Oakland County) Hauer SSP2
- Today (2025)
- 1,335,747 people
- By 2030
- 1,375,100 · +2.9%
- By 2040
- 1,435,385 · +7.5%
- By 2050
- 1,469,250 · +10.0%
- By 2075
- 1,531,946 · +14.7%
- By 2100
- 1,450,485 · +8.6%
Race, ethnicity, and origin ACS 2023
- Neighborhood character
- Predominantly White (72%)
- Race & ethnicity
- White 72% Black 15% Two or more races 6% Hispanic / Latino 5% Asian 3%
- Common ancestry
- Romanian 11% Lithuanian 6% Slovak 3%
- Foreign-born
- 4% · Canada, South Korea
- Languages at home
- 95% English-only · Spanish 2% Other Indo-European 1% German/W. Germanic 1%
Political lean MEDSL · Oakland
- 2024 margin
- D (+10.6) · D 54.4% · R 43.8% · Other 1.9%
- 2008→2024 swing
- -3.9pp toward R · 2008: 14.5pp · 2024: 10.6pp
- All cycles
- 2024: D+10.6 2020: D+14.1 2016: D+8.1 2012: D+8.1 2008: D+14.5
Not yet ingested
- Civics
- —
Market trends
- HPI YoY
- ▼ -394.92%
- Current HPI
- 273.0986
- Rent YoY
- ▲ 6.24%
- Metro
- Detroit-Warren-Dearborn, MI
- State GDP YoY
- ▲ 1.37%
- F500 in state
- 28
Industry mix (Fortune 500 HQ in MI)
| Industry | F500 HQs | Revenue |
|---|---|---|
| Automotive Parts | 3 | $48B |
|
||
| Automotive | 2 | $372B |
|
||
| Chemicals | 1 | $45B |
|
||
| Automotive Retail | 1 | $29B |
|
||
| Healthcare / Medical Devices | 1 | $23B |
|
||
| Automotive Technology | 1 | $20B |
|
||
Price history
+56.2% since first listed43 events — show timeline
- 2026-06-17 Sold (MLS) $125,000 REALCOMP
- 2026-06-17 Sold (MLS) $125,000 MiRealSource-MiMLS
- 2026-05-19 Pending — MiRealSource-MiMLS
- 2026-05-19 Pending — REALCOMP
- 2026-05-19 Listing Removed — REALCOMP
- 2026-04-30 Listed $129,900 REALCOMP
- 2026-04-30 Listed $129,900 MiRealSource-MiMLS
- 2026-04-29 Listing Removed — MiRealSource-MiMLS
- 2026-04-29 Listing Removed — REALCOMP
- 2026-03-12 Price Changed $135,000 MiRealSource-MiMLS
- 2026-03-11 Price Changed $135,000 REALCOMP
- 2025-12-16 Listed $150,000 MiRealSource-MiMLS
- 2025-12-16 Listed $150,000 REALCOMP
- 2025-12-11 Coming Soon — MiRealSource-MiMLS
- 2025-09-15 Listing Removed — REALCOMP
- 2025-09-15 Listing Removed — MiRealSource-MiMLS
- 2025-08-05 Listed $150,000 REALCOMP
- 2025-08-05 Listed $150,000 MiRealSource-MiMLS
- 2024-02-03 Rental Removed $1,200 REALCOMP
- 2024-01-19 Listed for Rent $1,200 REALCOMP
- 2017-09-21 Listing Removed — REALCOMP
- 2017-09-21 Listing Removed — MiRealSource-MiMLS
- 2017-08-18 Price Changed $74,900 MiRealSource-MiMLS
- 2017-08-18 Price Changed $74,900 REALCOMP
- 2017-08-17 Relisted — MiRealSource-MiMLS
- 2017-08-17 Relisted — REALCOMP
- 2017-08-15 Listing Removed — REALCOMP
- 2017-08-15 Listing Removed — MiRealSource-MiMLS
- 2017-08-01 Price Changed $75,000 MiRealSource-MiMLS
- 2017-08-01 Price Changed $75,000 REALCOMP
- 2017-07-31 Relisted — MiRealSource-MiMLS
- 2017-07-31 Listing Removed — MiRealSource-MiMLS
- 2017-06-28 Price Changed $88,900 MiRealSource-MiMLS
- 2017-06-28 Price Changed $88,900 REALCOMP
- 2017-06-23 Relisted — MiRealSource-MiMLS
- 2017-06-23 Relisted — REALCOMP
- 2017-06-23 Pending — MiRealSource-MiMLS
- 2017-06-23 Pending — REALCOMP
- 2017-06-06 Price Changed $89,000 MiRealSource-MiMLS
- 2017-06-06 Price Changed $89,000 REALCOMP
- 2017-05-03 Listed $110,000 MiRealSource-MiMLS
- 2017-05-02 Listed $110,000 REALCOMP
- 2016-03-30 Sold (Public Records) $80,000 Public Records
Property tax history
+3.5%/yrLatest (2025): $1,670 · +3.2% YoY. Source: county tax records.
Cash-flow waterfall
monthlySold comps — $/sqft
last 12 mo · ≤1 miLoading sold comps…