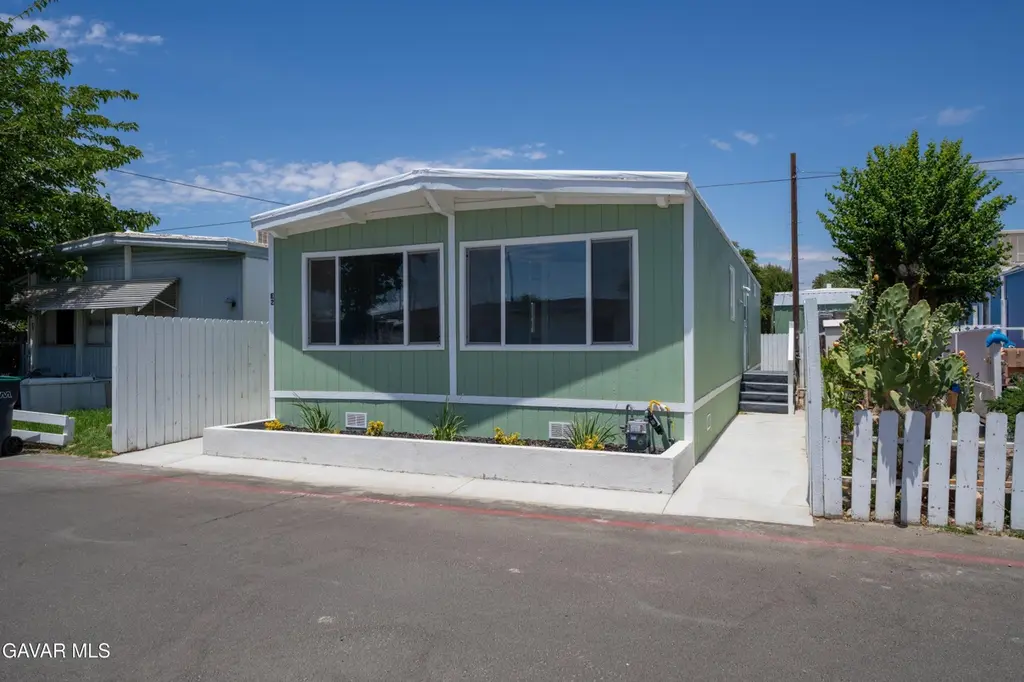
3157 E I Ave Unit E2 · Lancaster, CA
Flood risk 1/10 · Minimal
- FEMA flood zone
- X (shaded)
- Chance of flooding over 30 yrs
- 0.0%
- Est. flood insurance / yr
- $507 – $1,088
Fire risk 6/10 · Moderate
- Est. fire insurance / yr
- $659 – $1,223
Heat risk 7/10 · Major
- Hot days now (above 101°F)
- 6 days/yr
- Hot days in 30 yrs
- 17 days/yr
Wind risk 1/10 · Minimal
- Chance of severe wind over 30 yrs
- —
Air-quality risk 8/10 · Major
- Unhealthy air days now
- 16 days/yr
- Unhealthy air days in 30 yrs
- 21 days/yr
Risk factors via First Street. Map © Google.
Why this score? — see what drove the B- grade
The composite is a weighted blend of 9 inputs, each scored 0–100. Each bar is that input's sub-score; the figure is the points it added to the 100-point composite (weight × sub-score).
- Cash flow +30.0/30.0
- 1% rule +10.0/10.0
- DSCR +10.0/10.0
- ARV discount +7.5/15.0
- Condition / age +4.0/5.0
- Livability +3.4/5.0
- Rent growth +2.5/5.0
- Schools +2.1/10.0
- Appreciation +0.0/10.0
$139,900
🖨 Deal sheet 📄 Offer letter ✓ Due diligence
Listing remarks MLS
Turnkey Elegance Meets Modern Comfort! Welcome home to this impeccably refurbished 3-bedroom, 2-bathroom mobile home. Step inside to discover a bright, open floor plan with large picture windows that flood the living room and third bedroom with natural light. The heart of the home is a chef-inspired kitchen featuring refreshed cabinetry, solid surface countertops, a dedicated pantry, and a built-in wine cabinet. The oversized primary suite serves as a private retreat, boasting a completely remodeled bathroom with a trendy vessel sink and a sleek vanity. Throughout the home, you'll find fresh paint, new flooring, and energy-efficient LED recessed lighting. Enjoy the charming front porch framed by a classic white picket fence and a private, fenced yard. This home also features a covered carport and access to a large community pool. Centrally located near schools, shopping, and dining, this move-in ready gem is priced to sell and will not last!
Key facts
- Open floor plan
- Remodeled bathroom
- Dedicated pantry
Tags
Property features AI
Finance
- Other: Directions: Mobile home park is located on East Avenue I and 32nd Street East
- HOA & community: Mobile home park community (Western Skies)
Exterior
- Parking: Located in Western Skies mobile home park
- Utilities: Public sewer; District/public water; Natural gas connected; Electricity connected; Water connected; Sewer connected
- Home design: Single-story mobile home; Mobile home remains on site; Entry level: 1; Model: Unknown
- Construction: Wood construction; Concrete slab foundation; 20 ft wide by 50 ft long (mobile home dimensions); Year built source: Assessor
- Exterior features: Community pool; Street lighting; Paved road access; Rectangular lot shape
Interior
- Kitchen: No appliances included
- Bedrooms: Primary bedroom with walk-in closet
- Flooring: Laminate flooring
- Bathrooms: Two full bathrooms; Shower and shower-in-tub options
- Heating & cooling: Central cooling; Natural gas central furnace
- Interior features: Ceiling fan; One-level living; Front door entry
- Laundry & utility: Laundry in kitchen
Neighborhood map
What this means for you Summary
Snapshot
- This is a 3-bed/2.0-bath manufactured listed at $140k. Condition is rated good.
Deal economics
- At list price, monthly cash flow is $1k ($14k/yr) — positive.
- The deal already cash-flows at list — no discount required.
- Meets the 1% rule at list price ($3k rent vs $140k).
- Recommended offer: $138k (1.5% below list) — sets the bar for market timing.
- Cap rate 16.4% vs local median 4.3% in Lancaster — top-decile yield for the area; either an underpriced asset or a hidden risk that comps aren't pricing in. Stress-test before assuming the spread holds.
Location & tenants
- Location reads 68/100 on livability (#282 in CA) — a middle-class / working-renter tenant base. Strengths: commute A+, housing A+, amenities B+; Watch: health & safety C-, schools F, crime F.
- Eastside Union Elementary (suburban): math 15% / reading 27% proficiency, ranked #1,226 of 1,400 in CA (top 88%) — low school quality limits family demand, transient renter base, plan for 1-2y turnover; 76% free/reduced lunch — lower-income household profile, screen leases tightly.
- Market conditions: Rents flat; 1169 active listings in the ZIP; 3 comparable units currently listed for rent nearby; rentals at typical pace (median 24d on market — plan ~3-4 weeks tenant-placement turnaround); 19,697 units permitted in Los Angeles County in 2024 (9,426 in 5+ unit buildings).
- At $2,722/mo this rent would consume 46% of the median local household income ($70k/yr) (locally 2494% of renters already pay >50% of income on rent) — very limited rent-growth headroom before tenants either downsize or default.
Forward outlook
- Local home prices are declining (-3.0%/yr); year-one equity from $967 of loan paydown is wiped out by about $4k of value loss. Plan a longer hold.
- Los Angeles County population projected at +9% by 2050 — modest demand growth; plan on rents tracking national, not racing it.
- At projected returns (-3.0% appreciation + 0.1% rent growth), your $39k cash investment doubles in ~4 years — after that, you're playing with house money.
Negotiation context
- It's been on market 20 days — a 2% lower offer ($138k) is reasonable based on typical stale-listing flexibility.
- 2 sale attempts with the ask held roughly flat each time — persistent listings suggest the price (not the market) is what's stuck; bring a comps-based counter.
Risks & watch-outs
- Climate carrying-cost: major wildfire risk; extreme-heat days projected 6→17/yr by 2055 (HVAC capex compounding) — expect insurance premiums to compound above CPI over the hold.
Questions for the listing agent
- Built in 1969 — when were the roof, HVAC, electrical panel, plumbing, and water heater last replaced?
- Is there a deadline driving the sale (1031 exchange, divorce, estate, relocation)? That informs how much negotiation room exists.
- Schools are F-rated, which usually means shorter tenancies and higher turnover. Who's the typical renter profile here, and what's been the actual vacancy rate?
- Crime grade is F in this area — have there been break-ins, vandalism, or insurance claims at this property in the last 3 years? What carrier currently insures it and at what premium?
- What's the average days-on-market for RENTAL listings here right now (not sales)? A rising rental-DOM trend means longer vacancies and softer asking-rent achievability than the comps imply.
- What's the recent tenant-quality profile in this submarket — average credit score on applications, eviction rate, late-payment / NSF rate, and stable-employment percentage? A property-management company in the area should have these aggregated.
- How much new for-sale + rental construction is in the pipeline within 1–3 miles? Heavy new supply typically softens prices + rents 12–24 months out; constrained supply supports both.
Investment metrics
- 1% rule
- 1.95% ✓
- Cap rate
- 16.45%
- Cash-on-cash
- 36.27%
- DSCR
- 2.61
- GRM
- 4.3
CMA / ARV
- ARV (on-the-fly)
- $85,000
- Comps found
- 3
Show comp detail 3 sales within ~0.75 mi
| Address | Dist | Beds/Ba | Sqft | Sold | Price | $/sf | Match |
|---|---|---|---|---|---|---|---|
| 45415 E 28th St E #45 | 0.43mi | 4/2.0 (+1) | 922 (-8%) | 1mo | $90,000 | $98 | 61 |
| 3753 East Ave. I #96 | 0.69mi | 2/2.0 (-1) | 960 (-4%) | 2mo | $80,000 | $83 | 54 |
| 3753 E Avenue I #7 | 0.36mi | 2/1.0 (-1) | 887 (-11%) | 12mo | $75,000 | $85 | 46 |
Match score weights: distance 35% · size 25% · config 20% · recency 20%. Top-matched comps best support the ARV.
Projected returns pro-forma
-3.0% appreciation · 0.14% rent growth · sell at horizon
- IRR
- 28.8%
- Equity multiple
- 2.15×
- Total profit
- $45,157
- Equity at exit
- $20,860
- IRR
- 34.4%
- Equity multiple
- 3.73×
- Total profit
- $107,065
- Equity at exit
- $12,096
Cash invested: $39,172 (down + closing). Projections, not guarantees.
Landlord ↔ Tenant lean methodology
- Overall (STATE)
- 18 Strongly Tenant-Friendly
- State California
- 18 Strongly Tenant-Friendly · D+13
- County
- — inherits STATE
- City
- — inherits STATE
ZIP-level market 93535
- Home prices YoY
- -24.3%
- Rents YoY
- 0.1%
- Active inventory
- 1169
- Price-to-rent
- 4.3×
Monthly cashflow live
- Estimated rent
- $2,722 medium interval (Pro) →
- Mortgage (P&I)
- −$734
- Tax est. 1.5%
- −$175 /mo · $2,098/yr
- Insurance
- −$58
- HOA
- −$0
- Vacancy / Maint / Mgmt
- −$572
- Net cashflow
- $1,184
Break-even live
UW: 25.0% down · 7.5% · 30yr · 1.5% tax · 5.0% vac · 8.0% maint · 8.0% mgmt
Financing live
Cash to close
- Down payment
- $34,975
- Closing costs
- $4,197
- Reserves months
- —
- Total cash needed
- —
Loan-product check · same deal, 3 products live
Conventional
25% down · 7.5% · 30yr
- Down + closing
- —
- Monthly P&I
- —
- Monthly cashflow
- —
- DSCR
- —
- Eligible?
- —
Personal DTI + credit; lowest rate.
DSCR
20% down · 8.5% · 30yr
- Down + closing
- —
- Monthly P&I
- —
- Monthly cashflow
- —
- DSCR
- —
- Eligible?
- —
No personal income docs; deal must DSCR.
Hard money
10% down · 12.0% · 12mo
- Down + closing
- —
- Monthly P&I
- —
- Monthly cashflow
- —
- DSCR
- —
- Eligible?
- —
Short-term bridge; refi at stabilization.
Rent comps 3 comps
| Address | Beds | Baths | Sqft | Rent | $/sqft | DOM | Units | Dist |
|---|---|---|---|---|---|---|---|---|
| 44709 26th St E Lancaster, CA | 3.0 | 2.0 | 1316 | $2,300 | $1.75 | 18d | 1 | 0.93mi |
| 45118 Parkview Ln Lancaster, CA | 2.0 | 2.0 | 980 | $2,500 | $2.55 | 24d | 1 | 1.34mi |
| 2500 Topaz Ln Lancaster, CA | 3.0 | 2.0 | 1274 | $2,800 | $2.20 | 24d | 1 | 1.42mi |
Listing history 14 events
-
2026-06-18days on market $139,900 Active 20 DOM
-
2026-06-17days on market $139,900 Active 19 DOM
-
2026-06-16days on market $139,900 Active 18 DOM
-
2026-06-15days on market $139,900 Active 17 DOM
-
2026-06-13days on market $139,900 Active 15 DOM
-
2026-06-13days on market $139,900 Active 14 DOM
-
2026-06-09days on market $139,900 Active 11 DOM
-
2026-06-08days on market $139,900 Active 10 DOM
-
2026-06-07days on market $139,900 Active 9 DOM
-
2026-06-04days on market $139,900 Active 6 DOM
-
2026-06-03days on market $139,900 Active 5 DOM
-
2026-06-02days on market $139,900 Active 4 DOM
-
2026-06-01days on market $139,900 Active 3 DOM
-
2026-05-31days on market $139,900 Active 2 DOM
ⓘ Source: listings_history table (triggers on properties + properties_extension) + one-shot
backfill from property_details.listing_events for pre-trigger history.
Climate risk First Street
- Flood 1/10 Low FEMA zone X (shaded) · 0% chance over 30 yrs
- Wildfire 6/10 Major
- Heat 7/10 Severe 6 d/yr ≥101°F today · 17 d/yr by 30 yrs out
- Wind 1/10 Low
- Air quality 8/10 Severe 16 unhealthy d/yr today · 21 by 30 yrs out
Nearby sold comps map
Loading sold comps map…
Walkable amenities ~0.75 mi
Loading nearby amenities…
Taxation est. · year 1
- Rental income
- $32,669
- − Mortgage interest
- −$7,837
- − Property taxes
- −$2,098
- − Insurance
- −$700
- − Repairs & maintenance
- −$2,614
- − Management
- −$2,614
- − Depreciation
- −$4,070
- Taxable income
- $12,737
- Est. tax owed @ 24.0%
- −$3,057
- After-tax cash flow
- $11,150/yr
For passive investors: Depreciation is non-cash, so a rental often shows a tax loss while cash-flowing — sheltering income. Rental losses are passive: they offset passive income freely, and up to $25,000/yr can offset ordinary (W-2) income if you actively participate and your MAGI is under $100k (phasing out to $0 by $150k); unused losses carry forward. On sale, claimed depreciation is recaptured at up to 25%, and gains may owe capital-gains tax (a 1031 exchange can defer both). Figures are a year-1 estimate at your 24.0% rate — not tax advice; consult a CPA.
Condition & rehab AI · 12 photos
This turnkey mobile home is in excellent condition with modern updates and a charming curb appeal, making it a great investment for both resale and rental markets.
Value-add opportunities
- Both Landscaping and curb appeal improvements — Enhances both resale and rental value.
- Both Add a small outdoor seating area — Improves both resale and rental value by adding a functional and attractive outdoor space.
Renovation cost estimate screening
Value-add ROI direction
- Both Landscaping and curb appeal improvements — Enhances both resale and rental value. ↑
- Both Add a small outdoor seating area — Improves both resale and rental value by adding a functional and attractive outdoor space. ↑
ⓘ Cost ranges are severity-bucket heuristics (US national rule-of-thumb). Get contractor quotes + a written scope before underwriting a rehab budget.
Schools (NCES district)
- District
- Eastside Union Elementary
- NCES district ID
- 0611910
- Math proficiency
- 15% ▲ 1.00%
- Reading proficiency
- 27% ▲ 3.00%
- Median HH income
- $44,840
- Composite
- 21.43/100
- National rank
- #13636
- State rank
- #1226 of 1400 in CA
Livability — Lancaster
- Score
- 68/100
- State rank
- #282
- US rank
- #9504
Category grades
Schools grade is shown separately in the Schools card above.
Census & demographics
- Census place
- Lancaster, CA
- County
- Los Angeles County · 9,444,647 people
- City population
- 194,251
- Metro
- Los Angeles-Long Beach-Anaheim, CA
- Population (ZIP)
- 79,409
- Household income
- $70,360
- Rent vs Own
- Severe rent burden
- 2494.0
Population outlook (Los Angeles County) Hauer SSP2
- Today (2025)
- 10,940,515 people
- By 2030
- 11,256,481 · +2.9%
- By 2040
- 11,729,929 · +7.2%
- By 2050
- 11,948,407 · +9.2%
- By 2075
- 11,818,114 · +8.0%
- By 2100
- 10,842,928 · -0.9%
Race, ethnicity, and origin ACS 2023
- Neighborhood character
- Diverse neighborhood (Simpson 0.63)
- Race & ethnicity
- Hispanic / Latino 55% Two or more races 25% Black 21% White 17% Asian 2% Native American 1%
- Hispanic origin (detail)
- Mexican 42%
- Common ancestry
- Romanian 1% Italian 1% Lithuanian 1%
- Foreign-born
- 13% · Canada
- Languages at home
- 60% English-only · Spanish 37% Tagalog/Filipino 1% Other Indo-European 1%
Political lean MEDSL · Los Angeles
- 2024 margin
- Solid D (+32.9) · D 64.8% · R 31.9% · Other 3.3%
- 2008→2024 swing
- -7.4pp toward R · 2008: 40.4pp · 2024: 32.9pp
- All cycles
- 2024: D+32.9 2020: D+44.2 2016: D+48.0 2012: D+40.0 2008: D+40.4
Not yet ingested
- Civics
- —
Market trends
- HPI YoY
- ▼ -144.13%
- Current HPI
- 449.4494
- Rent YoY
- ▲ 0.14%
- Metro
- Los Angeles-Long Beach-Anaheim, CA
- State GDP YoY
- ▲ 3.21%
- F500 in state
- 116
Industry mix (Fortune 500 HQ in CA)
| Industry | F500 HQs | Revenue |
|---|---|---|
| Technology | 27 | $1,492B |
|
||
| Financial Services | 3 | $174B |
|
||
| Retail | 3 | $44B |
|
||
| Insurance | 3 | $26B |
|
||
| Media / Entertainment | 2 | $115B |
|
||
| Pharmaceuticals / Biotech | 2 | $62B |
|
||
Price history
+0.0% since first listed2 events — show timeline
- 2026-05-29 Listed $139,900 CRMLS
- 2026-05-29 Listed $139,900 AVMLS
Cash-flow waterfall
monthlySold comps — $/sqft
last 12 mo · ≤1 miLoading sold comps…