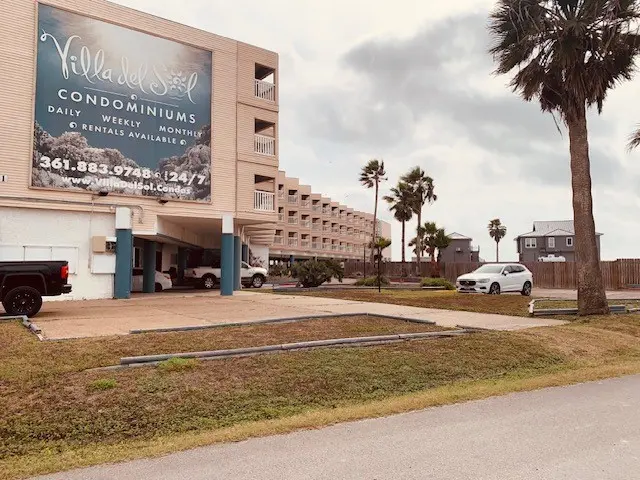
3938 Surfside Blvd #1219 · Corpus Christi, TX
Flood risk No data
- FEMA flood zone
- —
- Chance of flooding over 30 yrs
- —
- Est. flood insurance / yr
- —
Fire risk No data
- Est. fire insurance / yr
- —
Heat risk No data
- Hot days now (above threshold)
- —
- Hot days in 30 yrs
- —
Wind risk No data
- Chance of severe wind over 30 yrs
- —
Air-quality risk No data
- Unhealthy air days now
- —
- Unhealthy air days in 30 yrs
- —
Risk factors via First Street. Map © Google.
Why this score? — see what drove the C grade
The composite is a weighted blend of 9 inputs, each scored 0–100. Each bar is that input's sub-score; the figure is the points it added to the 100-point composite (weight × sub-score).
- Cash flow +17.9/30.0
- ARV discount +12.1/15.0
- 1% rule +10.0/10.0
- DSCR +5.6/10.0
- Livability +3.9/5.0
- Schools +2.8/10.0
- Rent growth +2.5/5.0
- Condition / age +2.5/5.0
- Appreciation +0.1/10.0
$44,900
🖨 Deal sheet (PDF) 📄 Offer letter ✓ Due diligence
Listing remarks MLS
Deal of the year!! Seller wants to sell yesterday. Cash only, no financing available for this complex. Unit is much like a 'hotel' condo. In clean condition, completely furnished, with view of direct ocean from or near balcony. Funiture and furnishings are all in good condition. All kitchen supplies already to use, with 2 burner stove, toaster oven, refrigerator. Queen sized bed in master, and sigle bed in hallway. Owner can lease out/or Air B & B by the day, the week or the month. There are no leasing restrictions. Building renovations are currently in progress on all floors of the building. Elevator is still in use.
Key facts
- $575 HOA
- Garage
- Pool
Neighborhood map
What this means for you Summary
Snapshot
- This is a 1-bed/1.0-bath townhouse listed at $45k.
Deal economics
- At list price, monthly cash flow is $38 ($458/yr) — positive.
- The deal already cash-flows at list — no discount required.
- Meets the 1% rule at list price ($1k rent vs $45k).
- Recommended offer: $44k (1.5% below list) — sets the bar for market timing.
- Cap rate 7.3% vs local median 3.6% in Corpus Christi — top-decile yield for the area; either an underpriced asset or a hidden risk that comps aren't pricing in. Stress-test before assuming the spread holds.
Location & tenants
- Location reads 78/100 on livability (#66 in TX, #2,404 nationally) — a middle-class / working-renter tenant base. Strengths: commute A+, cost of living A+, housing A+; Watch: crime F.
- Corpus Christi ISD (urban): math 31% / reading 35% proficiency, ranked #562 of 826 in TX (top 68%) — families likely to look elsewhere, expect single-tenant / working-renter base with shorter leases; 63% free/reduced lunch — lower-income household profile, screen leases tightly.
- Market conditions: 76 active listings in the ZIP; 1,397 units permitted in Nueces County in 2024 (47 in 5+ unit buildings).
Forward outlook
- Local home prices are declining (-3.0%/yr); year-one equity from $310 of loan paydown is wiped out by about $1k of value loss. Plan a longer hold.
- Nueces County population projected at +36% by 2050 — long-run rental-demand tailwind backs the buy-and-hold thesis.
Negotiation context
- It's been on market 26 days — a 2% lower offer ($44k) is reasonable based on typical stale-listing flexibility.
- 6 sale attempts since 23y ago with the ask held roughly flat each time — persistent listings suggest the price (not the market) is what's stuck; bring a comps-based counter.
Risks & watch-outs
- Watch-outs: HOA is 49% of rent.
Questions for the listing agent
- What does the HOA fee cover, when was the last increase, and are there any pending special assessments or reserve-fund shortfalls?
- Is there a deadline driving the sale (1031 exchange, divorce, estate, relocation)? That informs how much negotiation room exists.
- Crime grade is F in this area — have there been break-ins, vandalism, or insurance claims at this property in the last 3 years? What carrier currently insures it and at what premium?
- What's the average days-on-market for RENTAL listings here right now (not sales)? A rising rental-DOM trend means longer vacancies and softer asking-rent achievability than the comps imply.
- What's the recent tenant-quality profile in this submarket — average credit score on applications, eviction rate, late-payment / NSF rate, and stable-employment percentage? A property-management company in the area should have these aggregated.
- How much new for-sale + rental construction is in the pipeline within 1–3 miles? Heavy new supply typically softens prices + rents 12–24 months out; constrained supply supports both.
Investment metrics
- 1% rule
- 2.60% ✓
- Cap rate
- 7.31%
- Cash-on-cash
- 3.64%
- DSCR
- 1.16
- GRM
- 3.2
CMA / ARV
- ARV (on-the-fly)
- $49,980
- Comps found
- 12
Show comp detail 12 sales within ~0.75 mi
| Address | Dist | Beds/Ba | Sqft | Sold | Price | $/sf | Match |
|---|---|---|---|---|---|---|---|
| 3938 Surfside Blvd #1219 | 0.00mi | 1/1.0 | 420 (0%) | 1mo | $44,900 | $107 | 99 |
| 3938 Surfside Blvd #1316 | 0.01mi | 1/1.0 | 420 (0%) | 1mo | $64,500 | $154 | 99 |
| 3938 Surfside Blvd #1225 | 0.01mi | 1/1.0 | 420 (0%) | 2mo | $50,000 | $119 | 98 |
| 3938 Surfside Blvd #3225 | 0.03mi | 1/1.0 | 420 (0%) | 1mo | $39,900 | $95 | 98 |
| 3938 Surfside Blvd #1207 | 0.02mi | 1/1.0 | 420 (0%) | 2mo | $50,000 | $119 | 97 |
| 3938 Surfside Blvd #1327 | 0.01mi | 1/1.0 | 420 (0%) | 2mo | $50,000 | $119 | 97 |
| 3938 Surfside Blvd #3224 | 0.04mi | 1/1.0 | 420 (0%) | 1mo | $55,000 | $131 | 97 |
| 3938 Surfside Blvd #2327 | 0.04mi | 1/1.0 | 420 (0%) | 1mo | $58,000 | $138 | 97 |
| 3938 Surfside Blvd #3342 | 0.04mi | 1/1.0 | 420 (0%) | 2mo | $62,000 | $148 | 97 |
| 3938 Surfside Blvd #3114 | 0.04mi | 1/1.0 | 420 (0%) | 2mo | $45,000 | $107 | 97 |
| 3938 Surfside Blvd #2332 | 0.04mi | 1/1.0 | 420 (0%) | 2mo | $48,000 | $114 | 96 |
| 3938 Surfside Blvd #2305 | 0.05mi | 1/1.0 | 418 (-0%) | 3mo | $100,000 | $239 | 95 |
Match score weights: distance 35% · size 25% · config 20% · recency 20%. Top-matched comps best support the ARV.
Projected returns pro-forma
-3.0% appreciation · 3.0% rent growth · sell at horizon
- IRR
- -9.7%
- Equity multiple
- 0.64×
- Total profit
- $-4,473
- Equity at exit
- $6,695
- IRR
- 0.8%
- Equity multiple
- 1.06×
- Total profit
- $744
- Equity at exit
- $3,882
Cash invested: $12,572 (down + closing). Projections, not guarantees.
Landlord ↔ Tenant lean methodology
- Overall (STATE)
- 87 Strongly Landlord-Friendly
- State Texas
- 87 Strongly Landlord-Friendly · R+5
- County
- — inherits STATE
- City
- — inherits STATE
ZIP-level market 78402
- Home prices YoY
- -8.8%
- Active inventory
- 76
- Price-to-rent
- 3.2×
Monthly cashflow live
- Estimated rent
- $1,169 medium interval (Pro) →
- Mortgage (P&I)
- −$235
- Tax est. 1.5%
- −$56 /mo · $674/yr
- Insurance
- −$19
- HOA
- −$575
- Vacancy / Maint / Mgmt
- −$245
- Net cashflow
- $38
Break-even live
Sensitivity live
| Price | -10% $69 | -5% $54 | +0% $38 | +5% $23 | +10% $7 |
|---|---|---|---|---|---|
| Rent | -10% $-54 | -5% $-8 | +0% $38 | +5% $84 | +10% $131 |
| Rate | -1.0pp $61 | -0.5pp $50 | base $38 | +0.5pp $27 | +1.0pp $15 |
UW: 25.0% down · 7.5% · 30yr · 1.5% tax · 5.0% vac · 8.0% maint · 8.0% mgmt
Financing live
Cash to close
- Down payment
- $11,225
- Closing costs
- $1,347
- Reserves months
- —
- Total cash needed
- —
Loan-product check · same deal, 3 products live
Conventional
25% down · 7.5% · 30yr
- Down + closing
- —
- Monthly P&I
- —
- Monthly cashflow
- —
- DSCR
- —
- Eligible?
- —
Personal DTI + credit; lowest rate.
DSCR
20% down · 8.5% · 30yr
- Down + closing
- —
- Monthly P&I
- —
- Monthly cashflow
- —
- DSCR
- —
- Eligible?
- —
No personal income docs; deal must DSCR.
Hard money
10% down · 12.0% · 12mo
- Down + closing
- —
- Monthly P&I
- —
- Monthly cashflow
- —
- DSCR
- —
- Eligible?
- —
Short-term bridge; refi at stabilization.
HOA detail
- Monthly dues
- $575 · $6,900/yr
Listing history 14 events
-
2026-05-07status Pending 629-char remark
Show marketing remark (629 chars)
Deal of the year!! Seller wants to sell yesterday. Cash only, no financing available for this complex. Unit is much like a 'hotel' condo. In clean condition, completely furnished, with view of direct ocean from or near balcony. Funiture and furnishings are all in good condition. All kitchen supplies already to use, with 2 burner stove, toaster oven, refrigerator. Queen sized bed in master, and sigle bed in hallway. Owner can lease out/or Air B & B by the day, the week or the month. There are no leasing restrictions. Building renovations are currently in progress on all floors of the building. Elevator is still in use.
-
2026-04-10$44,900 Active 629-char remark
Show marketing remark (629 chars)
Deal of the year!! Seller wants to sell yesterday. Cash only, no financing available for this complex. Unit is much like a 'hotel' condo. In clean condition, completely furnished, with view of direct ocean from or near balcony. Funiture and furnishings are all in good condition. All kitchen supplies already to use, with 2 burner stove, toaster oven, refrigerator. Queen sized bed in master, and sigle bed in hallway. Owner can lease out/or Air B & B by the day, the week or the month. There are no leasing restrictions. Building renovations are currently in progress on all floors of the building. Elevator is still in use.
-
2025-01-16soldstatus
-
2022-11-07soldstatus
-
2022-11-07soldstatus
-
2009-04-21$56,900
-
2007-04-01$64,500
-
2004-08-13soldstatus
-
2004-07-29soldstatus
-
2004-03-10$40,500
-
2003-08-20soldstatus
-
2003-08-04$38,000
-
2003-05-01soldstatus
-
2003-01-29$25,500
ⓘ Source: listings_history table (triggers on properties + properties_extension) + one-shot
backfill from property_details.listing_events for pre-trigger history.
Nearby sold comps map
Loading sold comps map…
Walkable amenities ~0.75 mi
Loading nearby amenities…
Taxation est. · year 1
- Rental income
- $14,028
- − Mortgage interest
- −$2,515
- − Property taxes
- −$674
- − Insurance
- −$224
- − Repairs & maintenance
- −$1,122
- − Management
- −$1,122
- − HOA
- −$6,900
- − Depreciation
- −$1,306
- Taxable income
- $164
- Est. tax owed @ 24.0%
- −$39
- After-tax cash flow
- $419/yr
For passive investors: Depreciation is non-cash, so a rental often shows a tax loss while cash-flowing — sheltering income. Rental losses are passive: they offset passive income freely, and up to $25,000/yr can offset ordinary (W-2) income if you actively participate and your MAGI is under $100k (phasing out to $0 by $150k); unused losses carry forward. On sale, claimed depreciation is recaptured at up to 25%, and gains may owe capital-gains tax (a 1031 exchange can defer both). Figures are a year-1 estimate at your 24.0% rate — not tax advice; consult a CPA.
Schools (NCES district)
- District
- Corpus Christi ISD
- NCES district ID
- 4815270
- Math proficiency
- 31% ▼ -18.00%
- Reading proficiency
- 35% ▼ -7.00%
- Median HH income
- $45,672
- Composite
- 28.27/100
- National rank
- #6793
- State rank
- #562 of 826 in TX
Livability — Corpus Christi
- Score
- 78/100
- State rank
- #66
- US rank
- #2404
Category grades
Schools grade is shown separately in the Schools card above.
Census & demographics
- Census place
- Corpus Christi, TX
- City population
- 296,836
- Population (ZIP)
- 392
Population outlook (Nueces County) Hauer SSP2
- Today (2025)
- 418,037 people
- By 2030
- 447,123 · +7.0%
- By 2040
- 505,911 · +21.0%
- By 2050
- 567,522 · +35.8%
- By 2075
- 729,686 · +74.6%
- By 2100
- 847,087 · +102.6%
Race, ethnicity, and origin ACS 2023
- Neighborhood character
- Diverse neighborhood (Simpson 0.57)
- Race & ethnicity
- White 62% Hispanic / Latino 19% Two or more races 17% Black 9%
- Hispanic origin (detail)
- Mexican 16%
- Common ancestry
- Slovak 2%
- Foreign-born
- 3% · Canada
- Languages at home
- 91% English-only · Spanish 7% German/W. Germanic 2%
Political lean MEDSL · Nueces
- 2024 margin
- R (+11.5) · D 43.8% · R 55.3%
- 2008→2024 swing
- -7.1pp toward R · 2008: -4.4pp · 2024: -11.5pp
- All cycles
- 2024: R+11.5 2020: R+2.9 2016: R+1.5 2012: R+3.2 2008: R+4.4
Not yet ingested
- Civics
- —
Market trends
- HPI YoY
- ▼ -9.74%
- Current HPI
- 101.5421
- Rent YoY
- —
- Metro
- —
- State GDP YoY
- ▲ 3.95%
- F500 in state
- 110
Industry mix (Fortune 500 HQ in TX)
| Industry | F500 HQs | Revenue |
|---|---|---|
| Energy | 16 | $1,198B |
|
||
| Technology | 5 | $198B |
|
||
| Engineering / Construction | 4 | $72B |
|
||
| Energy Services | 3 | $60B |
|
||
| Utilities | 3 | $41B |
|
||
| Healthcare | 2 | $330B |
|
||
Price history
+76.1% since first listed14 events — show timeline
- 2026-05-07 Pending — CBMLS
- 2026-04-10 Listed $44,900 CBMLS
- 2025-01-16 Sold (Public Records) — Public Records
- 2022-11-07 Sold (Public Records) — Public Records
- 2022-11-07 Sold (Public Records) — Public Records
- 2009-04-21 Listed $56,900 CBMLS
- 2007-04-01 Listed $64,500 CBMLS
- 2004-08-13 Sold (Public Records) — Public Records
- 2004-07-29 Sold (MLS) — CBMLS
- 2004-03-10 Listed $40,500 CBMLS
- 2003-08-20 Sold (MLS) — CBMLS
- 2003-08-04 Listed $38,000 CBMLS
- 2003-05-01 Sold (MLS) — CBMLS
- 2003-01-29 Listed $25,500 CBMLS
Property tax history
+10.9%/yrLatest (2025): $2,754 · -3.5% YoY. Source: county tax records.
Cash-flow waterfall
monthlySold comps — $/sqft
last 12 mo · ≤1 miLoading sold comps…