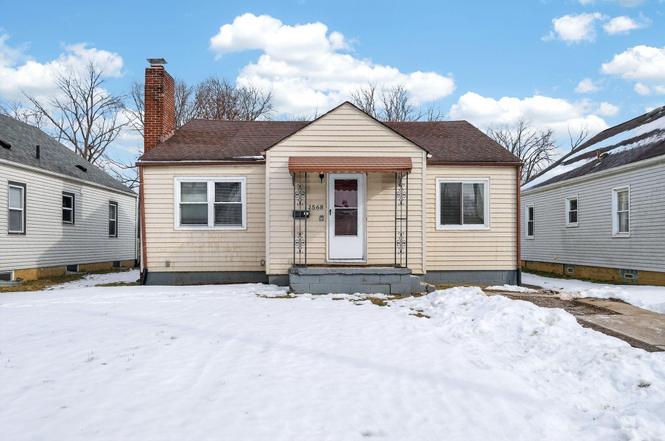
1568 Oakwood Ave · Columbus, OH
Flood risk 1/10 · Minimal
- FEMA flood zone
- X (unshaded)
- Chance of flooding over 30 yrs
- 0.0%
- Est. flood insurance / yr
- $473 – $860
Fire risk 1/10 · Minimal
- Est. fire insurance / yr
- $713 – $1,323
Heat risk 4/10 · Minor
- Hot days now (above 100°F)
- 7 days/yr
- Hot days in 30 yrs
- 18 days/yr
Wind risk 2/10 · Minimal
- Chance of severe wind over 30 yrs
- 1.0%
Air-quality risk 3/10 · Minor
- Unhealthy air days now
- 2 days/yr
- Unhealthy air days in 30 yrs
- 3 days/yr
Risk factors via First Street. Map © Google.
Why this score? — see what drove the D+ grade
The composite is a weighted blend of 9 inputs, each scored 0–100. Each bar is that input's sub-score; the figure is the points it added to the 100-point composite (weight × sub-score).
- ARV discount +15.0/15.0
- Cash flow +14.2/30.0
- DSCR +4.3/10.0
- 1% rule +4.0/10.0
- Livability +4.0/5.0
- Rent growth +3.1/5.0
- Condition / age +2.5/5.0
- Schools +1.7/10.0
- Appreciation +0.0/10.0
$149,900
🖨 Deal sheet (PDF) 📄 Offer letter ✓ Due diligence
Listing remarks
Charming single-story bungalow featuring classic curb appeal with a covered front entry, brick chimney, and low-maintenance siding. The home offers a fenced backyard with a storage shed and ample open space for outdoor enjoyment. Inside, hardwood flooring flows throughout the main living areas, highlighted by a fireplace with built-in shelving and multiple windows that bring in natural light. Arched doorways add architectural character, while the kitchen includes wood cabinetry, laminate countertops, a double-basin sink, and black appliances. The full basement provides generous storage and utility space, offering flexibility for a variety of needs.
Key facts
- Hardwood flooring
- Storage shed
- Covered front entry
Tags
Neighborhood map
What this means for you Summary
Snapshot
- This is a 2-bed/1.0-bath single-family listed at $150k.
Deal economics
- At list price, monthly cash flow is $26 ($313/yr) — positive.
- The deal already cash-flows at list — no discount required.
- To meet the 1% rule (rent ≥ 1% of price), the offer needs to be $134k (10.5% below list).
- Recommended offer: $134k (10.5% below list) — sets the bar for 1% rule.
- Cap rate 6.5% vs local median 3.8% in Columbus — top-decile yield for the area; either an underpriced asset or a hidden risk that comps aren't pricing in. Stress-test before assuming the spread holds.
Location & tenants
- Location reads 81/100 on livability (#97 in OH, #1,491 nationally) — a professional / high-income tenant draw. Strengths: commute A+, cost of living A+, housing A+; Watch: employment C-, crime F.
- Columbus City School District (urban): math 15% / reading 26% proficiency, ranked #626 of 656 in OH (top 95%) — low school quality limits family demand, transient renter base, plan for 1-2y turnover; 72% free/reduced lunch — lower-income household profile, screen leases tightly.
- Zoned schools: Indianola Informal K-8 School (math 43% / reading 58%, grade D+, #896 of 1,584 statewide, top 57%, 684 students, 0% FRL); Arts Impact Middle School (Aims) (math 17% / reading 25%, grade F, #608 of 654 statewide, top 93%, 532 students, 0% FRL); South High School (math 10% / reading 26%, grade F, #687 of 781 statewide, top 88%, 903 students, 0% FRL) — zoned schools average 0% FRL vs 72% district-wide (72 pts lower); this property's tenant base skews higher-income than the district average.
- Market conditions: Rents rising (+2.3%/yr); 198 active listings in the ZIP; 40 comparable units currently listed for rent nearby; rentals at typical pace (median 26d on market — plan ~3-4 weeks tenant-placement turnaround); 40% of comp listings sitting > 30 days — soft ceiling on asking rent; 8,139 units permitted in Franklin County in 2024 (5,940 in 5+ unit buildings).
Forward outlook
- Local home prices are declining (-3.0%/yr); year-one equity from $1k of loan paydown is wiped out by about $4k of value loss. Plan a longer hold.
- Franklin County population projected at +34% by 2050 — long-run rental-demand tailwind backs the buy-and-hold thesis.
Negotiation context
- It's been on market 63 days — a 6% lower offer ($141k) is reasonable based on typical stale-listing flexibility.
- Current owner paid $66k; list at $150k implies a 129% gain — meaningful room to come down on a strong offer.
Risks & watch-outs
- Watch-outs: built in 1930 — expect roof / HVAC / electrical / plumbing capex.
Questions for the listing agent
- It's been on market 63 days. Have you received any prior offers? Is the seller open to a 10% concession, seller financing, or rate buy-down credit?
- Built in 1930 — when were the roof, HVAC, electrical panel, plumbing, and water heater last replaced?
- Why hasn't it sold? Are there any deal-killer items the seller is aware of (foundation, flood, title, zoning, code violations)?
- Is there a deadline driving the sale (1031 exchange, divorce, estate, relocation)? That informs how much negotiation room exists.
- Crime grade is F in this area — have there been break-ins, vandalism, or insurance claims at this property in the last 3 years? What carrier currently insures it and at what premium?
- The area grade is low — what's the realistic commute time and amenity access for the typical tenant pool here? Any planned neighborhood developments (good or bad) we should know about?
- What's the average days-on-market for RENTAL listings here right now (not sales)? A rising rental-DOM trend means longer vacancies and softer asking-rent achievability than the comps imply.
- What's the recent tenant-quality profile in this submarket — average credit score on applications, eviction rate, late-payment / NSF rate, and stable-employment percentage? A property-management company in the area should have these aggregated.
- How much new for-sale + rental construction is in the pipeline within 1–3 miles? Heavy new supply typically softens prices + rents 12–24 months out; constrained supply supports both.
Investment metrics
- 1% rule
- 0.90% ✗
- Cap rate
- 6.50%
- Cash-on-cash
- 0.75%
- DSCR
- 1.03
- GRM
- 9.3
CMA / ARV
- ARV (on-the-fly)
- $212,256
- Comps found
- 12
Show comp detail 12 sales within ~0.75 mi
| Address | Dist | Beds/Ba | Sqft | Sold | Price | $/sf | Match |
|---|---|---|---|---|---|---|---|
| 657 Southwood Ave | 0.45mi | 2/1.0 | 1,036 (-3%) | 0mo | $205,000 | $198 | 73 |
| 653 E Gates St | 0.51mi | 2/1.0 | 1,056 (-2%) | 2mo | $175,000 | $166 | 73 |
| 1370 Studer Ave | 0.40mi | 2/2.0 | 1,149 (+7%) | 2mo | $255,000 | $222 | 63 |
| 1398 Lockbourne Rd | 0.43mi | 3/2.0 (+1) | 1,123 (+5%) | 1mo | $205,000 | $183 | 62 |
| 532 E Moler St | 0.64mi | 2/1.5 | 1,024 (-4%) | 1mo | $259,500 | $253 | 60 |
| 655 E Mithoff St | 0.56mi | 2/1.0 | 1,176 (+10%) | 2mo | $265,400 | $226 | 56 |
| 1364 Roberts Pl | 0.67mi | 3/2.0 (+1) | 1,046 (-2%) | 2mo | $220,000 | $210 | 54 |
| 1329 Studer Ave | 0.45mi | 3/1.5 (+1) | 1,191 (+11%) | 1mo | $212,000 | $178 | 53 |
| 670 Frebis Ave | 0.46mi | 2/2.0 | 928 (-13%) | 1mo | $180,000 | $194 | 51 |
| 573 E Mithoff St | 0.66mi | 3/1.5 (+1) | 1,164 (+9%) | 2mo | $215,000 | $185 | 46 |
| 554 Hanford St | 0.62mi | 3/2.5 (+1) | 1,156 (+8%) | 2mo | $320,000 | $277 | 45 |
| 1172 E Woodrow Ave | 0.60mi | 3/2.0 (+1) | 1,200 (+12%) | 2mo | $155,000 | $129 | 41 |
Match score weights: distance 35% · size 25% · config 20% · recency 20%. Top-matched comps best support the ARV.
Projected returns pro-forma
-3.0% appreciation · 2.32% rent growth · sell at horizon
- IRR
- -15.9%
- Equity multiple
- 0.44×
- Total profit
- $-23,523
- Equity at exit
- $22,351
- IRR
- -8.7%
- Equity multiple
- 0.48×
- Total profit
- $-21,959
- Equity at exit
- $12,961
Cash invested: $41,972 (down + closing). Projections, not guarantees.
Landlord ↔ Tenant lean methodology
- Overall (STATE)
- 73 Landlord-Friendly
- State Ohio
- 73 Landlord-Friendly · R+6
- County
- — inherits STATE
- City
- — inherits STATE
ZIP-level market 43207
- Rents YoY
- 2.3%
- Active inventory
- 198
- Price-to-rent
- 9.3×
Monthly cashflow live
- Estimated rent
- $1,342 high interval (Pro) →
- Mortgage (P&I)
- −$786
- Tax from tax record
- −$186 /mo · $2,228/yr
- Insurance
- −$62
- HOA
- −$0
- Vacancy / Maint / Mgmt
- −$282
- Net cashflow
- $26
Break-even live
Sensitivity live
| Price | -10% $111 | -5% $68 | +0% $26 | +5% $-16 | +10% $-59 |
|---|---|---|---|---|---|
| Rent | -10% $-80 | -5% $-27 | +0% $26 | +5% $79 | +10% $132 |
| Rate | -1.0pp $102 | -0.5pp $64 | base $26 | +0.5pp $-13 | +1.0pp $-52 |
UW: 25.0% down · 7.5% · 30yr · 1.5% tax · 5.0% vac · 8.0% maint · 8.0% mgmt
Financing live
Cash to close
- Down payment
- $37,475
- Closing costs
- $4,497
- Reserves months
- —
- Total cash needed
- —
Loan-product check · same deal, 3 products live
Conventional
25% down · 7.5% · 30yr
- Down + closing
- —
- Monthly P&I
- —
- Monthly cashflow
- —
- DSCR
- —
- Eligible?
- —
Personal DTI + credit; lowest rate.
DSCR
20% down · 8.5% · 30yr
- Down + closing
- —
- Monthly P&I
- —
- Monthly cashflow
- —
- DSCR
- —
- Eligible?
- —
No personal income docs; deal must DSCR.
Hard money
10% down · 12.0% · 12mo
- Down + closing
- —
- Monthly P&I
- —
- Monthly cashflow
- —
- DSCR
- —
- Eligible?
- —
Short-term bridge; refi at stabilization.
Rent comps 40 comps
| Address | Beds | Baths | Sqft | Rent | $/sqft | DOM | Units | Dist |
|---|---|---|---|---|---|---|---|---|
| 1460 Oakwood Ave Columbus, OH | 2.0 | 1.0 | 901 | $900 | $1.00 | 16d | 1 | 0.15mi |
| 1460 Oakwood Ave Columbus, OH | 2.0 | 1.0 | 901 | $900 | $1.00 | 45d | 1 | 0.15mi |
| 1416 S Ohio Ave Columbus, OH | 3.0 | 1.5 | 1056 | $1,595 | $1.51 | 23d | 1 | 0.23mi |
| 726 Frebis Ave Columbus, OH | 2.0 | 1.0 | 850 | $1,175 | $1.38 | 5d | 1 | 0.35mi |
| 1401 Lockbourne Rd Columbus, OH | 2.0 | 1.5 | 850 | $1,225 | $1.44 | 5d | 1 | 0.40mi |
| 662 Southwood Ave Columbus, OH | 3.0 | 2.0 | 1183 | $1,950 | $1.65 | 22d | 1 | 0.43mi |
| 1836 Lockbourne Rd Columbus, OH | 2.0–3.0 | 1.0–1.5 | 997 | $1,025 | $1.03 | 5d | 4 | 0.44mi |
| 735-737 E Mithoff St Columbus, OH | 2.0 | 1.0 | 800 | $1,395 | $1.74 | 25d | 1 | 0.46mi |
| 1239-1241 S Champion Ave Columbus, OH | 3.0 | 1.0 | 1134 | $1,275 | $1.12 | 18d | 1 | 0.46mi |
| 1288 Linwood Ave Columbus, OH | 3.0 | 1.0 | 1344 | $1,900 | $1.41 | 45d | 1 | 0.47mi |
| 1227 S Champion Ave Unit 1227 Columbus, OH | 3.0 | 1.0 | 1110 | $1,195 | $1.08 | 5d | 1 | 0.48mi |
| 1225 S Champion Ave Unit 1225 Columbus, OH | 3.0 | 1.0 | 1110 | $1,095 | $0.99 | 5d | 1 | 0.49mi |
| 1755 S 20th St Columbus, OH | 2.0–5.0 | 1.0–2.0 | 1153 | $950 | $0.82 | 0d | 13 | 0.50mi |
| 672 E Mithoff St Columbus, OH | 2.0 | 1.0 | 768 | $1,200 | $1.56 | 23d | 1 | 0.55mi |
| 1093 Lawrence Dr Columbus, OH | 3.0 | 1.0 | 1000 | $1,540 | $1.54 | 0d | 1 | 0.55mi |
| 765 E Deshler Ave Columbus, OH | 3.0 | 1.0 | 1332 | $1,350 | $1.01 | 0d | 1 | 0.56mi |
| 546 E Jenkins Ave Unit 1 Columbus, OH | 2.0 | 1.0 | 975 | $1,295 | $1.33 | 25d | 1 | 0.59mi |
| 1138 Oakwood Ave Unit 1138 Columbus, OH | 2.0 | 1.0 | 860 | $950 | $1.10 | 0d | 1 | 0.62mi |
| 554 E Gates St Columbus, OH | 2.0 | 1.0 | 902 | $1,295 | $1.44 | 12d | 1 | 0.64mi |
| 1118 S Ohio Ave Columbus, OH | 3.0 | 1.5 | 1232 | $1,750 | $1.42 | 45d | 1 | 0.64mi |
| 573 E Mithoff St Columbus, OH | 3.0 | 1.5 | 1300 | $2,100 | $1.62 | 45d | 1 | 0.65mi |
| 1833 Berkeley Rd Columbus, OH | 3.0 | 1.5 | 1092 | $1,800 | $1.65 | 45d | 1 | 0.66mi |
| 529 E Morrill Ave Columbus, OH | 3.0 | 1.0 | 1318 | $1,600 | $1.21 | 5d | 1 | 0.67mi |
| 490-492 E Jenkins Ave Unit 490 Columbus, OH | 3.0 | 1.0 | 1050 | $1,325 | $1.26 | 45d | 1 | 0.67mi |
| 1094 Oakwood Ave Columbus, OH | 1.0 | 1.0 | 850 | $950 | $1.12 | 45d | 1 | 0.68mi |
| 1106 Oakwood Ave Columbus, OH | 1.0 | 1.0 | 850 | $950 | $1.12 | 45d | 1 | 0.68mi |
| 1092 Oakwood Ave Columbus, OH | 1.0 | 1.0 | 850 | $950 | $1.12 | 45d | 1 | 0.69mi |
| 476 Southwood Ave Columbus, OH | 2.0 | 1.0 | 1219 | $1,400 | $1.15 | 45d | 1 | 0.69mi |
| 761 Siebert St Columbus, OH | 2.0 | 2.0 | 1050 | $2,350 | $2.24 | 5d | 1 | 0.69mi |
| 1165-1167 E Whittier St Columbus, OH | 3.0 | 1.5 | 1300 | $1,950 | $1.50 | 45d | 1 | 0.73mi |
| 1167 E Whittier St Columbus, OH | 3.0 | 1.5 | 1300 | $1,950 | $1.50 | 45d | 1 | 0.74mi |
| 1175 Ann St Columbus, OH | 2.0 | 1.0 | 904 | $1,495 | $1.65 | 45d | 1 | 0.75mi |
| 880 E Whittier St Columbus, OH | 2.0 | 1.5 | 1064 | $1,100 | $1.03 | 45d | 1 | 0.76mi |
| 1056 Wilson Ave Unit B Columbus, OH | 2.0 | 1.0 | 1100 | $1,195 | $1.09 | 19d | 1 | 0.77mi |
| 1056 Wilson Ave Unit A Columbus, OH | 2.0 | 1.0 | 1100 | $1,225 | $1.11 | 45d | 1 | 0.77mi |
| 1210 E Whittier St Columbus, OH | 2.0 | 1.0 | 973 | $1,950 | $2.00 | 45d | 1 | 0.78mi |
| 850 E Whittier St Columbus, OH | 3.0 | 2.0 | 1200 | $1,949 | $1.62 | 25d | 1 | 0.78mi |
| 1154 Miller Ave Columbus, OH | 3.0 | 1.0 | 1012 | $1,350 | $1.33 | 16d | 1 | 0.78mi |
| 755 E Whittier St Columbus, OH | 1.0–2.0 | 1.0 | 776 | $1,335 | $1.72 | 25d | 1 | 0.79mi |
| 506 Thurman Ave Columbus, OH | 3.0 | 1.0 | 1500 | $1,600 | $1.07 | 4d | 1 | 0.79mi |
Listing history 8 events
-
2026-04-27status Pending
-
2026-04-16price $149,900
-
2026-04-13price $154,900
-
2026-03-19price $164,900
-
2026-02-23$169,900 Active
-
2019-11-05soldstatus $65,500
-
1993-05-26soldstatus $49,900
-
1992-12-22soldstatus $30,000
ⓘ Source: listings_history table (triggers on properties + properties_extension) + one-shot
backfill from property_details.listing_events for pre-trigger history.
Tax reassessment forecast OH · Partial reset (capped growth)
- Current annual tax
- $2,228 · $186/mo
- Projected year-2 tax
- $2,283 · $190/mo
- Expected delta
- +$55/yr (+$5/mo · 2.5%)
ⓘ Screening estimate from a state-policy table — verify with the county assessor before closing.
Climate risk First Street
- Flood 1/10 Low FEMA zone X (unshaded) · 0% chance over 30 yrs
- Wildfire 1/10 Low
- Heat 4/10 Moderate 7 d/yr ≥100°F today · 18 d/yr by 30 yrs out
- Wind 2/10 Low 100% chance of damaging wind over 30 yrs
- Air quality 3/10 Moderate 2 unhealthy d/yr today · 3 by 30 yrs out
Nearby sold comps map
Loading sold comps map…
Walkable amenities ~0.75 mi
Loading nearby amenities…
Taxation est. · year 1
- Rental income
- $16,106
- − Mortgage interest
- −$8,397
- − Property taxes
- −$2,228
- − Insurance
- −$750
- − Repairs & maintenance
- −$1,288
- − Management
- −$1,288
- − Depreciation
- −$4,361
- Taxable loss
- −$2,206
- Est. tax savings @ 24.0%
- +$529
- After-tax cash flow
- $842/yr
For passive investors: Depreciation is non-cash, so a rental often shows a tax loss while cash-flowing — sheltering income. Rental losses are passive: they offset passive income freely, and up to $25,000/yr can offset ordinary (W-2) income if you actively participate and your MAGI is under $100k (phasing out to $0 by $150k); unused losses carry forward. On sale, claimed depreciation is recaptured at up to 25%, and gains may owe capital-gains tax (a 1031 exchange can defer both). Figures are a year-1 estimate at your 24.0% rate — not tax advice; consult a CPA.
Schools (NCES district)
- District
- Columbus City School District
- NCES district ID
- 3904380
- Math proficiency
- 15% ▼ -17.00%
- Reading proficiency
- 26% ▼ -12.00%
- Median HH income
- $38,483
- Composite
- 17.19/100
- National rank
- #9105
- State rank
- #626 of 656 in OH
Livability — Columbus
- Score
- 81/100
- State rank
- #97
- US rank
- #1491
Category grades
Schools grade is shown separately in the Schools card above.
Census & demographics
- Census place
- Columbus, OH
- County
- Franklin County · 1,351,780 people
- City population
- 612,189
- Metro
- Columbus, OH
- Population (ZIP)
- 47,272
- Household income
- $63,310
- Rent vs Own
- Severe rent burden
- 1679.0
Population outlook (Franklin County) Hauer SSP2
- Today (2025)
- 1,456,139 people
- By 2030
- 1,556,890 · +6.9%
- By 2040
- 1,757,349 · +20.7%
- By 2050
- 1,950,539 · +34.0%
- By 2075
- 2,376,171 · +63.2%
- By 2100
- 2,636,796 · +81.1%
Race, ethnicity, and origin ACS 2023
- Neighborhood character
- Diverse neighborhood (Simpson 0.57)
- Race & ethnicity
- White 59% Black 28% Two or more races 7% Hispanic / Latino 5% Asian 1%
- Hispanic origin (detail)
- Mexican 3%
- Common ancestry
- Italian 2% Romanian 2% Slovak 1%
- Foreign-born
- 4% · Canada
- Languages at home
- 95% English-only · Spanish 3% Other Indo-European 1%
Political lean MEDSL · Franklin
- 2024 margin
- Strong D (+28.4) · D 63.7% · R 35.3% · Other 1.0%
- 2008→2024 swing
- +7.7pp toward D · 2008: 20.7pp · 2024: 28.4pp
- All cycles
- 2024: D+28.4 2020: D+31.4 2016: D+25.9 2012: D+21.7 2008: D+20.7
Not yet ingested
- Civics
- —
Market trends
- HPI YoY
- ▼ -244.33%
- Current HPI
- 268.3028
- Rent YoY
- ▲ 2.32%
- Metro
- Columbus, OH
- State GDP YoY
- ▲ 1.98%
- F500 in state
- 48
Industry mix (Fortune 500 HQ in OH)
| Industry | F500 HQs | Revenue |
|---|---|---|
| Insurance | 3 | $145B |
|
||
| Industrial Machinery | 3 | $49B |
|
||
| Financial Services | 3 | $24B |
|
||
| Consumer Goods | 2 | $93B |
|
||
| Aerospace / Defense | 2 | $47B |
|
||
| Utilities | 2 | $33B |
|
||
Price history
+399.7% since first listed8 events — show timeline
- 2026-04-27 Pending — CBRMLS
- 2026-04-16 Price Changed $149,900 CBRMLS
- 2026-04-13 Price Changed $154,900 CBRMLS
- 2026-03-19 Price Changed $164,900 CBRMLS
- 2026-02-23 Listed $169,900 CBRMLS
- 2019-11-05 Sold (Public Records) $65,500 Public Records
- 1993-05-26 Sold (Public Records) $49,900 Public Records
- 1992-12-22 Sold (Public Records) $30,000 Public Records
Property tax history
+5.1%/yrLatest (2024): $2,228 · +1.3% YoY. Source: county tax records.
Cash-flow waterfall
monthlySold comps — $/sqft
last 12 mo · ≤1 miLoading sold comps…