 🏷️ Likely Rental
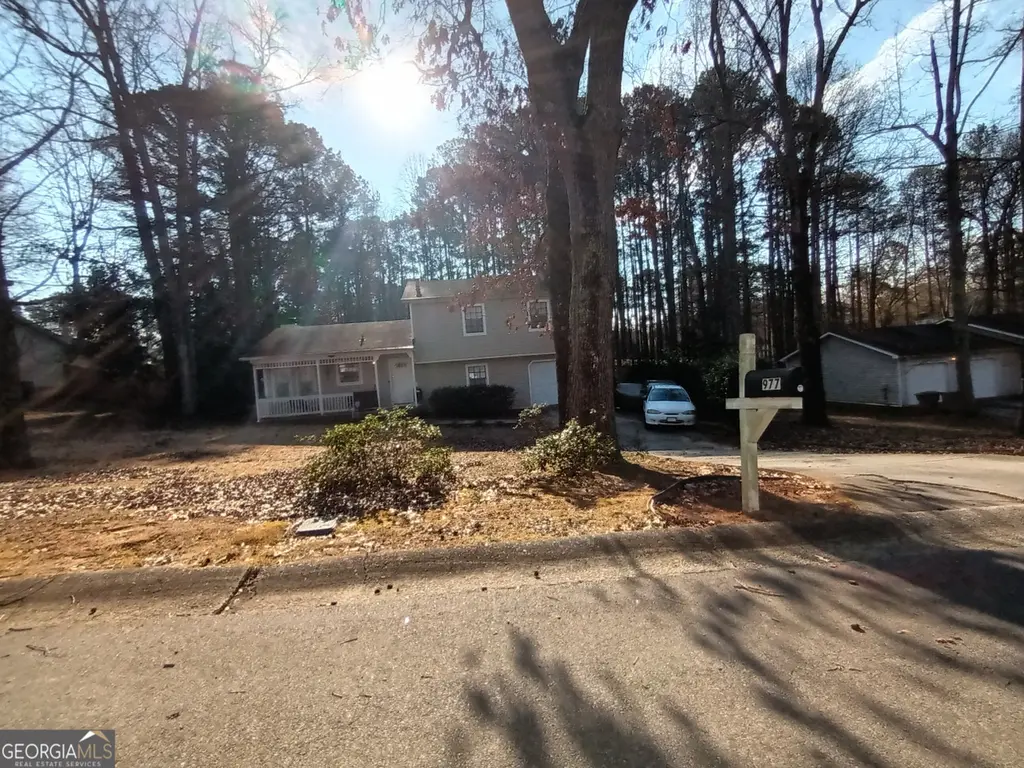
977 Leeward Ln · Jonesboro, GA
Flood risk 1/10 · Minimal
- FEMA flood zone
- X (unshaded)
- Chance of flooding over 30 yrs
- 0.0%
- Est. flood insurance / yr
- $507 – $1,088
Fire risk 4/10 · Minor
- Est. fire insurance / yr
- $963 – $1,789
Heat risk 6/10 · Moderate
- Hot days now (above 105°F)
- 7 days/yr
- Hot days in 30 yrs
- 18 days/yr
Wind risk 6/10 · Moderate
- Chance of severe wind over 30 yrs
- 27.0%
Air-quality risk 4/10 · Minor
- Unhealthy air days now
- 4 days/yr
- Unhealthy air days in 30 yrs
- 6 days/yr
Risk factors via First Street. Map © Google.
Why this score? — see what drove the C grade
The composite is a weighted blend of 9 inputs, each scored 0–100. Each bar is that input's sub-score; the figure is the points it added to the 100-point composite (weight × sub-score).
- Cash flow +21.5/30.0
- ARV discount +15.0/15.0
- DSCR +6.9/10.0
- 1% rule +5.5/10.0
- Livability +3.6/5.0
- Rent growth +3.0/5.0
- Condition / age +2.5/5.0
- Schools +1.3/10.0
- Appreciation +0.0/10.0
$195,000
🖨 Deal sheet 📄 Offer letter ✓ Due diligence
Listing remarks MLS
Great rental property with tenant in place for instant cash flow! 3 bedrooms and 2 baths with partial basement with bonus room. DO NOT DISTURB TENANT!
Key facts
- 0.52 acre lot
- Garage
- Built 1982
Neighborhood map
What this means for you Summary
Snapshot
- This is a 3-bed/2.0-bath single-family listed at $195k.
Deal economics
- At list price, monthly cash flow is $293 ($4k/yr) — positive.
- The deal already cash-flows at list — no discount required.
- Meets the 1% rule at list price ($2k rent vs $195k).
- Recommended offer: $172k (12.0% below list) — sets the bar for market timing.
- Cap rate 8.1% vs local median 5.0% in Jonesboro — top-decile yield for the area; either an underpriced asset or a hidden risk that comps aren't pricing in. Stress-test before assuming the spread holds.
Location & tenants
- Location reads 72/100 on livability (#63 in GA) — a middle-class / working-renter tenant base. Strengths: cost of living A+, housing A-; Watch: crime C-, employment D, schools F.
- Clayton County (suburban): math 11% / reading 20% proficiency, ranked #155 of 174 in GA (top 89%) — low school quality limits family demand, transient renter base, plan for 1-2y turnover; 78% free/reduced lunch — lower-income household profile, screen leases tightly.
- Market conditions: Rents rising (+2.1%/yr); 251 active listings in the ZIP; 9 comparable units currently listed for rent nearby; rentals at typical pace (median 21d on market — plan ~3-4 weeks tenant-placement turnaround); 865 units permitted in Clayton County in 2024 (448 in 5+ unit buildings).
- This rent runs 40% of the median local income ($62k/yr) — at the standard rent-burdened threshold; future hikes will face affordability resistance.
Forward outlook
- Local home prices are declining (-3.0%/yr); year-one equity from $1k of loan paydown is wiped out by about $6k of value loss. Plan a longer hold.
- Clayton County population projected at +29% by 2050 — long-run rental-demand tailwind backs the buy-and-hold thesis.
Negotiation context
- It's been on market 135 days — a 12% lower offer ($172k) is reasonable based on typical stale-listing flexibility.
- Current owner paid $120k; list at $195k implies a 62% gain — meaningful room to come down on a strong offer.
Risks & watch-outs
- Climate carrying-cost: major wind risk, 27% chance of damaging wind over 30y; extreme-heat days projected 7→18/yr by 2055 (HVAC capex compounding) — expect insurance premiums to compound above CPI over the hold.
Questions for the listing agent
- It's been on market 135 days. Have you received any prior offers? Is the seller open to a 12% concession, seller financing, or rate buy-down credit?
- Why hasn't it sold? Are there any deal-killer items the seller is aware of (foundation, flood, title, zoning, code violations)?
- Is there a deadline driving the sale (1031 exchange, divorce, estate, relocation)? That informs how much negotiation room exists.
- Schools are F-rated, which usually means shorter tenancies and higher turnover. Who's the typical renter profile here, and what's been the actual vacancy rate?
- What's the average days-on-market for RENTAL listings here right now (not sales)? A rising rental-DOM trend means longer vacancies and softer asking-rent achievability than the comps imply.
- What's the recent tenant-quality profile in this submarket — average credit score on applications, eviction rate, late-payment / NSF rate, and stable-employment percentage? A property-management company in the area should have these aggregated.
- How much new for-sale + rental construction is in the pipeline within 1–3 miles? Heavy new supply typically softens prices + rents 12–24 months out; constrained supply supports both.
Investment metrics
- 1% rule
- 1.05% ✓
- Cap rate
- 8.10%
- Cash-on-cash
- 6.45%
- DSCR
- 1.29
- GRM
- 7.9
CMA / ARV
- ARV (median comp)
- $284,578
- List price
- $195,000
- Delta
- -31.48%
- Verdict
- UNDERPRICED
- Comps
- 20 within 1.0 mi
Show comp detail 12 sales within ~0.75 mi
| Address | Dist | Beds/Ba | Sqft | Sold | Price | $/sf | Match |
|---|---|---|---|---|---|---|---|
| 9381 Windward Ct | 0.14mi | 3/2.0 | 1,655 (-4%) | 5mo | $245,000 | $148 | 83 |
| 9463 Rollinghills Dr | 0.21mi | 3/2.5 | 1,780 (+4%) | 6mo | $195,000 | $110 | 78 |
| 9573 Briar Creek Ct | 0.53mi | 3/2.0 | 1,736 (+1%) | 0mo | $255,000 | $147 | 74 |
| 1255 Meadowbrook Dr | 0.54mi | 3/2.5 | 1,677 (-2%) | 6mo | $314,990 | $188 | 64 |
| 9464 Briarwood Ln | 0.51mi | 3/2.5 | 1,677 (-2%) | 8mo | $316,990 | $189 | 64 |
| 9479 Autumn Ct | 0.29mi | 3/2.5 | 1,494 (-13%) | 1mo | $239,000 | $160 | 62 |
| 9461 Briairwood Ln | 0.51mi | 4/2.5 (+1) | 1,677 (-2%) | 7mo | $323,990 | $193 | 60 |
| 1259 Riverstone Rd | 0.55mi | 4/2.5 (+1) | 1,677 (-2%) | 9mo | $318,990 | $190 | 56 |
| 750 Four Winds Ln | 0.48mi | 4/3.0 (+1) | 1,855 (+8%) | 1mo | $209,000 | $113 | 55 |
| 1259 Meadowbrook Dr | 0.55mi | 3/2.5 | 1,864 (+8%) | 4mo | $359,990 | $193 | 55 |
| 770 Four Winds Ln | 0.42mi | 4/3.0 (+1) | 1,928 (+12%) | 6mo | $236,900 | $123 | 46 |
| 1270 Meadowbrook Dr | 0.57mi | 4/3.5 (+1) | 1,886 (+10%) | 6mo | $360,690 | $191 | 42 |
Match score weights: distance 35% · size 25% · config 20% · recency 20%. Top-matched comps best support the ARV.
Projected returns pro-forma
-3.0% appreciation · 2.06% rent growth · sell at horizon
- IRR
- -7.4%
- Equity multiple
- 0.73×
- Total profit
- $-14,821
- Equity at exit
- $29,075
- IRR
- 0.9%
- Equity multiple
- 1.06×
- Total profit
- $3,485
- Equity at exit
- $16,860
Cash invested: $54,600 (down + closing). Projections, not guarantees.
Landlord ↔ Tenant lean methodology
- Overall (STATE)
- 90 Strongly Landlord-Friendly
- State Georgia
- 90 Strongly Landlord-Friendly · R+3
- County
- — inherits STATE
- City
- — inherits STATE
ZIP-level market 30238
- Home prices YoY
- -33.3%
- Rents YoY
- 2.1%
- Active inventory
- 251
- Price-to-rent
- 7.9×
Monthly cashflow live
- Estimated rent
- $2,051 high interval (Pro) →
- Mortgage (P&I)
- −$1,023
- Tax from tax record
- −$223 /mo · $2,681/yr
- Insurance
- −$81
- HOA
- −$0
- Vacancy / Maint / Mgmt
- −$431
- Net cashflow
- $293
Break-even live
UW: 25.0% down · 7.5% · 30yr · 1.5% tax · 5.0% vac · 8.0% maint · 8.0% mgmt
Financing live
Cash to close
- Down payment
- $48,750
- Closing costs
- $5,850
- Reserves months
- —
- Total cash needed
- —
Loan-product check · same deal, 3 products live
Conventional
25% down · 7.5% · 30yr
- Down + closing
- —
- Monthly P&I
- —
- Monthly cashflow
- —
- DSCR
- —
- Eligible?
- —
Personal DTI + credit; lowest rate.
DSCR
20% down · 8.5% · 30yr
- Down + closing
- —
- Monthly P&I
- —
- Monthly cashflow
- —
- DSCR
- —
- Eligible?
- —
No personal income docs; deal must DSCR.
Hard money
10% down · 12.0% · 12mo
- Down + closing
- —
- Monthly P&I
- —
- Monthly cashflow
- —
- DSCR
- —
- Eligible?
- —
Short-term bridge; refi at stabilization.
Rent comps 9 comps
| Address | Beds | Baths | Sqft | Rent | $/sqft | DOM | Units | Dist |
|---|---|---|---|---|---|---|---|---|
| 967 Wynnbrook Ln Jonesboro, GA | 3.0 | 2.0 | 1619 | $1,985 | $1.23 | 5d | 1 | 0.34mi |
| 9570 Briar Creek Ln Jonesboro, GA | 3.0 | 2.0 | 1820 | $1,795 | $0.99 | 24d | 1 | 0.64mi |
| 1320 Silverstone Trl Jonesboro, GA | 3.0 | 2.0 | 1954 | $2,045 | $1.05 | 16d | 1 | 0.81mi |
| 782 Dunaire Way Jonesboro, GA | 3.0 | 1.5 | 1600 | $1,385 | $0.87 | 43d | 1 | 1.02mi |
| 312 Stillwood Ct Jonesboro, GA | 4.0 | 3.0 | 1598 | $2,800 | $1.75 | 43d | 1 | 1.28mi |
| 10348 Commons Xing Jonesboro, GA | 3.0 | 2.0 | 1372 | $2,500 | $1.82 | 16d | 1 | 1.35mi |
| 9177 Chickasaw Ct Jonesboro, GA | 3.0 | 2.5 | 2131 | $1,930 | $0.91 | 20d | 1 | 1.36mi |
| 1139 Commons Ct Jonesboro, GA | 3.0 | 2.0 | 1421 | $1,795 | $1.26 | 20d | 1 | 1.39mi |
| 10311 Commons Xing Jonesboro, GA | 3.0 | 2.0 | 2051 | $2,020 | $0.98 | 43d | 1 | 1.44mi |
Listing history 16 events
-
2026-06-17days on market $195,000 Active 135 DOM
-
2026-06-16days on market $195,000 Active 134 DOM
-
2026-06-15days on market $195,000 Active 133 DOM
-
2026-06-13days on market $195,000 Active 131 DOM
-
2026-06-09days on market $195,000 Active 127 DOM
-
2026-06-08days on market $195,000 Active 126 DOM
-
2026-06-07days on market $195,000 Active 125 DOM
-
2026-06-04days on market $195,000 Active 122 DOM
-
2026-06-03days on market $195,000 Active 121 DOM
-
2026-06-02days on market $195,000 Active 120 DOM
-
2026-06-01days on market $195,000 Active 119 DOM
-
2026-05-31days on market $195,000 Active 118 DOM
-
2026-01-30$195,000 New 150-char remark
Show marketing remark (150 chars)
Great rental property with tenant in place for instant cash flow! 3 bedrooms and 2 baths with partial basement with bonus room. DO NOT DISTURB TENANT!
-
2017-08-07soldstatus $120,000
-
1985-10-16soldstatus $54,950
-
1982-11-01soldstatus $55,000
ⓘ Source: listings_history table (triggers on properties + properties_extension) + one-shot
backfill from property_details.listing_events for pre-trigger history.
Tax reassessment forecast GA · Resets to sale price
- Current annual tax
- $2,681 · $223/mo
- Projected year-2 tax
- $2,681 · $223/mo
- Expected delta
- $0/yr ($0/mo · 0.0%)
ⓘ Screening estimate from a state-policy table — verify with the county assessor before closing.
Climate risk First Street
- Flood 1/10 Low FEMA zone X (unshaded) · 0% chance over 30 yrs
- Wildfire 4/10 Moderate
- Heat 6/10 Major 7 d/yr ≥105°F today · 18 d/yr by 30 yrs out
- Wind 6/10 Major 27% chance of damaging wind over 30 yrs
- Air quality 4/10 Moderate 4 unhealthy d/yr today · 6 by 30 yrs out
Nearby sold comps map
Loading sold comps map…
Walkable amenities ~0.75 mi
Loading nearby amenities…
Taxation est. · year 1
- Rental income
- $24,616
- − Mortgage interest
- −$10,923
- − Property taxes
- −$2,681
- − Insurance
- −$975
- − Repairs & maintenance
- −$1,969
- − Management
- −$1,969
- − Depreciation
- −$5,673
- Taxable income
- $426
- Est. tax owed @ 24.0%
- −$102
- After-tax cash flow
- $3,418/yr
For passive investors: Depreciation is non-cash, so a rental often shows a tax loss while cash-flowing — sheltering income. Rental losses are passive: they offset passive income freely, and up to $25,000/yr can offset ordinary (W-2) income if you actively participate and your MAGI is under $100k (phasing out to $0 by $150k); unused losses carry forward. On sale, claimed depreciation is recaptured at up to 25%, and gains may owe capital-gains tax (a 1031 exchange can defer both). Figures are a year-1 estimate at your 24.0% rate — not tax advice; consult a CPA.
Schools (NCES district)
- District
- Clayton County
- NCES district ID
- 1301230
- Math proficiency
- 11% ▼ -13.00%
- Reading proficiency
- 20% ▼ -9.00%
- Median HH income
- $42,266
- Composite
- 13.41/100
- National rank
- #9527
- State rank
- #155 of 174 in GA
Livability — Jonesboro
- Score
- 72/100
- State rank
- #63
- US rank
- #6030
Category grades
Schools grade is shown separately in the Schools card above.
Census & demographics
- County
- Clayton County · 230,153 people
- City population
- 93,280
- Metro
- Atlanta-Sandy Springs-Alpharetta, GA
- Population (ZIP)
- 43,191
- Household income
- $62,185
- Rent vs Own
- Severe rent burden
- 1992.0
Population outlook (Clayton County) Hauer SSP2
- Today (2025)
- 310,777 people
- By 2030
- 329,762 · +6.1%
- By 2040
- 368,052 · +18.4%
- By 2050
- 401,196 · +29.1%
- By 2075
- 472,488 · +52.0%
- By 2100
- 500,446 · +61.0%
Race, ethnicity, and origin ACS 2023
- Neighborhood character
- Predominantly Black (71%)
- Race & ethnicity
- Black 71% Hispanic / Latino 17% White 7% Two or more races 7%
- Hispanic origin (detail)
- Mexican 13% Puerto Rican 2%
- Foreign-born
- 11% · Canada, United Kingdom
- Languages at home
- 83% English-only · Spanish 14% French/Haitian/Cajun 1%
Political lean MEDSL · Clayton
- 2024 margin
- Solid D (+69.2) · D 84.3% · R 15.1%
- 2008→2024 swing
- +2.8pp toward D · 2008: 66.4pp · 2024: 69.2pp
- All cycles
- 2024: D+69.2 2020: D+70.9 2016: D+71.9 2012: D+70.1 2008: D+66.4
Not yet ingested
- Civics
- —
Market trends
- HPI YoY
- ▼ -105.48%
- Current HPI
- 211.6309
- Rent YoY
- ▲ 2.06%
- Metro
- Atlanta-Sandy Springs-Alpharetta, GA
- State GDP YoY
- ▲ 2.66%
- F500 in state
- 28
Industry mix (Fortune 500 HQ in GA)
| Industry | F500 HQs | Revenue |
|---|---|---|
| Paper / Packaging | 2 | $29B |
|
||
| Retail | 1 | $160B |
|
||
| Transportation / Logistics | 1 | $91B |
|
||
| Airlines | 1 | $62B |
|
||
| Consumer Goods | 1 | $47B |
|
||
| Utilities | 1 | $25B |
|
||
Price history
+254.5% since first listed4 events — show timeline
- 2026-01-30 Listed $195,000 GAMLS
- 2017-08-07 Sold (Public Records) $120,000 Public Records
- 1985-10-16 Sold (Public Records) $54,950 Public Records
- 1982-11-01 Sold (Public Records) $55,000 Public Records
Property tax history
+3.6%/yrLatest (2025): $2,681 · -1.8% YoY. Source: county tax records.
Cash-flow waterfall
monthlySold comps — $/sqft
last 12 mo · ≤1 miLoading sold comps…