5133 Vigo Rd · Richmond Dale, OH
Flood risk 1/10 · Minimal
- FEMA flood zone
- X (unshaded)
- Chance of flooding over 30 yrs
- 0.0%
- Est. flood insurance / yr
- $473 – $860
Fire risk 3/10 · Minor
- Est. fire insurance / yr
- $713 – $1,323
Heat risk 4/10 · Minor
- Hot days now (above 101°F)
- 7 days/yr
- Hot days in 30 yrs
- 18 days/yr
Wind risk 2/10 · Minimal
- Chance of severe wind over 30 yrs
- 1.0%
Air-quality risk 2/10 · Minimal
- Unhealthy air days now
- 1 days/yr
- Unhealthy air days in 30 yrs
- 1 days/yr
Risk factors via First Street. Map © Google.
Why this score? — see what drove the C- grade
The composite is a weighted blend of 9 inputs, each scored 0–100. Each bar is that input's sub-score; the figure is the points it added to the 100-point composite (weight × sub-score).
- Cash flow +17.5/30.0
- Appreciation +7.7/10.0
- ARV discount +7.5/15.0
- DSCR +5.5/10.0
- Schools +5.1/10.0
- 1% rule +3.8/10.0
- Livability +2.9/5.0
- Rent growth +2.5/5.0
- Condition / age +2.5/5.0
$97,500
🖨 Deal sheet (PDF) 📄 Offer letter ✓ Due diligence
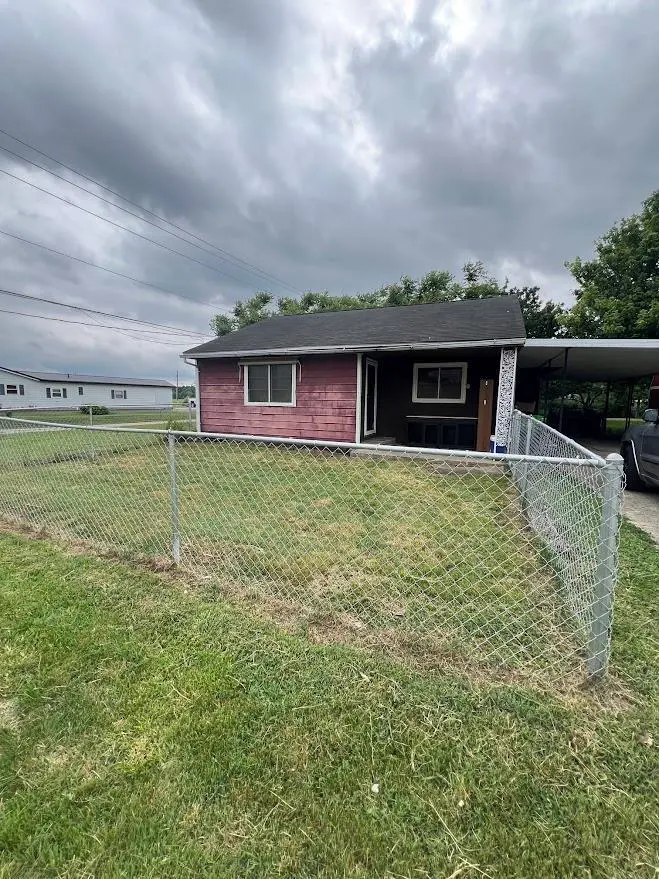
Listing remarks
Opportunity awaits with this 2-bedroom, 1-bath home ready for your vision and renovation expertise. This property offers a solid foundation for a wonderful home, whether you are just starting out or empty nesters wanting to down size. Don't miss this chance. Home is being sold as-is.
Key facts
- Built 1953
- Listed 11 days
Property features AI
Exterior
- Parking: Carport
- Utilities: Public water; Septic tank sewer; Propane service
- Home design: Single-family residence; One story
- Construction: Vinyl siding
- Exterior features: Asphalt roof
Interior
- Kitchen: Range
- Bedrooms: 2 main level bedrooms
- Flooring: Wood flooring; Linoleum flooring
- Bathrooms: 1 full bathroom (main level)
- Heating & cooling: Window unit(s) for cooling
- Interior features: Range; Block partial basement with walk-out access; 5 total rooms
Neighborhood map
What this means for you Summary
Snapshot
- This is a 2-bed/1.0-bath single-family listed at $98k.
Deal economics
- At list price, monthly cash flow is $75 ($902/yr) — positive.
- The deal already cash-flows at list — no discount required.
- To meet the 1% rule (rent ≥ 1% of price), the offer needs to be $86k (11.7% below list).
- Recommended offer: $86k (11.7% below list) — sets the bar for 1% rule.
Location & tenants
- Location reads 57/100 on livability (#1,091 in OH) — a working-class tenant base; expect higher turnover. Strengths: cost of living A+, housing A+, crime A; Watch: health & safety C-, amenities F, commute F.
- Southeastern Local (rural): math 57% / reading 63% proficiency, ranked #294 of 656 in OH (top 45%) — acceptable for families but not a draw, mixed tenant base, ~2y average lease; 73% free/reduced lunch — lower-income household profile, screen leases tightly.
- Zoned schools: Southeastern Middle School (math 57% / reading 65%, grade B+, #252 of 654 statewide, top 39%, 297 students, 99% FRL); Southeastern High School (math 37% / reading 57%, grade D-, #435 of 781 statewide, top 59%, 263 students, 0% FRL) — zoned schools average 50% FRL vs 73% district-wide (23 pts lower); this property's tenant base skews higher-income than the district average.
- Market conditions: 7 active listings in the ZIP; 24 units permitted in Ross County in 2024 (0 in 5+ unit buildings).
- This rent is only 16% of the median local income ($64k/yr) — well below the 30% rent-burden line; pricing power to push rent on renewal without tenant pushback.
Forward outlook
- In year one you build about $6k of equity ($674 loan paydown + $5k appreciation (5.3% local appreciation)).
- Ross County population projected at -12% by 2050 — secular population decline; favor cash flow + early exit over multi-decade hold.
- At projected returns (5.3% appreciation + 3.0% rent growth), your $27k cash investment doubles in ~4 years — after that, you're playing with house money.
- By year 6, paydown + projected appreciation supports a ~$32k cash-out refi (75% LTV) — recoverable capital for the next deal without selling this one.
Negotiation context
- Only 11 days on market — expect competitive offers; lowballing is unlikely to land.
- Current owner paid $54k; list at $98k implies a 82% gain — meaningful room to come down on a strong offer.
Risks & watch-outs
- Watch-outs: built in 1953 — expect roof / HVAC / electrical / plumbing capex.
Questions for the listing agent
- Built in 1953 — when were the roof, HVAC, electrical panel, plumbing, and water heater last replaced?
- Is there a deadline driving the sale (1031 exchange, divorce, estate, relocation)? That informs how much negotiation room exists.
- Schools are F-rated, which usually means shorter tenancies and higher turnover. Who's the typical renter profile here, and what's been the actual vacancy rate?
- What's the average days-on-market for RENTAL listings here right now (not sales)? A rising rental-DOM trend means longer vacancies and softer asking-rent achievability than the comps imply.
- What's the recent tenant-quality profile in this submarket — average credit score on applications, eviction rate, late-payment / NSF rate, and stable-employment percentage? A property-management company in the area should have these aggregated.
- How much new for-sale + rental construction is in the pipeline within 1–3 miles? Heavy new supply typically softens prices + rents 12–24 months out; constrained supply supports both.
Investment metrics
- 1% rule
- 0.88% ✗
- Cap rate
- 7.22%
- Cash-on-cash
- 3.30%
- DSCR
- 1.15
- GRM
- 9.4
CMA / ARV
No comps found within radius.
Projected returns pro-forma
5.32% appreciation · 3.0% rent growth · sell at horizon
- IRR
- 16.4%
- Equity multiple
- 2.06×
- Total profit
- $29,013
- Equity at exit
- $57,150
- IRR
- 16.6%
- Equity multiple
- 4.03×
- Total profit
- $82,727
- Equity at exit
- $100,238
Cash invested: $27,300 (down + closing). Projections, not guarantees.
Landlord ↔ Tenant lean methodology
- Overall (STATE)
- 73 Landlord-Friendly
- State Ohio
- 73 Landlord-Friendly · R+6
- County
- — inherits STATE
- City
- — inherits STATE
ZIP-level market 45647
- Home prices YoY
- 2.1%
- Active inventory
- 7
- Price-to-rent
- 9.4×
Monthly cashflow live
- Estimated rent
- $860 medium interval (Pro) →
- Mortgage (P&I)
- −$511
- Tax from tax record
- −$53 /mo · $632/yr
- Insurance
- −$41
- HOA
- −$0
- Vacancy / Maint / Mgmt
- −$181
- Net cashflow
- $75
Break-even live
Sensitivity live
| Price | -10% $130 | -5% $103 | +0% $75 | +5% $48 | +10% $20 |
|---|---|---|---|---|---|
| Rent | -10% $7 | -5% $41 | +0% $75 | +5% $109 | +10% $143 |
| Rate | -1.0pp $124 | -0.5pp $100 | base $75 | +0.5pp $50 | +1.0pp $24 |
UW: 25.0% down · 7.5% · 30yr · 1.5% tax · 5.0% vac · 8.0% maint · 8.0% mgmt
Financing live
Cash to close
- Down payment
- $24,375
- Closing costs
- $2,925
- Reserves months
- —
- Total cash needed
- —
Loan-product check · same deal, 3 products live
Conventional
25% down · 7.5% · 30yr
- Down + closing
- —
- Monthly P&I
- —
- Monthly cashflow
- —
- DSCR
- —
- Eligible?
- —
Personal DTI + credit; lowest rate.
DSCR
20% down · 8.5% · 30yr
- Down + closing
- —
- Monthly P&I
- —
- Monthly cashflow
- —
- DSCR
- —
- Eligible?
- —
No personal income docs; deal must DSCR.
Hard money
10% down · 12.0% · 12mo
- Down + closing
- —
- Monthly P&I
- —
- Monthly cashflow
- —
- DSCR
- —
- Eligible?
- —
Short-term bridge; refi at stabilization.
Listing history 8 events
-
2026-06-21statusdays on market $97,500 Active Under Contract 11 DOM
-
2026-06-18days on market $97,500 Active 9 DOM
-
2026-06-17days on market $97,500 Active 8 DOM
-
2026-06-16days on market $97,500 Active 7 DOM
-
2026-06-15days on market $97,500 Active 6 DOM
-
2026-06-13days on market $97,500 Active 4 DOM
-
2026-06-12remarks 284-char remark
-
2026-06-12$97,500 Active 3 DOM
ⓘ Source: listings_history table (triggers on properties + properties_extension) + one-shot
backfill from property_details.listing_events for pre-trigger history.
Tax reassessment forecast OH · Partial reset (capped growth)
- Current annual tax
- $632 · $53/mo
- Projected year-2 tax
- $1,077 · $90/mo
- Expected delta
- +$444/yr (+$37/mo · 70.3%)
ⓘ Screening estimate from a state-policy table — verify with the county assessor before closing.
Climate risk First Street
- Flood 1/10 Low FEMA zone X (unshaded) · 0% chance over 30 yrs
- Wildfire 3/10 Moderate
- Heat 4/10 Moderate 7 d/yr ≥101°F today · 18 d/yr by 30 yrs out
- Wind 2/10 Low 100% chance of damaging wind over 30 yrs
- Air quality 2/10 Low 1 unhealthy d/yr today · 1 by 30 yrs out
Nearby sold comps map
Loading sold comps map…
Walkable amenities ~0.75 mi
Loading nearby amenities…
Taxation est. · year 1
- Rental income
- $10,326
- − Mortgage interest
- −$5,462
- − Property taxes
- −$632
- − Insurance
- −$488
- − Repairs & maintenance
- −$826
- − Management
- −$826
- − Depreciation
- −$2,836
- Taxable loss
- −$744
- Est. tax savings @ 24.0%
- +$179
- After-tax cash flow
- $1,080/yr
For passive investors: Depreciation is non-cash, so a rental often shows a tax loss while cash-flowing — sheltering income. Rental losses are passive: they offset passive income freely, and up to $25,000/yr can offset ordinary (W-2) income if you actively participate and your MAGI is under $100k (phasing out to $0 by $150k); unused losses carry forward. On sale, claimed depreciation is recaptured at up to 25%, and gains may owe capital-gains tax (a 1031 exchange can defer both). Figures are a year-1 estimate at your 24.0% rate — not tax advice; consult a CPA.
Schools (NCES district)
- District
- Southeastern Local
- NCES district ID
- 3904952
- Math proficiency
- 57% ▼ -9.00%
- Reading proficiency
- 63% ▼ -4.00%
- Median HH income
- $45,736
- Composite
- 50.65/100
- National rank
- #1832
- State rank
- #294 of 656 in OH
Livability — Richmond Dale
- Score
- 57/100
- State rank
- #1091
- US rank
- #21959
Category grades
Schools grade is shown separately in the Schools card above.
Census & demographics
- County
- Vinton · 12,723 people
- City population
- 600
- Population (ZIP)
- 2,276
- Household income
- $63,906
- Rent vs Own
Population outlook (Ross County) Hauer SSP2
- Today (2025)
- 75,482 people
- By 2030
- 74,035 · -1.9%
- By 2040
- 70,702 · -6.3%
- By 2050
- 66,706 · -11.6%
- By 2075
- 55,398 · -26.6%
- By 2100
- 42,197 · -44.1%
Race, ethnicity, and origin ACS 2023
- Neighborhood character
- Predominantly White (97%)
- Race & ethnicity
- White 97% Black 3%
- Common ancestry
- Italian 6% Polish 3% Serbian 1%
- Languages at home
- 97% English-only · German/W. Germanic 2% French/Haitian/Cajun 1%
Political lean MEDSL · Ross
- 2024 margin
- Solid R (+39.3) · D 29.9% · R 69.2%
- 2008→2024 swing
- -32.1pp toward R · 2008: -7.2pp · 2024: -39.3pp
- All cycles
- 2024: R+39.3 2020: R+35.2 2016: R+27.4 2012: R+2.4 2008: R+7.2
Not yet ingested
- Civics
- —
Market trends
- HPI YoY
- ▲ 5.32%
- Current HPI
- 252.6061
- Rent YoY
- —
- Metro
- —
- State GDP YoY
- ▲ 1.98%
- F500 in state
- 48
Industry mix (Fortune 500 HQ in OH)
| Industry | F500 HQs | Revenue |
|---|---|---|
| Insurance | 3 | $145B |
|
||
| Industrial Machinery | 3 | $49B |
|
||
| Financial Services | 3 | $24B |
|
||
| Consumer Goods | 2 | $93B |
|
||
| Aerospace / Defense | 2 | $47B |
|
||
| Utilities | 2 | $33B |
|
||
Price history
+82.2% since first listed2 events — show timeline
- 2026-06-09 Listed $97,500 SVAR
- 2007-11-20 Sold (Public Records) $53,500 Public Records
Property tax history
-2.1%/yrLatest (2025): $632 · +5.6% YoY. Source: county tax records.
Cash-flow waterfall
monthlySold comps — $/sqft
last 12 mo · ≤1 miLoading sold comps…