14538 Shady Holw · Grand Haven, MI
Flood risk No data
- FEMA flood zone
- —
- Chance of flooding over 30 yrs
- —
- Est. flood insurance / yr
- —
Fire risk No data
- Est. fire insurance / yr
- —
Heat risk No data
- Hot days now (above threshold)
- —
- Hot days in 30 yrs
- —
Wind risk No data
- Chance of severe wind over 30 yrs
- —
Air-quality risk No data
- Unhealthy air days now
- —
- Unhealthy air days in 30 yrs
- —
Risk factors via First Street. Map © Google.
Why this score? — see what drove the B+ grade
The composite is a weighted blend of 9 inputs, each scored 0–100. Each bar is that input's sub-score; the figure is the points it added to the 100-point composite (weight × sub-score).
- Cash flow +30.0/30.0
- ARV discount +15.0/15.0
- 1% rule +10.0/10.0
- DSCR +10.0/10.0
- Livability +4.0/5.0
- Condition / age +4.0/5.0
- Schools +3.9/10.0
- Rent growth +2.5/5.0
- Appreciation +0.0/10.0
$46,499
🖨 Deal sheet 📄 Offer letter ✓ Due diligence
Listing remarks
This spacious 3 bed/2 bath home is fully updated and includes all the must haves for your new home
Key facts
- Built 2026
- Listed 31 days
Neighborhood map
What this means for you Summary
Snapshot
- This is a 3-bed/2.0-bath manufactured listed at $46k. Condition is rated good.
Deal economics
- At list price, monthly cash flow is $863 ($10k/yr) — positive.
- The deal already cash-flows at list — no discount required.
- Meets the 1% rule at list price ($1k rent vs $46k).
- Recommended offer: $45k (3.0% below list) — sets the bar for market timing.
- Cap rate 28.6% vs local median 1.8% in Grand Haven — top-decile yield for the area; either an underpriced asset or a hidden risk that comps aren't pricing in. Stress-test before assuming the spread holds.
Location & tenants
- Location reads 81/100 on livability (#69 in MI, #1,467 nationally) — a professional / high-income tenant draw. Strengths: schools A+, cost of living A+, housing A+; Watch: employment C-, commute F.
- West Ottawa Public School District (suburban): math 37% / reading 52% proficiency, ranked #140 of 540 in MI (top 26%) — families likely to look elsewhere, expect single-tenant / working-renter base with shorter leases.
- Market conditions: 62 active listings in the ZIP; 1 comparable units currently listed for rent nearby; 1,237 units permitted in Ottawa County in 2024 (443 in 5+ unit buildings).
Forward outlook
- Local home prices are declining (-3.0%/yr); year-one equity from $321 of loan paydown is wiped out by about $1k of value loss. Plan a longer hold.
- Ottawa County population projected at +24% by 2050 — long-run rental-demand tailwind backs the buy-and-hold thesis.
- At projected returns (-3.0% appreciation + 3.0% rent growth), your $13k cash investment doubles in ~2 years — after that, you're playing with house money.
Negotiation context
- It's been on market 31 days — a 3% lower offer ($45k) is reasonable based on typical stale-listing flexibility.
Questions for the listing agent
- It's been on market 31 days. Have you received any prior offers? Is the seller open to a 3% concession, seller financing, or rate buy-down credit?
- Is there a deadline driving the sale (1031 exchange, divorce, estate, relocation)? That informs how much negotiation room exists.
- Schools are A-rated — typically a magnet for longer-tenancy family renters. What's the average tenant stay here, and is there a school-zone premium baked into asking?
- What's the average days-on-market for RENTAL listings here right now (not sales)? A rising rental-DOM trend means longer vacancies and softer asking-rent achievability than the comps imply.
- What's the recent tenant-quality profile in this submarket — average credit score on applications, eviction rate, late-payment / NSF rate, and stable-employment percentage? A property-management company in the area should have these aggregated.
- How much new for-sale + rental construction is in the pipeline within 1–3 miles? Heavy new supply typically softens prices + rents 12–24 months out; constrained supply supports both.
Investment metrics
- 1% rule
- 3.22% ✓
- Cap rate
- 28.56%
- Cash-on-cash
- 79.53%
- DSCR
- 4.54
- GRM
- 2.6
CMA / ARV
- ARV (median comp)
- $61,800
- List price
- $46,499
- Delta
- -24.76%
- Verdict
- UNDERPRICED
- Comps
- 3 within 1.0 mi
Show comp detail 2 sales within ~0.75 mi
| Address | Dist | Beds/Ba | Sqft | Sold | Price | $/sf | Match |
|---|---|---|---|---|---|---|---|
| 9045 4 Winds Ln W | 0.33mi | 3/2.0 | 1,012 (+3%) | 3mo | $61,800 | $61 | 77 |
| 14275 Winters Creek East | 0.40mi | 2/2.0 (-1) | 960 (-2%) | 10mo | $65,000 | $68 | 65 |
Match score weights: distance 35% · size 25% · config 20% · recency 20%. Top-matched comps best support the ARV.
Projected returns pro-forma
-3.0% appreciation · 3.0% rent growth · sell at horizon
- IRR
- 79.7%
- Equity multiple
- 4.64×
- Total profit
- $47,444
- Equity at exit
- $6,933
- IRR
- 83.1%
- Equity multiple
- 9.62×
- Total profit
- $112,171
- Equity at exit
- $4,020
Cash invested: $13,020 (down + closing). Projections, not guarantees.
Landlord ↔ Tenant lean methodology
- Overall (STATE)
- 62 Landlord-Friendly
- State Michigan
- 62 Landlord-Friendly · EVEN
- County
- — inherits STATE
- City
- — inherits STATE
ZIP-level market 49460
- Home prices YoY
- -30.4%
- Active inventory
- 62
- Price-to-rent
- 2.6×
Monthly cashflow live
- Estimated rent
- $1,499 medium interval (Pro) →
- Mortgage (P&I)
- −$244
- Tax est. 1.5%
- −$58 /mo · $697/yr
- Insurance
- −$19
- HOA
- −$0
- Vacancy / Maint / Mgmt
- −$315
- Net cashflow
- $863
Break-even live
UW: 25.0% down · 7.5% · 30yr · 1.5% tax · 5.0% vac · 8.0% maint · 8.0% mgmt
Financing live
Cash to close
- Down payment
- $11,625
- Closing costs
- $1,395
- Reserves months
- —
- Total cash needed
- —
Loan-product check · same deal, 3 products live
Conventional
25% down · 7.5% · 30yr
- Down + closing
- —
- Monthly P&I
- —
- Monthly cashflow
- —
- DSCR
- —
- Eligible?
- —
Personal DTI + credit; lowest rate.
DSCR
20% down · 8.5% · 30yr
- Down + closing
- —
- Monthly P&I
- —
- Monthly cashflow
- —
- DSCR
- —
- Eligible?
- —
No personal income docs; deal must DSCR.
Hard money
10% down · 12.0% · 12mo
- Down + closing
- —
- Monthly P&I
- —
- Monthly cashflow
- —
- DSCR
- —
- Eligible?
- —
Short-term bridge; refi at stabilization.
Rent comps 1 comps
| Address | Beds | Baths | Sqft | Rent | $/sqft | DOM | Units | Dist |
|---|---|---|---|---|---|---|---|---|
| 8930 146th Ave West Olive, MI | 3.0–4.0 | 2.0 | 1424 | $1,499 | $1.05 | 2d | 1 | 0.14mi |
Listing history 2 events
-
2026-05-12price $47,499 98-char remark
-
2026-04-29$46,499 Active 98-char remark
ⓘ Source: listings_history table (triggers on properties + properties_extension) + one-shot
backfill from property_details.listing_events for pre-trigger history.
Nearby sold comps map
Loading sold comps map…
Walkable amenities ~0.75 mi
Loading nearby amenities…
Taxation est. · year 1
- Rental income
- $17,988
- − Mortgage interest
- −$2,605
- − Property taxes
- −$697
- − Insurance
- −$232
- − Repairs & maintenance
- −$1,439
- − Management
- −$1,439
- − Depreciation
- −$1,353
- Taxable income
- $10,223
- Est. tax owed @ 24.0%
- −$2,453
- After-tax cash flow
- $7,901/yr
For passive investors: Depreciation is non-cash, so a rental often shows a tax loss while cash-flowing — sheltering income. Rental losses are passive: they offset passive income freely, and up to $25,000/yr can offset ordinary (W-2) income if you actively participate and your MAGI is under $100k (phasing out to $0 by $150k); unused losses carry forward. On sale, claimed depreciation is recaptured at up to 25%, and gains may owe capital-gains tax (a 1031 exchange can defer both). Figures are a year-1 estimate at your 24.0% rate — not tax advice; consult a CPA.
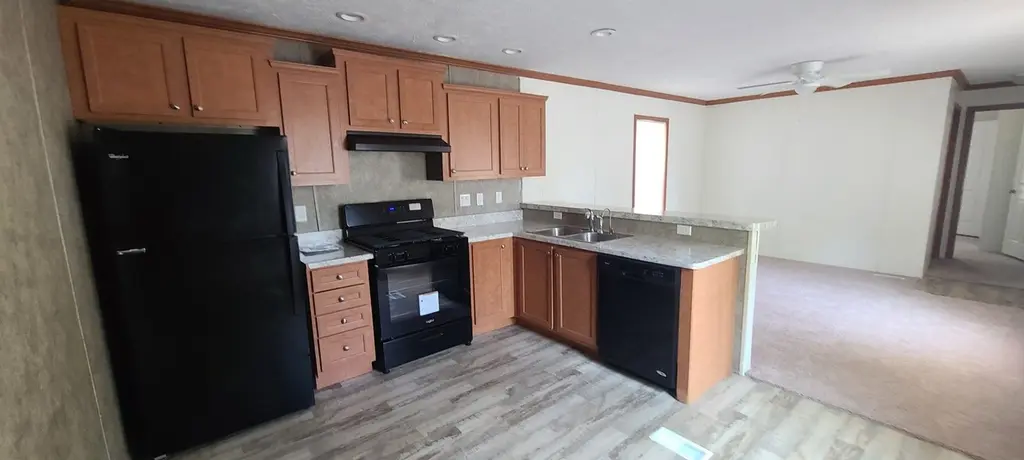
Condition & rehab AI · 1 photo
This fully updated 3-bedroom, 2-bathroom home is in excellent condition and ready for move-in. Minor updates to the exterior and landscaping can further enhance its appeal.
Value-add opportunities
- Both Painting the exterior and interior — Fresh paint enhances curb appeal and interior aesthetics.
- Both Landscaping and curb appeal improvements — Enhances the home's curb appeal and can attract more potential buyers or renters.
- Both Adding smart home features — Improves convenience and can be a selling point for both buyers and renters.
- Resale Upgrading the kitchen appliances — Modern appliances can attract more buyers and increase the home's value.
- Resale Upgrading the bathrooms with modern fixtures — Modern bathrooms can attract more buyers and increase the home's value.
- Rental Adding a smart thermostat — Can reduce energy costs and attract renters who value energy efficiency.
Renovation cost estimate screening
Value-add ROI direction
- Both Painting the exterior and interior — Fresh paint enhances curb appeal and interior aesthetics. ↑
- Both Landscaping and curb appeal improvements — Enhances the home's curb appeal and can attract more potential buyers or renters. ↑
- Both Adding smart home features — Improves convenience and can be a selling point for both buyers and renters. ↑
- Resale Upgrading the kitchen appliances — Modern appliances can attract more buyers and increase the home's value. ↑
- Resale Upgrading the bathrooms with modern fixtures — Modern bathrooms can attract more buyers and increase the home's value. ↑
- Rental Adding a smart thermostat — Can reduce energy costs and attract renters who value energy efficiency. ↑
ⓘ Cost ranges are severity-bucket heuristics (US national rule-of-thumb). Get contractor quotes + a written scope before underwriting a rehab budget.
Schools (NCES district)
- District
- West Ottawa Public School District
- NCES district ID
- 2635910
- Math proficiency
- 37% ▼ -4.00%
- Reading proficiency
- 52% ▼ -4.00%
- Median HH income
- $58,127
- Composite
- 38.94/100
- National rank
- #4087
- State rank
- #140 of 540 in MI
Livability — Grand Haven
- Score
- 81/100
- State rank
- #69
- US rank
- #1467
Category grades
Schools grade is shown separately in the Schools card above.
Census & demographics
- City population
- 33,878
- Population (ZIP)
- 8,891
Population outlook (Ottawa County) Hauer SSP2
- Today (2025)
- 313,561 people
- By 2030
- 330,027 · +5.3%
- By 2040
- 361,118 · +15.2%
- By 2050
- 388,414 · +23.9%
- By 2075
- 452,175 · +44.2%
- By 2100
- 473,041 · +50.9%
Race, ethnicity, and origin ACS 2023
- Neighborhood character
- Predominantly White (75%)
- Race & ethnicity
- White 75% Hispanic / Latino 12% Two or more races 7% Asian 6% Black 2%
- Hispanic origin (detail)
- Mexican 8% Puerto Rican 2%
- Common ancestry
- Iranian 24% Romanian 5% Italian 3%
- Foreign-born
- 10% · Canada
- Languages at home
- 89% English-only · Spanish 6% Other Indo-European 2% Other Asian/Pacific 2%
Political lean MEDSL · Ottawa
- 2024 margin
- Strong R (+20.4) · D 39.0% · R 59.5% · Other 1.5%
- 2008→2024 swing
- +3.4pp toward D · 2008: -23.9pp · 2024: -20.4pp
- All cycles
- 2024: R+20.4 2020: R+21.5 2016: R+30.4 2012: R+34.2 2008: R+23.9
Not yet ingested
- Civics
- —
Market trends
- HPI YoY
- ▼ -129.51%
- Current HPI
- 297.0617
- Rent YoY
- —
- Metro
- —
- State GDP YoY
- ▲ 1.37%
- F500 in state
- 28
Industry mix (Fortune 500 HQ in MI)
| Industry | F500 HQs | Revenue |
|---|---|---|
| Automotive Parts | 3 | $48B |
|
||
| Automotive | 2 | $372B |
|
||
| Chemicals | 1 | $45B |
|
||
| Automotive Retail | 1 | $29B |
|
||
| Healthcare / Medical Devices | 1 | $23B |
|
||
| Automotive Technology | 1 | $20B |
|
||
Cash-flow waterfall
monthlySold comps — $/sqft
last 12 mo · ≤1 miLoading sold comps…