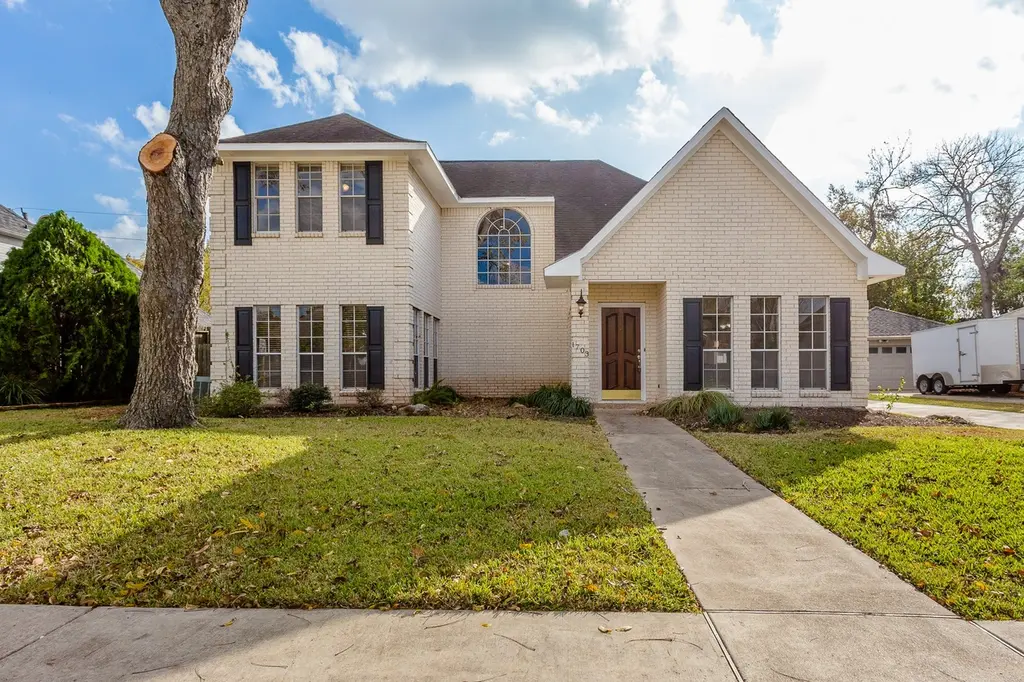
1703 Plantation Dr · Pecan Grove, TX
Flood risk 5/10 · Moderate
- FEMA flood zone
- X
- Chance of flooding over 30 yrs
- 0.24%
- Est. flood insurance / yr
- $507 – $1,088
Fire risk 3/10 · Minor
- Est. fire insurance / yr
- $1,222 – $2,270
Heat risk 9/10 · Severe
- Hot days now (above 110°F)
- 7 days/yr
- Hot days in 30 yrs
- 23 days/yr
Wind risk 9/10 · Severe
- Chance of severe wind over 30 yrs
- 99.0%
Air-quality risk 2/10 · Minimal
- Unhealthy air days now
- 1 days/yr
- Unhealthy air days in 30 yrs
- 2 days/yr
Risk factors via First Street. Map © Google.
Why this score? — see what drove the D+ grade
The composite is a weighted blend of 9 inputs, each scored 0–100. Each bar is that input's sub-score; the figure is the points it added to the 100-point composite (weight × sub-score).
- Cash flow +14.5/30.0
- ARV discount +11.8/15.0
- Schools +4.5/10.0
- 1% rule +4.4/10.0
- DSCR +4.4/10.0
- Livability +3.6/5.0
- Condition / age +2.5/5.0
- Rent growth +2.1/5.0
- Appreciation +0.0/10.0
$379,900
🖨 Deal sheet 📄 Offer letter ✓ Due diligence
Listing remarks MLS
Gorgeous 4-bedroom 3 full bath home with high ceilings in beautiful pecan Grove Plantation. Spacious formal dining upon entry with tile flooring. Huge family room with a gorgeous fireplace! perfect for entertaining guests! Huge primary suite downstairs with tile flooring and updated primary bath. An additional secondary bedroom with a full bathroom downstairs. Gorgeous Kitchen with granite countertops and backsplash. Beautifully done wooden stairs! Two additional bedrooms, a full bathroom and huge game room upstairs. Beautiful Laminate/ wood flooring upstairs. No carpet in the entire house. Brand new Roof with warranties, Detached Garage! Covered Patio and a huge back yard! Exemplary FBISD!
Key facts
- 9,997 sq ft lot
- 2 garage spots
- Built 1983
Neighborhood map
What this means for you Summary
Snapshot
- This is a 3-bed/3.0-bath single-family listed at $380k.
Deal economics
- At list price, monthly cash flow is $83 ($998/yr) — positive.
- The deal already cash-flows at list — no discount required.
- To meet the 1% rule (rent ≥ 1% of price), the offer needs to be $358k (5.7% below list).
- Recommended offer: $346k (9.0% below list) — sets the bar for market timing.
- Cap rate 6.6% vs local median 2.1% in Pecan Grove — top-decile yield for the area; either an underpriced asset or a hidden risk that comps aren't pricing in. Stress-test before assuming the spread holds.
Location & tenants
- Location reads 72/100 on livability (#256 in TX) — a middle-class / working-renter tenant base. Strengths: employment A+, housing A+, crime A; Watch: amenities F, commute F, health & safety F.
- Fort Bend ISD (suburban): math 44% / reading 53% proficiency, ranked #140 of 826 in TX (top 17%) — families likely to look elsewhere, expect single-tenant / working-renter base with shorter leases.
- Market conditions: Rents soft (-1.6%/yr); 1222 active listings in the ZIP; 3 comparable units currently listed for rent nearby; rentals at typical pace (median 19d on market — plan ~3-4 weeks tenant-placement turnaround); high-income renter base; 12,093 units permitted in Fort Bend County in 2024 (815 in 5+ unit buildings).
- This rent runs 30% of the median local income ($142k/yr) — at the standard rent-burdened threshold; future hikes will face affordability resistance.
Forward outlook
- Local home prices are declining (-3.0%/yr); year-one equity from $3k of loan paydown is wiped out by about $11k of value loss. Plan a longer hold.
- Fort Bend County population projected at +75% by 2050 — long-run rental-demand tailwind backs the buy-and-hold thesis.
Negotiation context
- It's been on market 102 days — a 9% lower offer ($346k) is reasonable based on typical stale-listing flexibility.
- 8 sale attempts since 7y ago; this cycle's ask is 15102% above the opening price — seller raised mid-cycle; expect resistance to lowballs.
Risks & watch-outs
- Climate carrying-cost: moderate flood risk; severe wind risk, 99% chance of damaging wind over 30y; extreme-heat days projected 7→23/yr by 2055 (HVAC capex compounding) — expect insurance premiums to compound above CPI over the hold.
Questions for the listing agent
- It's been on market 102 days. Have you received any prior offers? Is the seller open to a 9% concession, seller financing, or rate buy-down credit?
- What does the HOA fee cover, when was the last increase, and are there any pending special assessments or reserve-fund shortfalls?
- Why hasn't it sold? Are there any deal-killer items the seller is aware of (foundation, flood, title, zoning, code violations)?
- Is there a deadline driving the sale (1031 exchange, divorce, estate, relocation)? That informs how much negotiation room exists.
- The area grade is low — what's the realistic commute time and amenity access for the typical tenant pool here? Any planned neighborhood developments (good or bad) we should know about?
- What's the average days-on-market for RENTAL listings here right now (not sales)? A rising rental-DOM trend means longer vacancies and softer asking-rent achievability than the comps imply.
- What's the recent tenant-quality profile in this submarket — average credit score on applications, eviction rate, late-payment / NSF rate, and stable-employment percentage? A property-management company in the area should have these aggregated.
- How much new for-sale + rental construction is in the pipeline within 1–3 miles? Heavy new supply typically softens prices + rents 12–24 months out; constrained supply supports both.
Investment metrics
- 1% rule
- 0.94% ✗
- Cap rate
- 6.56%
- Cash-on-cash
- 0.94%
- DSCR
- 1.04
- GRM
- 8.8
CMA / ARV
- ARV (median comp)
- $419,900
- List price
- $379,900
- Delta
- -9.53%
- Verdict
- FAIR
- Comps
- 20 within 1.0 mi
Show comp detail 12 sales within ~0.75 mi
| Address | Dist | Beds/Ba | Sqft | Sold | Price | $/sf | Match |
|---|---|---|---|---|---|---|---|
| 1206 Austin Colony Dr | 0.22mi | 3/2.5 | 2,745 (-0%) | 3mo | $510,000 | $186 | 85 |
| 1706 N Hearthside Dr | 0.03mi | 4/3.5 (+1) | 3,030 (+10%) | 3mo | $529,900 | $175 | 72 |
| 2318 Quarterpath Dr | 0.49mi | 4/3.0 (+1) | 2,765 (+0%) | 1mo | $499,000 | $180 | 71 |
| 2215 Enchanted Path Ct | 0.21mi | 4/4.0 (+1) | 2,920 (+6%) | 1mo | $509,900 | $175 | 70 |
| 1927 Pitts Rd | 0.16mi | 4/3.5 (+1) | 3,137 (+14%) | 2mo | $450,000 | $143 | 61 |
| 1611 Deerfield Ct | 0.67mi | 4/2.5 (+1) | 2,750 (-0%) | 2mo | $500,000 | $182 | 60 |
| 2814 Old South Dr | 0.71mi | 4/3.0 (+1) | 2,694 (-2%) | 1mo | $415,000 | $154 | 58 |
| 1802 Quarterpath Dr | 0.55mi | 3/2.5 | 2,482 (-10%) | 1mo | $380,000 | $153 | 55 |
| 1915 Rock Fence Dr | 0.36mi | 3/2.0 | 2,346 (-15%) | 2mo | $410,000 | $175 | 53 |
| 2315 Landscape Way | 0.55mi | 4/3.5 (+1) | 2,964 (+8%) | 2mo | $420,000 | $142 | 53 |
| 2710 Old South Dr | 0.63mi | 4/3.5 (+1) | 2,990 (+8%) | 2mo | $384,990 | $129 | 48 |
| 1311 Sweet Dumpling Dr | 0.61mi | 4/3.5 (+1) | 3,055 (+11%) | 2mo | $599,900 | $196 | 45 |
Match score weights: distance 35% · size 25% · config 20% · recency 20%. Top-matched comps best support the ARV.
Projected returns pro-forma
-3.0% appreciation · 0.0% rent growth · sell at horizon
- IRR
- -18.4%
- Equity multiple
- 0.37×
- Total profit
- $-66,631
- Equity at exit
- $56,644
- IRR
- -18.5%
- Equity multiple
- 0.14×
- Total profit
- $-91,243
- Equity at exit
- $32,847
Cash invested: $106,372 (down + closing). Projections, not guarantees.
Landlord ↔ Tenant lean methodology
- Overall (STATE)
- 87 Strongly Landlord-Friendly
- State Texas
- 87 Strongly Landlord-Friendly · R+5
- County
- — inherits STATE
- City
- — inherits STATE
ZIP-level market 77406
- Home prices YoY
- -26.2%
- Rents YoY
- -1.6%
- Active inventory
- 1222
- Price-to-rent
- 8.8×
Monthly cashflow live
- Estimated rent
- $3,582 medium interval (Pro) →
- Mortgage (P&I)
- −$1,992
- Tax from tax record
- −$573 /mo · $6,874/yr
- Insurance
- −$158
- HOA
- −$23
- Vacancy / Maint / Mgmt
- −$752
- Net cashflow
- $83
Break-even live
UW: 25.0% down · 7.5% · 30yr · 1.5% tax · 5.0% vac · 8.0% maint · 8.0% mgmt
Financing live
Cash to close
- Down payment
- $94,975
- Closing costs
- $11,397
- Reserves months
- —
- Total cash needed
- —
Loan-product check · same deal, 3 products live
Conventional
25% down · 7.5% · 30yr
- Down + closing
- —
- Monthly P&I
- —
- Monthly cashflow
- —
- DSCR
- —
- Eligible?
- —
Personal DTI + credit; lowest rate.
DSCR
20% down · 8.5% · 30yr
- Down + closing
- —
- Monthly P&I
- —
- Monthly cashflow
- —
- DSCR
- —
- Eligible?
- —
No personal income docs; deal must DSCR.
Hard money
10% down · 12.0% · 12mo
- Down + closing
- —
- Monthly P&I
- —
- Monthly cashflow
- —
- DSCR
- —
- Eligible?
- —
Short-term bridge; refi at stabilization.
Rent comps 3 comps
| Address | Beds | Baths | Sqft | Rent | $/sqft | DOM | Units | Dist |
|---|---|---|---|---|---|---|---|---|
| 707 Land Grant Dr Richmond, TX | 4.0 | 2.0 | 1994 | $2,595 | $1.30 | 43d | 1 | 0.77mi |
| 331 Old Silo St Richmond, TX | 4.0 | 3.5 | 3568 | $5,500 | $1.54 | 18d | 1 | 1.36mi |
| 331 Old Silo St Richmond, TX | 4.0 | 3.5 | 3568 | $5,500 | $1.54 | 4d | 1 | 1.36mi |
HOA detail
- Monthly dues
- $23 · $276/yr
Listing history 22 events
-
2026-06-04days on market $379,900 Active 102 DOM
-
2026-06-03days on market $379,900 Active 101 DOM
-
2026-06-02days on market $379,900 Active 100 DOM
-
2026-06-01days on market $379,900 Active 99 DOM
-
2026-05-31days on market $379,900 Active 98 DOM
-
2026-05-07$2,499
-
2026-04-09historical $2,499
-
2026-03-20$2,499
-
2026-02-22$379,900 Active 700-char remark
Show marketing remark (700 chars)
Gorgeous 4-bedroom 3 full bath home with high ceilings in beautiful pecan Grove Plantation. Spacious formal dining upon entry with tile flooring. Huge family room with a gorgeous fireplace! perfect for entertaining guests! Huge primary suite downstairs with tile flooring and updated primary bath. An additional secondary bedroom with a full bathroom downstairs. Gorgeous Kitchen with granite countertops and backsplash. Beautifully done wooden stairs! Two additional bedrooms, a full bathroom and huge game room upstairs. Beautiful Laminate/ wood flooring upstairs. No carpet in the entire house. Brand new Roof with warranties, Detached Garage! Covered Patio and a huge back yard! Exemplary FBISD!
-
2024-11-19historical $2,500
-
2024-10-30price $2,500
-
2024-10-28$2,600
-
2019-12-10historical
-
2019-11-26$249,900 Active
-
2019-10-07soldstatus Sold
-
2019-09-11status Pending
-
2019-08-29price $200,640
-
2019-08-16status Active
-
2019-06-18status Pending
-
2019-06-01status Active
-
2019-05-07status Pending
-
2019-04-18$228,000 Active
ⓘ Source: listings_history table (triggers on properties + properties_extension) + one-shot
backfill from property_details.listing_events for pre-trigger history.
Tax reassessment forecast TX · Resets to sale price
- Current annual tax
- $6,874 · $573/mo
- Projected year-2 tax
- $6,952 · $579/mo
- Expected delta
- +$79/yr (+$7/mo · 1.1%)
ⓘ Screening estimate from a state-policy table — verify with the county assessor before closing.
Climate risk First Street
- Flood 5/10 Major FEMA zone X · 24% chance over 30 yrs
- Wildfire 3/10 Moderate
- Heat 9/10 Extreme 7 d/yr ≥110°F today · 23 d/yr by 30 yrs out
- Wind 9/10 Extreme 99% chance of damaging wind over 30 yrs
- Air quality 2/10 Low 1 unhealthy d/yr today · 2 by 30 yrs out
Nearby sold comps map
Loading sold comps map…
Walkable amenities ~0.75 mi
Loading nearby amenities…
Taxation est. · year 1
- Rental income
- $42,980
- − Mortgage interest
- −$21,280
- − Property taxes
- −$6,874
- − Insurance
- −$1,900
- − Repairs & maintenance
- −$3,438
- − Management
- −$3,438
- − HOA
- −$276
- − Depreciation
- −$11,052
- Taxable loss
- −$5,278
- Est. tax savings @ 24.0%
- +$1,267
- After-tax cash flow
- $2,265/yr
For passive investors: Depreciation is non-cash, so a rental often shows a tax loss while cash-flowing — sheltering income. Rental losses are passive: they offset passive income freely, and up to $25,000/yr can offset ordinary (W-2) income if you actively participate and your MAGI is under $100k (phasing out to $0 by $150k); unused losses carry forward. On sale, claimed depreciation is recaptured at up to 25%, and gains may owe capital-gains tax (a 1031 exchange can defer both). Figures are a year-1 estimate at your 24.0% rate — not tax advice; consult a CPA.
Schools (NCES district)
- District
- Fort Bend ISD
- NCES district ID
- 4819650
- Math proficiency
- 44% ▼ -15.00%
- Reading proficiency
- 53% ▼ -4.00%
- Median HH income
- $82,360
- Composite
- 44.61/100
- National rank
- #2779
- State rank
- #140 of 826 in TX
Livability — Pecan Grove
- Score
- 72/100
- State rank
- #256
- US rank
- #6017
Category grades
Schools grade is shown separately in the Schools card above.
Census & demographics
- Census place
- Pecan Grove, TX
- County
- Fort Bend County · 836,777 people
- Metro
- Houston-The Woodlands-Sugar Land, TX
- Population (ZIP)
- 69,918
- Household income
- $141,869
- Rent vs Own
- Severe rent burden
- 575.0
Population outlook (Fort Bend County) Hauer SSP2
- Today (2025)
- 1,004,526 people
- By 2030
- 1,153,104 · +14.8%
- By 2040
- 1,453,718 · +44.7%
- By 2050
- 1,753,781 · +74.6%
- By 2075
- 2,455,772 · +144.5%
- By 2100
- 2,930,528 · +191.7%
Race, ethnicity, and origin ACS 2023
- Neighborhood character
- Highly diverse neighborhood (Simpson 0.72)
- Race & ethnicity
- White 43% Hispanic / Latino 26% Two or more races 15% Black 14% Asian 12%
- Hispanic origin (detail)
- Mexican 18% Puerto Rican 1%
- Common ancestry
- Lithuanian 2% Romanian 1% Iranian 1%
- Foreign-born
- 17% · Canada, Vietnam, China
- Languages at home
- 73% English-only · Spanish 14% Other Indo-European 3% Vietnamese 2%
Political lean MEDSL · Fort Bend
- 2024 margin
- Toss-up / Even · D 49.5% · R 47.9% · Other 2.6%
- 2008→2024 swing
- +4.0pp toward D · 2008: -2.4pp · 2024: 1.6pp
- All cycles
- 2024: D+1.6 2020: D+10.6 2016: D+6.6 2012: R+6.8 2008: R+2.4
Not yet ingested
- Civics
- —
Market trends
- HPI YoY
- ▼ -79.18%
- Current HPI
- 222.9525
- Rent YoY
- ▼ -1.61%
- Metro
- Houston-The Woodlands-Sugar Land, TX
- State GDP YoY
- ▲ 3.95%
- F500 in state
- 110
Industry mix (Fortune 500 HQ in TX)
| Industry | F500 HQs | Revenue |
|---|---|---|
| Energy | 16 | $1,198B |
|
||
| Technology | 5 | $198B |
|
||
| Engineering / Construction | 4 | $72B |
|
||
| Energy Services | 3 | $60B |
|
||
| Utilities | 3 | $41B |
|
||
| Healthcare | 2 | $330B |
|
||
Price history
-98.9% since first listed17 events — show timeline
- 2026-05-07 Listed for Rent $2,499 HARMLS
- 2026-04-09 Rental Removed $2,499 HARMLS
- 2026-03-20 Listed for Rent $2,499 HARMLS
- 2026-02-22 Listed $379,900 HARMLS
- 2024-11-19 Rental Removed $2,500 HARMLS
- 2024-10-30 Price Changed $2,500 HARMLS
- 2024-10-28 Listed for Rent $2,600 HARMLS
- 2019-12-10 Listing Removed — HARMLS
- 2019-11-26 Listed $249,900 HARMLS
- 2019-10-07 Sold (MLS) — HARMLS
- 2019-09-11 Pending — HARMLS
- 2019-08-29 Price Changed $200,640 HARMLS
- 2019-08-16 Relisted — HARMLS
- 2019-06-18 Pending — HARMLS
- 2019-06-01 Relisted — HARMLS
- 2019-05-07 Pending — HARMLS
- 2019-04-18 Listed $228,000 HARMLS
Property tax history
+3.5%/yrLatest (2025): $6,874 · -4.5% YoY. Source: county tax records.
Cash-flow waterfall
monthlySold comps — $/sqft
last 12 mo · ≤1 miLoading sold comps…