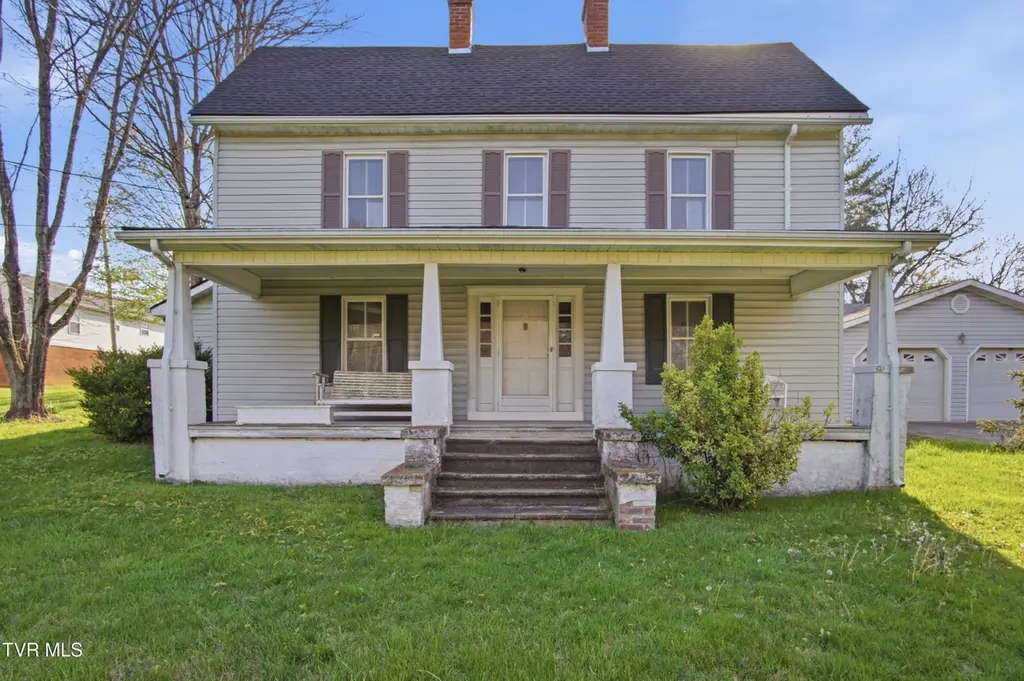
380 Oak Grove Rd · Oak Grove, TN
Flood risk 1/10 · Minimal
- FEMA flood zone
- X (unshaded)
- Chance of flooding over 30 yrs
- 0.0%
- Est. flood insurance / yr
- $507 – $1,088
Fire risk 3/10 · Minor
- Est. fire insurance / yr
- $949 – $1,763
Heat risk 4/10 · Minor
- Hot days now (above 99°F)
- 7 days/yr
- Hot days in 30 yrs
- 20 days/yr
Wind risk 2/10 · Minimal
- Chance of severe wind over 30 yrs
- —
Air-quality risk 2/10 · Minimal
- Unhealthy air days now
- 1 days/yr
- Unhealthy air days in 30 yrs
- 2 days/yr
Risk factors via First Street. Map © Google.
Why this score? — see what drove the C+ grade
The composite is a weighted blend of 9 inputs, each scored 0–100. Each bar is that input's sub-score; the figure is the points it added to the 100-point composite (weight × sub-score).
- Cash flow +25.5/30.0
- ARV discount +15.0/15.0
- DSCR +8.4/10.0
- 1% rule +5.7/10.0
- Livability +2.9/5.0
- Schools +2.6/10.0
- Condition / age +2.5/5.0
- Rent growth +2.3/5.0
- Appreciation +0.0/10.0
$239,900
🖨 Deal sheet 📄 Offer letter ✓ Due diligence
Listing remarks
Farmhouse in Gray with so much potential! This home was built in 1900 and is begging for someone to come along and make it home! This home has 4 bedrooms, 2.5 baths, a humongous attached garage, and a ton of character. The property is being split from the back lot, leaving over . 5 acre conveying with the house. The home was just recently put on city sewer. All information taken from seller, courthouse records, or third party sources and is deemed accurate but buyer/buyer's agent to verify.
Key facts
- 0.6 acre lot
- Built 1900
- Listed 55 days
Property features AI
Exterior
- Security: Security system
- Utilities: Public water; Septic tank sewer
- Home design: Residential single family house; Not in a subdivision
- Construction: Vinyl siding and plaster construction
- Exterior features: Composition roof; Outbuilding; Cleared, level and sloped yard
Interior
- Bathrooms: 2 full bathrooms; 1 half bathroom
- Heating & cooling: Heat pump; Electric heating; Wood stove heating; Has cooling; Has heating
- Interior features: Wood burning stove fireplace; Crawl space basement
Neighborhood map
What this means for you Summary
Snapshot
- This is a 4-bed/1.0-bath single-family listed at $240k.
Deal economics
- At list price, monthly cash flow is $560 ($7k/yr) — positive.
- The deal already cash-flows at list — no discount required.
- Meets the 1% rule at list price ($3k rent vs $240k).
- Recommended offer: $233k (3.0% below list) — sets the bar for market timing.
- Cap rate 9.1% vs local median 3.1% in Oak Grove — top-decile yield for the area; either an underpriced asset or a hidden risk that comps aren't pricing in. Stress-test before assuming the spread holds.
Location & tenants
- Location reads 58/100 on livability (#318 in TN) — a working-class tenant base; expect higher turnover. Strengths: cost of living A+, housing A; Watch: amenities F, commute F, employment D-.
- Washington County (suburban): math 26% / reading 34% proficiency, ranked #54 of 139 in TN (top 39%) — families likely to look elsewhere, expect single-tenant / working-renter base with shorter leases.
- Zoned schools: Boones Creek Elementary School (math 24% / reading 31%, grade F, #490 of 952 statewide, top 52%, 788 students, 0% FRL); Daniel Boone High School (math 23% / reading 46%, grade F, #41 of 332 statewide, top 15%, 1,211 students, 0% FRL) — zoned schools average 0% FRL vs 41% district-wide (41 pts lower); this property's tenant base skews higher-income than the district average.
- Market conditions: Rents soft (-0.6%/yr); 219 active listings in the ZIP; 2 comparable units currently listed for rent nearby; solid renter incomes; 1,155 units permitted in Washington County in 2024 (437 in 5+ unit buildings).
- This rent runs 40% of the median local income ($78k/yr) — at the standard rent-burdened threshold; future hikes will face affordability resistance.
Forward outlook
- Local home prices are declining (-3.0%/yr); year-one equity from $2k of loan paydown is wiped out by about $7k of value loss. Plan a longer hold.
- Washington County population projected at +9% by 2050 — modest demand growth; plan on rents tracking national, not racing it.
Negotiation context
- It's been on market 55 days — a 3% lower offer ($233k) is reasonable based on typical stale-listing flexibility.
- Current owner paid $125k; list at $240k implies a 92% gain — meaningful room to come down on a strong offer.
Risks & watch-outs
- Watch-outs: built in 1900 — expect roof / HVAC / electrical / plumbing capex.
Questions for the listing agent
- It's been on market 55 days. Have you received any prior offers? Is the seller open to a 3% concession, seller financing, or rate buy-down credit?
- Built in 1900 — when were the roof, HVAC, electrical panel, plumbing, and water heater last replaced?
- Is there a deadline driving the sale (1031 exchange, divorce, estate, relocation)? That informs how much negotiation room exists.
- Schools are F-rated, which usually means shorter tenancies and higher turnover. Who's the typical renter profile here, and what's been the actual vacancy rate?
- What's the average days-on-market for RENTAL listings here right now (not sales)? A rising rental-DOM trend means longer vacancies and softer asking-rent achievability than the comps imply.
- What's the recent tenant-quality profile in this submarket — average credit score on applications, eviction rate, late-payment / NSF rate, and stable-employment percentage? A property-management company in the area should have these aggregated.
- How much new for-sale + rental construction is in the pipeline within 1–3 miles? Heavy new supply typically softens prices + rents 12–24 months out; constrained supply supports both.
Investment metrics
- 1% rule
- 1.07% ✓
- Cap rate
- 9.09%
- Cash-on-cash
- 10.00%
- DSCR
- 1.44
- GRM
- 7.8
CMA / ARV
- ARV (on-the-fly)
- $444,332
- Comps found
- 6
Show comp detail 6 sales within ~0.75 mi
| Address | Dist | Beds/Ba | Sqft | Sold | Price | $/sf | Match |
|---|---|---|---|---|---|---|---|
| 16 Coy Ct | 0.45mi | 4/2.5 | 2,301 (+2%) | 10mo | $450,000 | $196 | 62 |
| 120 Rockingham Meadows Dr | 0.51mi | 4/2.5 | 2,294 (+1%) | 14mo | $450,000 | $196 | 57 |
| 380 Jessicas Way Way | 0.56mi | 3/2.5 (-1) | 2,163 (-5%) | 7mo | $420,000 | $194 | 50 |
| 238 Jessicas Way | 0.43mi | 4/2.5 | 2,418 (+7%) | 23mo | $450,000 | $186 | 43 |
| 319 Wiltshire Dr | 0.72mi | 3/2.5 (-1) | 2,332 (+3%) | 11mo | $477,000 | $205 | 41 |
| 180 Rockingham Meadows Dr | 0.56mi | 3/3.0 (-1) | 2,501 (+10%) | 23mo | $540,000 | $216 | 24 |
Match score weights: distance 35% · size 25% · config 20% · recency 20%. Top-matched comps best support the ARV.
Projected returns pro-forma
-3.0% appreciation · 0.0% rent growth · sell at horizon
- IRR
- -4.4%
- Equity multiple
- 0.84×
- Total profit
- $-10,823
- Equity at exit
- $35,770
- IRR
- 1.7%
- Equity multiple
- 1.11×
- Total profit
- $7,116
- Equity at exit
- $20,742
Cash invested: $67,172 (down + closing). Projections, not guarantees.
Landlord ↔ Tenant lean methodology
- Overall (STATE)
- 87 Strongly Landlord-Friendly
- State Tennessee
- 87 Strongly Landlord-Friendly · R+13
- County
- — inherits STATE
- City
- — inherits STATE
ZIP-level market 37615
- Home prices YoY
- -19.2%
- Rents YoY
- -0.6%
- Active inventory
- 219
- Price-to-rent
- 7.8×
Monthly cashflow live
- Estimated rent
- $2,564 medium interval (Pro) →
- Mortgage (P&I)
- −$1,258
- Tax from tax record
- −$108 /mo · $1,291/yr
- Insurance
- −$100
- HOA
- −$0
- Vacancy / Maint / Mgmt
- −$538
- Net cashflow
- $560
Break-even live
UW: 25.0% down · 7.5% · 30yr · 1.5% tax · 5.0% vac · 8.0% maint · 8.0% mgmt
Financing live
Cash to close
- Down payment
- $59,975
- Closing costs
- $7,197
- Reserves months
- —
- Total cash needed
- —
Loan-product check · same deal, 3 products live
Conventional
25% down · 7.5% · 30yr
- Down + closing
- —
- Monthly P&I
- —
- Monthly cashflow
- —
- DSCR
- —
- Eligible?
- —
Personal DTI + credit; lowest rate.
DSCR
20% down · 8.5% · 30yr
- Down + closing
- —
- Monthly P&I
- —
- Monthly cashflow
- —
- DSCR
- —
- Eligible?
- —
No personal income docs; deal must DSCR.
Hard money
10% down · 12.0% · 12mo
- Down + closing
- —
- Monthly P&I
- —
- Monthly cashflow
- —
- DSCR
- —
- Eligible?
- —
Short-term bridge; refi at stabilization.
Rent comps 2 comps
| Address | Beds | Baths | Sqft | Rent | $/sqft | DOM | Units | Dist |
|---|---|---|---|---|---|---|---|---|
| 205 Rockingham Meadows Dr Johnson City, TN | 3.0 | 2.0 | 1749 | $2,500 | $1.43 | 20d | 1 | 0.58mi |
| 304 Old Stage Rd Johnson City, TN | 3.0 | 3.0 | 2100 | $2,450 | $1.17 | 13d | 1 | 0.93mi |
Listing history 18 events
-
2026-06-15statusdays on market $239,900 Pending 55 DOM
-
2026-06-14days on market $239,900 Active 54 DOM
-
2026-06-13remarks 495-char remark
-
2026-06-13days on market $239,900 Active 53 DOM
-
2026-06-02days on market $239,900 Active 50 DOM
-
2026-06-01days on market $239,900 Active 49 DOM
-
2026-05-31days on market $239,900 Active 48 DOM
-
2026-05-30days on market $239,900 Active 47 DOM
-
2026-04-10$239,900 Active
-
2026-02-19soldstatus $125,000
-
2025-11-03price $199,000
-
2025-09-08price $210,000
-
2025-08-20price $230,000
-
2025-07-11price $250,000
-
2025-06-19price $285,000
-
2025-05-30price $305,900
-
2025-05-27price $347,500
-
1993-07-01soldstatus $45,000
ⓘ Source: listings_history table (triggers on properties + properties_extension) + one-shot
backfill from property_details.listing_events for pre-trigger history.
Tax reassessment forecast TN · Resets to sale price
- Current annual tax
- $1,291 · $108/mo
- Projected year-2 tax
- $1,703 · $142/mo
- Expected delta
- +$412/yr (+$34/mo · 31.9%)
ⓘ Screening estimate from a state-policy table — verify with the county assessor before closing.
Climate risk First Street
- Flood 1/10 Low FEMA zone X (unshaded) · 0% chance over 30 yrs
- Wildfire 3/10 Moderate
- Heat 4/10 Moderate 7 d/yr ≥99°F today · 20 d/yr by 30 yrs out
- Wind 2/10 Low
- Air quality 2/10 Low 1 unhealthy d/yr today · 2 by 30 yrs out
Nearby sold comps map
Loading sold comps map…
Walkable amenities ~0.75 mi
Loading nearby amenities…
Taxation est. · year 1
- Rental income
- $30,763
- − Mortgage interest
- −$13,438
- − Property taxes
- −$1,291
- − Insurance
- −$1,200
- − Repairs & maintenance
- −$2,461
- − Management
- −$2,461
- − Depreciation
- −$6,979
- Taxable income
- $2,934
- Est. tax owed @ 24.0%
- −$704
- After-tax cash flow
- $6,012/yr
For passive investors: Depreciation is non-cash, so a rental often shows a tax loss while cash-flowing — sheltering income. Rental losses are passive: they offset passive income freely, and up to $25,000/yr can offset ordinary (W-2) income if you actively participate and your MAGI is under $100k (phasing out to $0 by $150k); unused losses carry forward. On sale, claimed depreciation is recaptured at up to 25%, and gains may owe capital-gains tax (a 1031 exchange can defer both). Figures are a year-1 estimate at your 24.0% rate — not tax advice; consult a CPA.
Schools (NCES district)
- District
- Washington County
- NCES district ID
- 4704380
- Math proficiency
- 26% ▼ -21.00%
- Reading proficiency
- 34% ▼ -11.00%
- Median HH income
- $46,542
- Composite
- 25.85/100
- National rank
- #7350
- State rank
- #54 of 139 in TN
Livability — Oak Grove
- Score
- 58/100
- State rank
- #318
- US rank
- #21531
Category grades
Schools grade is shown separately in the Schools card above.
Census & demographics
- Census place
- Oak Grove, TN
- County
- Washington County · 129,006 people
- Metro
- Johnson City, TN
- Population (ZIP)
- 22,821
- Household income
- $77,525
- Rent vs Own
- Severe rent burden
- 278.0
Population outlook (Washington County) Hauer SSP2
- Today (2025)
- 132,816 people
- By 2030
- 135,823 · +2.3%
- By 2040
- 140,897 · +6.1%
- By 2050
- 145,073 · +9.2%
- By 2075
- 156,386 · +17.7%
- By 2100
- 159,893 · +20.4%
Race, ethnicity, and origin ACS 2023
- Neighborhood character
- Predominantly White (90%)
- Race & ethnicity
- White 90% Two or more races 5% Hispanic / Latino 4% Asian 1% Black 1%
- Common ancestry
- Slovak 4% Italian 3% Serbian 2%
- Foreign-born
- 2% · Canada, China
- Languages at home
- 97% English-only · Spanish 3%
Political lean MEDSL · Washington
- 2024 margin
- Solid R (+39.5) · D 29.6% · R 69.1% · Other 1.3%
- 2008→2024 swing
- -6.0pp toward R · 2008: -33.5pp · 2024: -39.5pp
- All cycles
- 2024: R+39.5 2020: R+36.2 2016: R+42.9 2012: R+38.5 2008: R+33.5
Not yet ingested
- Civics
- —
Market trends
- HPI YoY
- ▼ -66.47%
- Current HPI
- 279.1199
- Rent YoY
- ▼ -0.63%
- Metro
- Johnson City, TN
- State GDP YoY
- ▲ 2.78%
- F500 in state
- 22
Industry mix (Fortune 500 HQ in TN)
| Industry | F500 HQs | Revenue |
|---|---|---|
| Healthcare | 3 | $91B |
|
||
| Retail | 3 | $72B |
|
||
| Transportation / Logistics | 1 | $88B |
|
||
| Paper / Packaging | 1 | $19B |
|
||
| Insurance | 1 | $13B |
|
||
| Energy | 1 | $12B |
|
||
Price history
+433.1% since first listed10 events — show timeline
- 2026-04-10 Listed $239,900 TVRMLS
- 2026-02-19 Sold (Public Records) $125,000 Public Records
- 2025-11-03 Price Changed $199,000 TVRMLS
- 2025-09-08 Price Changed $210,000 TVRMLS
- 2025-08-20 Price Changed $230,000 TVRMLS
- 2025-07-11 Price Changed $250,000 TVRMLS
- 2025-06-19 Price Changed $285,000 TVRMLS
- 2025-05-30 Price Changed $305,900 TVRMLS
- 2025-05-27 Price Changed $347,500 TVRMLS
- 1993-07-01 Sold (Public Records) $45,000 Public Records
Property tax history
+7.9%/yrLatest (2025): $1,291 · +0.0% YoY. Source: county tax records.
Cash-flow waterfall
monthlySold comps — $/sqft
last 12 mo · ≤1 miLoading sold comps…