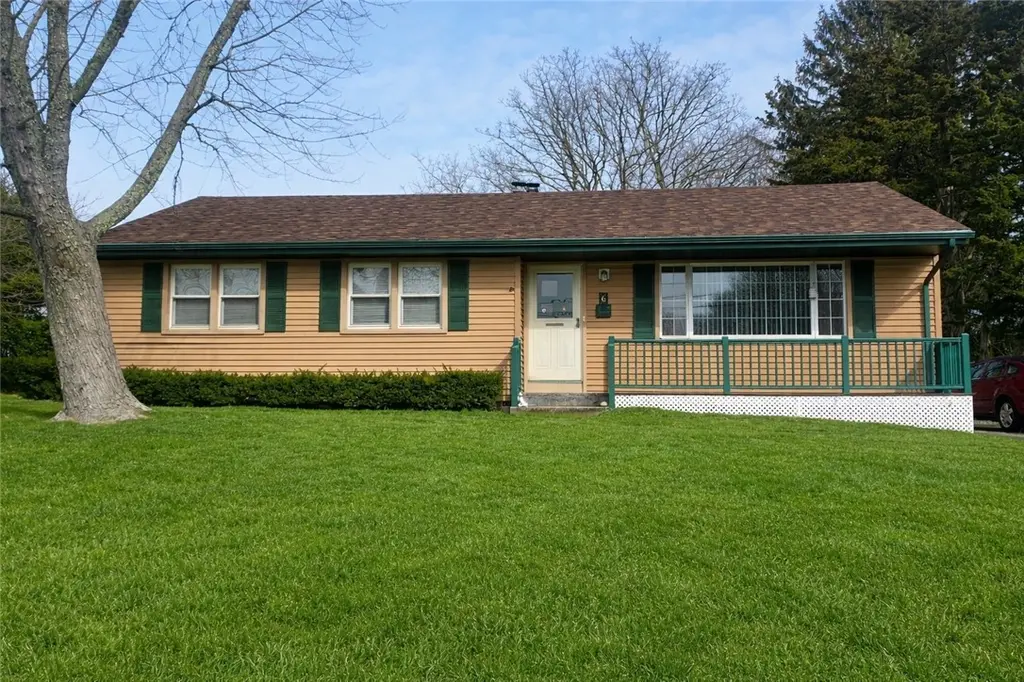
6 Wilder Ave · Westerly, RI
Flood risk No data
- FEMA flood zone
- —
- Chance of flooding over 30 yrs
- —
- Est. flood insurance / yr
- —
Fire risk No data
- Est. fire insurance / yr
- —
Heat risk No data
- Hot days now (above threshold)
- —
- Hot days in 30 yrs
- —
Wind risk No data
- Chance of severe wind over 30 yrs
- —
Air-quality risk No data
- Unhealthy air days now
- —
- Unhealthy air days in 30 yrs
- —
Risk factors via First Street. Map © Google.
Why this score? — see what drove the C+ grade
The composite is a weighted blend of 9 inputs, each scored 0–100. Each bar is that input's sub-score; the figure is the points it added to the 100-point composite (weight × sub-score).
- Cash flow +25.5/30.0
- DSCR +8.4/10.0
- ARV discount +7.5/15.0
- 1% rule +6.1/10.0
- Rent growth +5.0/5.0
- Livability +3.7/5.0
- Schools +2.6/10.0
- Condition / age +2.5/5.0
- Appreciation +0.0/10.0
$300,000
🖨 Deal sheet 📄 Offer letter ✓ Due diligence
Listing remarks
NO DISCLOSURES, ESTATE Sale. Price reduction to factor in the septic replacement, foundation issues and pool repair, etc. ESTATE SALE - SOLD "AS IS" "A diamond in the rough. " * * * * * * * * * * * * * * * * * * * * * * * * * * * * * * * * * * * * * * * * * * * * * * * * * The buyer responsible for any upgrades or repairs. This could be a lovely ranch in a great location, offering a 4 bedrooms, 2 bath, 1,696 sqft, on a spacious 0.37-acre lot, maintained and cared for by one of the original owners, the house was built in 1955. This home offers 1,696 sf of finished space and a potential in-law, with town approval, it
Key facts
- 0.37 acre lot
- 4 parking spots
- Pool
Property features AI
Finance
- HOA & community: Community amenities include golf, marina, pool, tennis courts, shopping, highway access, near hospital and schools
Exterior
- Parking: No garage; 4 total parking spaces
- Utilities: Electric service: 200+ amps; Sewer: cesspool; Water: connected
- Home design: Single-story home; Vinyl siding; Combination foundation; Entry level: 1
- Construction: Vinyl siding construction; Combination foundation; Built with 1 story
- Exterior features: Breezeway; Patio; Outbuilding; In-ground pool
Interior
- Kitchen: Dishwasher; Microwave; Refrigerator; Electric water heater
- Flooring: Hardwood; Laminate
- Bathrooms: 2 full bathrooms
- Heating & cooling: Forced air heating (oil); Ductless cooling
- Interior features: Cable TV
- Laundry & utility: Washer; Dryer
Neighborhood map
What this means for you Summary
Snapshot
- This is a 4-bed/2.0-bath single-family listed at $300k.
Deal economics
- At list price, monthly cash flow is $697 ($8k/yr) — positive.
- The deal already cash-flows at list — no discount required.
- Meets the 1% rule at list price ($3k rent vs $300k).
- Cap rate 9.1% vs local median 1.8% in Westerly — top-decile yield for the area; either an underpriced asset or a hidden risk that comps aren't pricing in. Stress-test before assuming the spread holds.
Location & tenants
- Location reads 74/100 on livability (#10 in RI, #4,529 nationally) — a middle-class / working-renter tenant base. Strengths: crime A+, housing A+, health & safety A+; Watch: cost of living D+, amenities F, commute F.
- Westerly (suburban): math 19% / reading 39% proficiency, ranked #21 of 39 in RI (top 54%) — low school quality limits family demand, transient renter base, plan for 1-2y turnover.
- Market conditions: Rents rising fast (+11.7%/yr); 110 active listings in the ZIP; 3 comparable units currently listed for rent nearby; rentals leasing fast (median 11d on market — plan ~1-2 weeks tenant-placement turnaround); solid renter incomes; 311 units permitted in Washington County in 2024 (45 in 5+ unit buildings).
- This rent runs 41% of the median local income ($97k/yr) — at the standard rent-burdened threshold; future hikes will face affordability resistance.
Forward outlook
- Local home prices are declining (-3.0%/yr); year-one equity from $2k of loan paydown is wiped out by about $9k of value loss. Plan a longer hold.
- Washington County population projected at -14% by 2050 — secular population decline; favor cash flow + early exit over multi-decade hold.
- At projected returns (-3.0% appreciation + 8.0% rent growth), your $84k cash investment doubles in ~8 years — after that, you're playing with house money.
Negotiation context
- Only 4 days on market — expect competitive offers; lowballing is unlikely to land.
- 3 sale attempts with the ask held roughly flat each time — persistent listings suggest the price (not the market) is what's stuck; bring a comps-based counter.
Risks & watch-outs
- Watch-outs: built in 1955 — expect roof / HVAC / electrical / plumbing capex.
Questions for the listing agent
- Built in 1955 — when were the roof, HVAC, electrical panel, plumbing, and water heater last replaced?
- Is there a deadline driving the sale (1031 exchange, divorce, estate, relocation)? That informs how much negotiation room exists.
- What's the average days-on-market for RENTAL listings here right now (not sales)? A rising rental-DOM trend means longer vacancies and softer asking-rent achievability than the comps imply.
- What's the recent tenant-quality profile in this submarket — average credit score on applications, eviction rate, late-payment / NSF rate, and stable-employment percentage? A property-management company in the area should have these aggregated.
- How much new for-sale + rental construction is in the pipeline within 1–3 miles? Heavy new supply typically softens prices + rents 12–24 months out; constrained supply supports both.
Investment metrics
- 1% rule
- 1.11% ✓
- Cap rate
- 9.08%
- Cash-on-cash
- 9.95%
- DSCR
- 1.44
- GRM
- 7.5
CMA / ARV
- ARV (median comp)
- $626,590
- List price
- $300,000
- Delta
- -52.12%
- Verdict
- UNDERPRICED
- Comps
- 20 within 1.0 mi
Show comp detail 1 sale within ~0.75 mi
| Address | Dist | Beds/Ba | Sqft | Sold | Price | $/sf | Match |
|---|---|---|---|---|---|---|---|
| 12 Brown Dr | 0.69mi | 3/3.5 (-1) | 1,749 (+3%) | 22mo | $725,000 | $415 | 34 |
Match score weights: distance 35% · size 25% · config 20% · recency 20%. Top-matched comps best support the ARV.
Projected returns pro-forma
-3.0% appreciation · 8.0% rent growth · sell at horizon
- IRR
- 3.9%
- Equity multiple
- 1.16×
- Total profit
- $13,400
- Equity at exit
- $44,731
- IRR
- 17.5%
- Equity multiple
- 2.78×
- Total profit
- $149,125
- Equity at exit
- $25,939
Cash invested: $84,000 (down + closing). Projections, not guarantees.
Landlord ↔ Tenant lean methodology
- Overall (STATE)
- 31 Tenant-Leaning
- State Rhode Island
- 31 Tenant-Leaning · D+8
- County
- — inherits STATE
- City
- — inherits STATE
ZIP-level market 02891
- Home prices YoY
- -28.2%
- Rents YoY
- 11.7%
- Active inventory
- 110
- Price-to-rent
- 7.5×
Monthly cashflow live
- Estimated rent
- $3,344 medium interval (Pro) →
- Mortgage (P&I)
- −$1,573
- Tax from tax record
- −$247 /mo · $2,966/yr
- Insurance
- −$125
- HOA
- −$0
- Vacancy / Maint / Mgmt
- −$702
- Net cashflow
- $697
Break-even live
UW: 25.0% down · 7.5% · 30yr · 1.5% tax · 5.0% vac · 8.0% maint · 8.0% mgmt
Financing live
Cash to close
- Down payment
- $75,000
- Closing costs
- $9,000
- Reserves months
- —
- Total cash needed
- —
Loan-product check · same deal, 3 products live
Conventional
25% down · 7.5% · 30yr
- Down + closing
- —
- Monthly P&I
- —
- Monthly cashflow
- —
- DSCR
- —
- Eligible?
- —
Personal DTI + credit; lowest rate.
DSCR
20% down · 8.5% · 30yr
- Down + closing
- —
- Monthly P&I
- —
- Monthly cashflow
- —
- DSCR
- —
- Eligible?
- —
No personal income docs; deal must DSCR.
Hard money
10% down · 12.0% · 12mo
- Down + closing
- —
- Monthly P&I
- —
- Monthly cashflow
- —
- DSCR
- —
- Eligible?
- —
Short-term bridge; refi at stabilization.
Rent comps 3 comps
| Address | Beds | Baths | Sqft | Rent | $/sqft | DOM | Units | Dist |
|---|---|---|---|---|---|---|---|---|
| 60 Sherwood Dr Unit 1 Westerly, RI | 3.0 | 2.5 | 2144 | $3,750 | $1.75 | 23d | 1 | 0.84mi |
| 9 Woodlund Ave Westerly, RI | 3.0 | 1.0 | 1347 | $3,200 | $2.38 | 11d | 1 | 1.24mi |
| 9 Woodlund Ave Westerly, RI | 3.0 | 1.0 | 1347 | $3,200 | $2.38 | 1d | 1 | 1.24mi |
Listing history 9 events
-
2026-05-05status Pending 1583-char remark
-
2026-05-05historical Active Under Contract 1583-char remark
-
2026-05-01$300,000 Active 1583-char remark
-
2026-04-23status Pending
-
2026-04-23historical
-
2026-04-17price $449,900
-
2026-04-02$499,900 Active
-
2026-04-02historical
-
2026-03-25$539,900 Active
ⓘ Source: listings_history table (triggers on properties + properties_extension) + one-shot
backfill from property_details.listing_events for pre-trigger history.
Tax reassessment forecast RI · Partial reset (capped growth)
- Current annual tax
- $2,966 · $247/mo
- Projected year-2 tax
- $3,928 · $327/mo
- Expected delta
- +$962/yr (+$80/mo · 32.4%)
ⓘ Screening estimate from a state-policy table — verify with the county assessor before closing.
Nearby sold comps map
Loading sold comps map…
Walkable amenities ~0.75 mi
Loading nearby amenities…
Taxation est. · year 1
- Rental income
- $40,132
- − Mortgage interest
- −$16,805
- − Property taxes
- −$2,966
- − Insurance
- −$1,500
- − Repairs & maintenance
- −$3,211
- − Management
- −$3,211
- − Depreciation
- −$8,727
- Taxable income
- $3,713
- Est. tax owed @ 24.0%
- −$891
- After-tax cash flow
- $7,468/yr
For passive investors: Depreciation is non-cash, so a rental often shows a tax loss while cash-flowing — sheltering income. Rental losses are passive: they offset passive income freely, and up to $25,000/yr can offset ordinary (W-2) income if you actively participate and your MAGI is under $100k (phasing out to $0 by $150k); unused losses carry forward. On sale, claimed depreciation is recaptured at up to 25%, and gains may owe capital-gains tax (a 1031 exchange can defer both). Figures are a year-1 estimate at your 24.0% rate — not tax advice; consult a CPA.
Schools (NCES district)
- District
- Westerly
- NCES district ID
- 4401170
- Math proficiency
- 19% ▼ -19.00%
- Reading proficiency
- 39% ▼ -13.00%
- Median HH income
- $60,021
- Composite
- 26.25/100
- National rank
- #7257
- State rank
- #21 of 39 in RI
Livability — Westerly
- Score
- 74/100
- State rank
- #10
- US rank
- #4529
Category grades
Schools grade is shown separately in the Schools card above.
Census & demographics
- Census place
- Westerly, RI
- County
- Washington County · 79,886 people
- City population
- 21,587
- Metro
- Providence-Warwick, RI-MA
- Population (ZIP)
- 21,587
- Household income
- $97,110
- Rent vs Own
- Severe rent burden
- 577.0
Population outlook (Washington County) Hauer SSP2
- Today (2025)
- 123,856 people
- By 2030
- 121,962 · -1.5%
- By 2040
- 115,902 · -6.4%
- By 2050
- 107,078 · -13.5%
- By 2075
- 92,575 · -25.3%
- By 2100
- 77,407 · -37.5%
Race, ethnicity, and origin ACS 2023
- Neighborhood character
- Predominantly White (90%)
- Race & ethnicity
- White 90% Two or more races 4% Hispanic / Latino 3% Asian 3%
- Common ancestry
- Lithuanian 5% Romanian 3% Slovak 3%
- Foreign-born
- 5% · Canada, China
- Languages at home
- 92% English-only · Spanish 2% Chinese 2% Other Indo-European 1%
Political lean MEDSL · Washington
- 2024 margin
- D (+15.0) · D 56.4% · R 41.4% · Other 2.3%
- 2008→2024 swing
- -24.3pp toward R · 2008: 39.3pp · 2024: 15.0pp
- All cycles
- 2024: D+15.0 2020: D+19.4 2016: D+10.0 2012: D+16.8 2008: D+39.3
Not yet ingested
- Civics
- —
Market trends
- HPI YoY
- ▼ -145.15%
- Current HPI
- 369.8844
- Rent YoY
- ▲ 11.73%
- Metro
- Providence-Warwick, RI-MA
- State GDP YoY
- ▲ 2.25%
- F500 in state
- 10
Industry mix (Fortune 500 HQ in RI)
| Industry | F500 HQs | Revenue |
|---|---|---|
| Healthcare | 1 | $373B |
|
||
| Food Distribution | 1 | $31B |
|
||
| Aerospace / Defense | 1 | $14B |
|
||
| Financial Services | 1 | $8B |
|
||
| Consumer Goods | 1 | $4B |
|
||
Price history
-44.4% since first listed9 events — show timeline
- 2026-05-05 Pending — RIS
- 2026-05-05 Contingent — RIS
- 2026-05-01 Listed $300,000 RIS
- 2026-04-23 Pending — RIS
- 2026-04-23 Listing Removed — RIS
- 2026-04-17 Price Changed $449,900 RIS
- 2026-04-02 Listing Removed — RIS
- 2026-04-02 Listed $499,900 RIS
- 2026-03-25 Listed $539,900 RIS
Property tax history
+1.2%/yrLatest (2025): $2,966 · -4.6% YoY. Source: county tax records.
Cash-flow waterfall
monthlySold comps — $/sqft
last 12 mo · ≤1 miLoading sold comps…