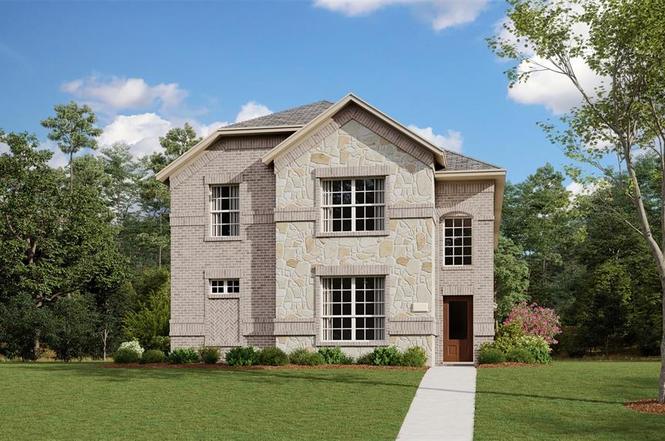
2804 Serenity Grove Ln · Fort Worth, TX
Flood risk 1/10 · Minimal
- FEMA flood zone
- X (unshaded)
- Chance of flooding over 30 yrs
- 0.0%
- Est. flood insurance / yr
- $507 – $1,088
Fire risk 5/10 · Moderate
- Est. fire insurance / yr
- $1,222 – $2,270
Heat risk 7/10 · Major
- Hot days now (above 109°F)
- 7 days/yr
- Hot days in 30 yrs
- 22 days/yr
Wind risk 6/10 · Moderate
- Chance of severe wind over 30 yrs
- 27.0%
Air-quality risk 2/10 · Minimal
- Unhealthy air days now
- 1 days/yr
- Unhealthy air days in 30 yrs
- 2 days/yr
Risk factors via First Street. Map © Google.
Why this score? — see what drove the D- grade
The composite is a weighted blend of 9 inputs, each scored 0–100. Each bar is that input's sub-score; the figure is the points it added to the 100-point composite (weight × sub-score).
- Cash flow +12.6/30.0
- ARV discount +7.5/15.0
- Livability +4.0/5.0
- DSCR +3.8/10.0
- Schools +3.5/10.0
- Rent growth +2.9/5.0
- 1% rule +2.5/10.0
- Condition / age +2.5/5.0
- Appreciation +0.0/10.0
$353,999
🖨 Deal sheet (PDF) 📄 Offer letter ✓ Due diligence
Listing remarks
LENNAR - Northpointe - Beaumont Floorplan - This two-story home has a layout that is perfect for busy families who need space. On the first floor is an open concept living area which includes a living room, kitchen and dining room with a covered patio in the back. The owner’s suite is at the front of the home with a private bathroom and spacious walk-in closet. Upstairs are three bedrooms, two bathrooms and a versatile game room, perfect for kids and teenagers. Prices, dimensions and features may vary and are subject to change. Photos are for illustrative purposes only.
Key facts
- Covered patio
- Private bathroom
- Versatile game room
Tags
Neighborhood map
What this means for you Summary
Snapshot
- This is a 4-bed/3.5-bath other listed at $354k.
Deal economics
- At list price, monthly cash flow is $-44 ($-534/yr) — negative.
- To cash-flow at today's rent, offer at most $346k (2.2% below list).
- To meet the 1% rule (rent ≥ 1% of price), the offer needs to be $267k (24.6% below list).
- Recommended offer: $267k (24.6% below list) — sets the bar for 1% rule.
- Cap rate 6.1% vs local median 3.9% in Fort Worth — top-decile yield for the area; either an underpriced asset or a hidden risk that comps aren't pricing in. Stress-test before assuming the spread holds.
Location & tenants
- Location reads 80/100 on livability (#49 in TX, #1,954 nationally) — a professional / high-income tenant draw. Strengths: amenities A+, cost of living A+, housing A+; Watch: crime F.
- Eagle Mt-Saginaw ISD (urban): math 35% / reading 42% proficiency, ranked #361 of 826 in TX (top 44%) — families likely to look elsewhere, expect single-tenant / working-renter base with shorter leases.
- Zoned schools: Lake Pointe El (math 49% / reading 49%, grade D, #926 of 4,322 statewide, top 22%, 669 students, 44% FRL); Wayside Middle (math 42% / reading 42%, grade D-, #572 of 1,662 statewide, top 36%, 1,077 students, 39% FRL); Boswell H S (math 49% / reading 62%, grade C, #364 of 1,632 statewide, top 23%, 2,547 students, 37% FRL) — zoned schools at 40% FRL track the district average.
- Market conditions: Rents rising (+1.5%/yr); 1074 active listings in the ZIP; 33 comparable units currently listed for rent nearby; rentals at typical pace (median 23d on market — plan ~3-4 weeks tenant-placement turnaround); solid renter incomes; 18,938 units permitted in Tarrant County in 2024 (8,336 in 5+ unit buildings).
Forward outlook
- Local home prices are declining (-3.0%/yr); year-one equity from $2k of loan paydown is wiped out by about $11k of value loss. Plan a longer hold.
- Tarrant County population projected at +41% by 2050 — long-run rental-demand tailwind backs the buy-and-hold thesis.
Negotiation context
- It's been on market 60 days — a 3% lower offer ($343k) is reasonable based on typical stale-listing flexibility.
- 2 sale attempts with the ask held roughly flat each time — persistent listings suggest the price (not the market) is what's stuck; bring a comps-based counter.
Risks & watch-outs
- Climate carrying-cost: major wind risk, 27% chance of damaging wind over 30y; moderate wildfire risk; extreme-heat days projected 7→22/yr by 2055 (HVAC capex compounding) — expect insurance premiums to compound above CPI over the hold.
Questions for the listing agent
- What do current leases actually rent for vs. the listed asking? Can we see a recent rent roll and the last 12 months of T-12 income?
- It's been on market 60 days. Have you received any prior offers? Is the seller open to a 25% concession, seller financing, or rate buy-down credit?
- What does the HOA fee cover, when was the last increase, and are there any pending special assessments or reserve-fund shortfalls?
- Is there a deadline driving the sale (1031 exchange, divorce, estate, relocation)? That informs how much negotiation room exists.
- Schools are D-rated, which usually means shorter tenancies and higher turnover. Who's the typical renter profile here, and what's been the actual vacancy rate?
- Crime grade is F in this area — have there been break-ins, vandalism, or insurance claims at this property in the last 3 years? What carrier currently insures it and at what premium?
- The area grade is low — what's the realistic commute time and amenity access for the typical tenant pool here? Any planned neighborhood developments (good or bad) we should know about?
- What's the average days-on-market for RENTAL listings here right now (not sales)? A rising rental-DOM trend means longer vacancies and softer asking-rent achievability than the comps imply.
- What's the recent tenant-quality profile in this submarket — average credit score on applications, eviction rate, late-payment / NSF rate, and stable-employment percentage? A property-management company in the area should have these aggregated.
- How much new for-sale + rental construction is in the pipeline within 1–3 miles? Heavy new supply typically softens prices + rents 12–24 months out; constrained supply supports both.
Investment metrics
- 1% rule
- 0.75% ✗
- Cap rate
- 6.14%
- Cash-on-cash
- -0.54%
- DSCR
- 0.98
- GRM
- 11.1
CMA / ARV
No comps found within radius.
Projected returns pro-forma
-3.0% appreciation · 1.51% rent growth · sell at horizon
- IRR
- -18.7%
- Equity multiple
- 0.35×
- Total profit
- $-64,279
- Equity at exit
- $52,782
- IRR
- -14.1%
- Equity multiple
- 0.23×
- Total profit
- $-75,891
- Equity at exit
- $30,607
Cash invested: $99,120 (down + closing). Projections, not guarantees.
Landlord ↔ Tenant lean methodology
- Overall (STATE)
- 87 Strongly Landlord-Friendly
- State Texas
- 87 Strongly Landlord-Friendly · R+5
- County
- — inherits STATE
- City
- — inherits STATE
ZIP-level market 76179
- Rents YoY
- 1.5%
- Active inventory
- 1074
- Price-to-rent
- 11.1×
Monthly cashflow live
- Estimated rent
- $2,669 high interval (Pro) →
- Mortgage (P&I)
- −$1,856
- Tax from tax record
- −$97 /mo · $1,166/yr
- Insurance
- −$147
- HOA
- −$52
- Vacancy / Maint / Mgmt
- −$561
- Net cashflow
- $-44
Break-even live
Sensitivity live
| Price | -10% $156 | -5% $56 | +0% $-44 | +5% $-145 | +10% $-245 |
|---|---|---|---|---|---|
| Rent | -10% $-255 | -5% $-150 | +0% $-44 | +5% $61 | +10% $166 |
| Rate | -1.0pp $134 | -0.5pp $46 | base $-44 | +0.5pp $-136 | +1.0pp $-230 |
UW: 25.0% down · 7.5% · 30yr · 1.5% tax · 5.0% vac · 8.0% maint · 8.0% mgmt
Financing live
Cash to close
- Down payment
- $88,500
- Closing costs
- $10,620
- Reserves months
- —
- Total cash needed
- —
Loan-product check · same deal, 3 products live
Conventional
25% down · 7.5% · 30yr
- Down + closing
- —
- Monthly P&I
- —
- Monthly cashflow
- —
- DSCR
- —
- Eligible?
- —
Personal DTI + credit; lowest rate.
DSCR
20% down · 8.5% · 30yr
- Down + closing
- —
- Monthly P&I
- —
- Monthly cashflow
- —
- DSCR
- —
- Eligible?
- —
No personal income docs; deal must DSCR.
Hard money
10% down · 12.0% · 12mo
- Down + closing
- —
- Monthly P&I
- —
- Monthly cashflow
- —
- DSCR
- —
- Eligible?
- —
Short-term bridge; refi at stabilization.
Rent comps 33 comps
| Address | Beds | Baths | Sqft | Rent | $/sqft | DOM | Units | Dist |
|---|---|---|---|---|---|---|---|---|
| 10212 Regal Bend Ln Saginaw, TX | 4.0 | 2.0 | 1867 | $2,395 | $1.28 | 19d | 1 | 0.09mi |
| 10021 Elkhorn Dr Fort Worth, TX | 4.0 | 3.0 | 2238 | $2,595 | $1.16 | 1d | 1 | 0.39mi |
| 10021 Elkhorn Dr Fort Worth, TX | 4.0 | 3.0 | 2238 | $2,595 | $1.16 | 5d | 1 | 0.39mi |
| 2528 Northcote Dr Fort Worth, TX | 3.0 | 2.5 | 2277 | $2,306 | $1.01 | 1d | 1 | 0.44mi |
| 2600 Starwater Dr Fort Worth, TX | 4.0 | 3.5 | 3111 | $3,045 | $0.98 | 5d | 1 | 0.47mi |
| 9925 Little Tree Ln Fort Worth, TX | 3.0 | 2.5 | 2081 | $2,600 | $1.25 | 26d | 1 | 0.48mi |
| 2521 Birchcrest Dr Fort Worth, TX | 4.0 | 3.0 | 2371 | $2,795 | $1.18 | 26d | 1 | 0.53mi |
| 2633 Oneida Ln Fort Worth, TX | 4.0 | 3.0 | 2059 | $2,850 | $1.38 | 1d | 1 | 0.63mi |
| 2633 Oneida Ln Fort Worth, TX | 4.0 | 3.0 | 2059 | $2,850 | $1.38 | 26d | 1 | 0.63mi |
| 2521 Bunkerton Dr Fort Worth, TX | 4.0 | 2.0 | 1674 | $2,450 | $1.46 | 26d | 1 | 0.65mi |
| 2500 Bunkerton Dr Fort Worth, TX | 4.0 | 2.0 | 1674 | $1,909 | $1.14 | 26d | 1 | 0.65mi |
| 2644 Oneida Ln Fort Worth, TX | 4.0 | 3.0 | 2260 | $2,800 | $1.24 | 19d | 1 | 0.67mi |
| 10617 Kono Trl Fort Worth, TX | 4.0 | 2.0 | 1800 | $2,500 | $1.39 | 26d | 1 | 0.68mi |
| 10616 Kono Trl Fort Worth, TX | 4.0 | 3.0 | 2444 | $2,700 | $1.10 | 15d | 1 | 0.70mi |
| 2513 Ponca Dr Fort Worth, TX | 4.0 | 3.0 | 2070 | $2,495 | $1.21 | 5d | 1 | 0.75mi |
| 2520 Shakopee St Fort Worth, TX | 4.0 | 2.0 | 1731 | $2,620 | $1.51 | 1d | 1 | 0.80mi |
| 10609 Potawatomi Ln Fort Worth, TX | 4.0 | 3.0 | 2260 | $3,200 | $1.42 | 26d | 1 | 0.80mi |
| 10609 Potawatomi Ln Fort Worth, TX | 4.0 | 3.0 | 2260 | $3,200 | $1.42 | 1d | 1 | 0.80mi |
| 2636 Keokuk St Fort Worth, TX | 4.0 | 2.0 | 1810 | $2,500 | $1.38 | 26d | 1 | 0.85mi |
| 3053 Titan Springs Dr Fort Worth, TX | 4.0 | 2.0 | 1667 | $2,320 | $1.39 | 26d | 1 | 0.87mi |
| 3012 Tooley Dr Fort Worth, TX | 4.0 | 2.0 | 1719 | $2,200 | $1.28 | 26d | 1 | 0.96mi |
| 2401 Linto St Fort Worth, TX | 5.0 | 3.0 | 3050 | $2,999 | $0.98 | 1d | 1 | 0.96mi |
| 2401 Linto St Fort Worth, TX | 5.0 | 3.0 | 3043 | $2,999 | $0.99 | 19d | 1 | 0.96mi |
| 9108 Lookout Pt Fort Worth, TX | 3.0 | 2.0 | 1711 | $2,100 | $1.23 | 9d | 1 | 1.19mi |
| 9021 Eagles Landing Dr Fort Worth, TX | 4.0 | 2.0 | 1850 | $2,295 | $1.24 | 23d | 1 | 1.30mi |
| 8928 Puerto Vista Dr Fort Worth, TX | 3.0 | 2.0 | 1631 | $2,050 | $1.26 | 26d | 1 | 1.30mi |
| 8925 Old Rawhide Ln Fort Worth, TX | 4.0 | 2.0 | 1809 | $2,295 | $1.27 | 15d | 1 | 1.31mi |
| 8916 Old Rawhide Ln Fort Worth, TX | 4.0 | 2.0 | 1776 | $2,250 | $1.27 | 26d | 1 | 1.32mi |
| 11012 Dillon St Fort Worth, TX | 3.0 | 2.5 | 1735 | $2,200 | $1.27 | 15d | 1 | 1.37mi |
| 6212 Flour Mill Run Fort Worth, TX | 4.0 | 2.0 | 1820 | $2,500 | $1.37 | 26d | 1 | 1.38mi |
| 5864 Mount Plymouth Pt Fort Worth, TX | 3.0 | 2.0 | 1635 | $2,100 | $1.28 | 26d | 1 | 1.39mi |
| 5404 Thornbush Dr Fort Worth, TX | 4.0 | 2.5 | 2923 | $2,900 | $0.99 | 26d | 1 | 1.43mi |
| 3025 Tooley Dr Fort Worth, TX | 4.0 | 2.0 | 1667 | $2,320 | $1.39 | 26d | 1 | 1.47mi |
HOA detail
- Monthly dues
- $52 · $624/yr
Listing history 7 events
-
2026-04-12status Pending
-
2026-04-04price $353,999
-
2026-04-04status Active
-
2026-03-06status Pending
-
2026-02-26price $350,299
-
2026-02-14price $359,299
-
2026-01-13$368,299 Active
ⓘ Source: listings_history table (triggers on properties + properties_extension) + one-shot
backfill from property_details.listing_events for pre-trigger history.
Tax reassessment forecast TX · Resets to sale price
- Current annual tax
- $1,166 · $97/mo
- Projected year-2 tax
- $6,478 · $540/mo
- Expected delta
- +$5,312/yr (+$443/mo · 455.7%)
ⓘ Screening estimate from a state-policy table — verify with the county assessor before closing.
Climate risk First Street
- Flood 1/10 Low FEMA zone X (unshaded) · 0% chance over 30 yrs
- Wildfire 5/10 Major
- Heat 7/10 Severe 7 d/yr ≥109°F today · 22 d/yr by 30 yrs out
- Wind 6/10 Major 27% chance of damaging wind over 30 yrs
- Air quality 2/10 Low 1 unhealthy d/yr today · 2 by 30 yrs out
Nearby sold comps map
Loading sold comps map…
Walkable amenities ~0.75 mi
Loading nearby amenities…
Taxation est. · year 1
- Rental income
- $32,029
- − Mortgage interest
- −$19,829
- − Property taxes
- −$1,166
- − Insurance
- −$1,770
- − Repairs & maintenance
- −$2,562
- − Management
- −$2,562
- − HOA
- −$624
- − Depreciation
- −$10,298
- Taxable loss
- −$6,783
- Est. tax savings @ 24.0%
- +$1,628
- After-tax cash flow
- $1,094/yr
For passive investors: Depreciation is non-cash, so a rental often shows a tax loss while cash-flowing — sheltering income. Rental losses are passive: they offset passive income freely, and up to $25,000/yr can offset ordinary (W-2) income if you actively participate and your MAGI is under $100k (phasing out to $0 by $150k); unused losses carry forward. On sale, claimed depreciation is recaptured at up to 25%, and gains may owe capital-gains tax (a 1031 exchange can defer both). Figures are a year-1 estimate at your 24.0% rate — not tax advice; consult a CPA.
Schools (NCES district)
- District
- Eagle Mt-Saginaw ISD
- NCES district ID
- 4817700
- Math proficiency
- 35% ▼ -16.00%
- Reading proficiency
- 42% ▼ -9.00%
- Median HH income
- $72,781
- Composite
- 35.41/100
- National rank
- #4945
- State rank
- #361 of 826 in TX
Livability — Fort Worth
- Score
- 80/100
- State rank
- #49
- US rank
- #1954
Category grades
Schools grade is shown separately in the Schools card above.
Census & demographics
- Census place
- Fort Worth, TX
- County
- Tarrant County · 2,033,669 people
- City population
- 911,619
- Metro
- Dallas-Fort Worth-Arlington, TX
- Population (ZIP)
- 80,090
- Household income
- $107,428
- Rent vs Own
- Severe rent burden
- 1494.0
Population outlook (Tarrant County) Hauer SSP2
- Today (2025)
- 2,380,417 people
- By 2030
- 2,578,900 · +8.3%
- By 2040
- 2,974,995 · +25.0%
- By 2050
- 3,350,489 · +40.8%
- By 2075
- 4,216,909 · +77.2%
- By 2100
- 4,741,527 · +99.2%
Race, ethnicity, and origin ACS 2023
- Neighborhood character
- Diverse neighborhood (Simpson 0.63)
- Race & ethnicity
- White 53% Hispanic / Latino 28% Two or more races 14% Black 12% Asian 4%
- Hispanic origin (detail)
- Mexican 22% Puerto Rican 2%
- Common ancestry
- Slovak 2% Lithuanian 2% Italian 1%
- Foreign-born
- 8% · Canada, Jamaica
- Languages at home
- 81% English-only · Spanish 15% Other Asian/Pacific 2% Other Indo-European 1%
Political lean MEDSL · Tarrant
- 2024 margin
- Lean R (+5.1) · D 46.7% · R 51.9% · Other 1.4%
- 2008→2024 swing
- +6.6pp toward D · 2008: -11.7pp · 2024: -5.1pp
- All cycles
- 2024: R+5.1 2020: D+0.2 2016: R+8.7 2012: R+15.7 2008: R+11.7
Not yet ingested
- Civics
- —
Market trends
- HPI YoY
- ▼ -137.12%
- Current HPI
- 237.6676
- Rent YoY
- ▲ 1.51%
- Metro
- Dallas-Fort Worth-Arlington, TX
- State GDP YoY
- ▲ 3.95%
- F500 in state
- 110
Industry mix (Fortune 500 HQ in TX)
| Industry | F500 HQs | Revenue |
|---|---|---|
| Energy | 16 | $1,198B |
|
||
| Technology | 5 | $198B |
|
||
| Engineering / Construction | 4 | $72B |
|
||
| Energy Services | 3 | $60B |
|
||
| Utilities | 3 | $41B |
|
||
| Healthcare | 2 | $330B |
|
||
Price history
-3.9% since first listed7 events — show timeline
- 2026-04-12 Pending — NTREIS
- 2026-04-04 Price Changed $353,999 NTREIS
- 2026-04-04 Relisted — NTREIS
- 2026-03-06 Pending — NTREIS
- 2026-02-26 Price Changed $350,299 NTREIS
- 2026-02-14 Price Changed $359,299 NTREIS
- 2026-01-13 Listed $368,299 NTREIS
Cash-flow waterfall
monthlySold comps — $/sqft
last 12 mo · ≤1 miLoading sold comps…