 🏷️ Likely Rental
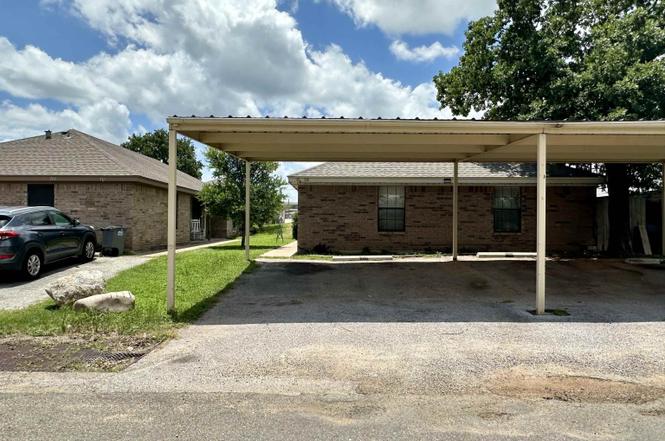
714 Redwood Ln · Kingsland, TX
Flood risk 1/10 · Minimal
- FEMA flood zone
- X (unshaded)
- Chance of flooding over 30 yrs
- 0.0%
- Est. flood insurance / yr
- $507 – $1,088
Fire risk 5/10 · Moderate
- Est. fire insurance / yr
- $1,222 – $2,270
Heat risk 8/10 · Major
- Hot days now (above 108°F)
- 7 days/yr
- Hot days in 30 yrs
- 23 days/yr
Wind risk 6/10 · Moderate
- Chance of severe wind over 30 yrs
- 59.0%
Air-quality risk 1/10 · Minimal
- Unhealthy air days now
- 0 days/yr
- Unhealthy air days in 30 yrs
- 0 days/yr
Risk factors via First Street. Map © Google.
Why this score? — see what drove the D grade
The composite is a weighted blend of 9 inputs, each scored 0–100. Each bar is that input's sub-score; the figure is the points it added to the 100-point composite (weight × sub-score).
- Cash flow +15.0/30.0
- ARV discount +7.5/15.0
- 1% rule +5.0/10.0
- DSCR +5.0/10.0
- Schools +3.5/10.0
- Livability +3.0/5.0
- Rent growth +2.5/5.0
- Condition / age +2.5/5.0
- Appreciation +0.0/10.0
$1,125
🖨 Deal sheet 📄 Offer letter ✓ Due diligence
Listing remarks
714 Redwood is a spacious 2-bedroom, 2-bath duplex centrally located in Kingsland, offering convenient access to schools, shopping, restaurants, and Lake LBJ. This well-maintained home features stained concrete floors throughout, creating a clean, durable, and low-maintenance living space. Additional features include an open living area, in-unit laundry, and a functional floor plan with two full bathrooms. Outside, you'll find a covered carport with space for two vehicles and a privacy-fenced backyard, providing plenty of room to relax and enjoy the outdoors. The convenient location and practical layout make this an excellent place to call home. Available now. Contact us today to schedule a
Key facts
- Covered carport
- In-unit laundry
- Open living area
Tags
Property features AI
Finance
- Other: Located in the Llano high school district
Exterior
- Home design: Duplex; Residential income property; Address: 714 Redwood Ln, Kingsland, TX 78639
- Exterior features: Lot dimensions approximately 50 x 100; Lot size approximately 0.12 acres; Located in the Nob Hill subdivision
Interior
- Interior features: Duplex residential income property
Neighborhood map
What this means for you Summary
Snapshot
- This is a single-family listed at $1k.
Deal economics
- At list price, monthly cash flow is $859 ($10k/yr) — positive.
- The deal already cash-flows at list — no discount required.
- Meets the 1% rule at list price ($1k rent vs $1k).
Location & tenants
- Location reads 59/100 on livability (#1,161 in TX) — a working-class tenant base; expect higher turnover. Strengths: cost of living A+, housing A+; Watch: schools F, amenities F, commute F.
- Llano ISD (town): math 40% / reading 43% proficiency, ranked #359 of 826 in TX (top 44%) — families likely to look elsewhere, expect single-tenant / working-renter base with shorter leases.
- Market conditions: 435 active listings in the ZIP; 3 comparable units currently listed for rent nearby; rentals leasing fast (median 12d on market — plan ~1-2 weeks tenant-placement turnaround); 121 units permitted in Llano County in 2024 (0 in 5+ unit buildings).
Forward outlook
- Local home prices are declining (-3.0%/yr); year-one equity from $8 of loan paydown is wiped out by about $34 of value loss. Plan a longer hold.
- Llano County population projected at +11% by 2050 — modest demand growth; plan on rents tracking national, not racing it.
- At projected returns (-3.0% appreciation + 3.0% rent growth), your $315 cash investment doubles in ~1 year — after that, you're playing with house money.
Negotiation context
- Only 1 days on market — expect competitive offers; lowballing is unlikely to land.
- 4 sale attempts since 2y ago with the ask held roughly flat each time — persistent listings suggest the price (not the market) is what's stuck; bring a comps-based counter.
Risks & watch-outs
- Climate carrying-cost: major wind risk, 59% chance of damaging wind over 30y; moderate wildfire risk; extreme-heat days projected 7→23/yr by 2055 (HVAC capex compounding) — expect insurance premiums to compound above CPI over the hold.
Questions for the listing agent
- Is there a deadline driving the sale (1031 exchange, divorce, estate, relocation)? That informs how much negotiation room exists.
- Schools are F-rated, which usually means shorter tenancies and higher turnover. Who's the typical renter profile here, and what's been the actual vacancy rate?
- The area grade is low — what's the realistic commute time and amenity access for the typical tenant pool here? Any planned neighborhood developments (good or bad) we should know about?
- What's the average days-on-market for RENTAL listings here right now (not sales)? A rising rental-DOM trend means longer vacancies and softer asking-rent achievability than the comps imply.
- What's the recent tenant-quality profile in this submarket — average credit score on applications, eviction rate, late-payment / NSF rate, and stable-employment percentage? A property-management company in the area should have these aggregated.
- How much new for-sale + rental construction is in the pipeline within 1–3 miles? Heavy new supply typically softens prices + rents 12–24 months out; constrained supply supports both.
Investment metrics
- 1% rule
- 97.47% ✓
- Cap rate
- 922.06%
- Cash-on-cash
- 3270.60%
- DSCR
- 146.52
- GRM
- 0.1
CMA / ARV
- ARV (on-the-fly)
- $177,144
- Comps found
- 1
Show comp detail 1 sale within ~0.75 mi
| Address | Dist | Beds/Ba | Sqft | Sold | Price | $/sf | Match |
|---|---|---|---|---|---|---|---|
| 1615 Sioux Trl | 0.74mi | 2/1.0 | 864 (-11%) | 14mo | $158,000 | $183 | 36 |
Match score weights: distance 35% · size 25% · config 20% · recency 20%. Top-matched comps best support the ARV.
Projected returns pro-forma
-3.0% appreciation · 3.0% rent growth · sell at horizon
- IRR
- —
- Equity multiple
- 174.06×
- Total profit
- $54,515
- Equity at exit
- $168
- IRR
- —
- Equity multiple
- 375.44×
- Total profit
- $117,947
- Equity at exit
- $97
Cash invested: $315 (down + closing). Projections, not guarantees.
Landlord ↔ Tenant lean methodology
- Overall (STATE)
- 87 Strongly Landlord-Friendly
- State Texas
- 87 Strongly Landlord-Friendly · R+5
- County
- — inherits STATE
- City
- — inherits STATE
ZIP-level market 78639
- Active inventory
- 435
- Price-to-rent
- 0.1×
Monthly cashflow live
- Estimated rent
- $1,097 medium interval (Pro) →
- Mortgage (P&I)
- −$6
- Tax est. 1.5%
- −$1 /mo · $17/yr
- Insurance
- −$0
- HOA
- −$0
- Vacancy / Maint / Mgmt
- −$230
- Net cashflow
- $859
Break-even live
UW: 25.0% down · 7.5% · 30yr · 1.5% tax · 5.0% vac · 8.0% maint · 8.0% mgmt
Financing live
Cash to close
- Down payment
- $281
- Closing costs
- $34
- Reserves months
- —
- Total cash needed
- —
Loan-product check · same deal, 3 products live
Conventional
25% down · 7.5% · 30yr
- Down + closing
- —
- Monthly P&I
- —
- Monthly cashflow
- —
- DSCR
- —
- Eligible?
- —
Personal DTI + credit; lowest rate.
DSCR
20% down · 8.5% · 30yr
- Down + closing
- —
- Monthly P&I
- —
- Monthly cashflow
- —
- DSCR
- —
- Eligible?
- —
No personal income docs; deal must DSCR.
Hard money
10% down · 12.0% · 12mo
- Down + closing
- —
- Monthly P&I
- —
- Monthly cashflow
- —
- DSCR
- —
- Eligible?
- —
Short-term bridge; refi at stabilization.
Rent comps 3 comps
| Address | Beds | Baths | Sqft | Rent | $/sqft | DOM | Units | Dist |
|---|---|---|---|---|---|---|---|---|
| 804 Redwood Dr Unit 806 Kingsland, TX | 2.0 | 2.0 | 962 | $1,050 | $1.09 | 12d | 1 | 0.04mi |
| 2146 Cedar Valley Dr Kingsland, TX | 2.0 | 1.0 | 1000 | $925 | $0.93 | 18d | 1 | 0.10mi |
| 200 Aster St Unit 930B Dallas Kingsland, TX | 2.0 | 2.0 | 900 | $995 | $1.11 | 12d | 1 | 0.80mi |
Listing history 2 events
-
2026-06-18remarks 699-char remark
-
2026-06-18$1,125 Active 1 DOM
ⓘ Source: listings_history table (triggers on properties + properties_extension) + one-shot
backfill from property_details.listing_events for pre-trigger history.
Climate risk First Street
- Flood 1/10 Low FEMA zone X (unshaded) · 0% chance over 30 yrs
- Wildfire 5/10 Major
- Heat 8/10 Severe 7 d/yr ≥108°F today · 23 d/yr by 30 yrs out
- Wind 6/10 Major 59% chance of damaging wind over 30 yrs
- Air quality 1/10 Low 0 unhealthy d/yr today · 0 by 30 yrs out
Nearby sold comps map
Loading sold comps map…
Walkable amenities ~0.75 mi
Loading nearby amenities…
Taxation est. · year 1
- Rental income
- $13,159
- − Mortgage interest
- −$63
- − Property taxes
- −$17
- − Insurance
- −$6
- − Repairs & maintenance
- −$1,053
- − Management
- −$1,053
- − Depreciation
- −$33
- Taxable income
- $10,935
- Est. tax owed @ 24.0%
- −$2,624
- After-tax cash flow
- $7,678/yr
For passive investors: Depreciation is non-cash, so a rental often shows a tax loss while cash-flowing — sheltering income. Rental losses are passive: they offset passive income freely, and up to $25,000/yr can offset ordinary (W-2) income if you actively participate and your MAGI is under $100k (phasing out to $0 by $150k); unused losses carry forward. On sale, claimed depreciation is recaptured at up to 25%, and gains may owe capital-gains tax (a 1031 exchange can defer both). Figures are a year-1 estimate at your 24.0% rate — not tax advice; consult a CPA.
Schools (NCES district)
- District
- Llano ISD
- NCES district ID
- 4827810
- Math proficiency
- 40% ▼ -5.00%
- Reading proficiency
- 43% ▼ -5.00%
- Median HH income
- $46,746
- Composite
- 35.42/100
- National rank
- #4940
- State rank
- #359 of 826 in TX
Livability — Kingsland
- Score
- 59/100
- State rank
- #1161
- US rank
- #20293
Category grades
Schools grade is shown separately in the Schools card above.
Census & demographics
- Census place
- Kingsland, TX
- County
- Llano County · 16,310 people
- City population
- 8,719
- Metro
- nan
- Population (ZIP)
- 8,719
- Household income
- $57,742
- Rent vs Own
- Severe rent burden
- 202.0
Population outlook (Llano County) Hauer SSP2
- Today (2025)
- 20,847 people
- By 2030
- 21,350 · +2.4%
- By 2040
- 22,281 · +6.9%
- By 2050
- 23,173 · +11.2%
- By 2075
- 25,526 · +22.4%
- By 2100
- 25,866 · +24.1%
Race, ethnicity, and origin ACS 2023
- Neighborhood character
- Predominantly White (73%)
- Race & ethnicity
- White 73% Hispanic / Latino 23% Two or more races 14% Black 1%
- Hispanic origin (detail)
- Mexican 19%
- Common ancestry
- Italian 4% Slovak 3% Serbian 3%
- Foreign-born
- 7% · Canada
- Languages at home
- 84% English-only · Spanish 15%
Political lean MEDSL · Llano
- 2024 margin
- Solid R (+60.9) · D 19.2% · R 80.0%
- 2008→2024 swing
- -8.6pp toward R · 2008: -52.2pp · 2024: -60.9pp
- All cycles
- 2024: R+60.9 2020: R+60.1 2016: R+62.2 2012: R+60.4 2008: R+52.2
Not yet ingested
- Civics
- —
Market trends
- HPI YoY
- ▼ -123.30%
- Current HPI
- 219.8651
- Rent YoY
- —
- Metro
- nan
- State GDP YoY
- ▲ 3.95%
- F500 in state
- 110
Industry mix (Fortune 500 HQ in TX)
| Industry | F500 HQs | Revenue |
|---|---|---|
| Energy | 16 | $1,198B |
|
||
| Technology | 5 | $198B |
|
||
| Engineering / Construction | 4 | $72B |
|
||
| Energy Services | 3 | $60B |
|
||
| Utilities | 3 | $41B |
|
||
| Healthcare | 2 | $330B |
|
||
Price history
-4.3% since first listed9 events — show timeline
- 2026-06-18 Listed $1,125 HLMLS as distributed by MLS GRID
- 2024-09-18 Rental Removed $1,095 RENTALBEAST
- 2024-09-13 Listed for Rent $1,095 RENTALBEAST
- 2024-09-13 Rental Removed $1,095 HLMLS
- 2024-08-15 Listed for Rent $1,095 HLMLS
- 2024-08-10 Rental Removed $1,095 HLMLS
- 2024-08-07 Price Changed $1,095 HLMLS
- 2024-07-16 Price Changed $1,099 HLMLS
- 2024-06-25 Listed for Rent $1,175 HLMLS
Cash-flow waterfall
monthlySold comps — $/sqft
last 12 mo · ≤1 miLoading sold comps…