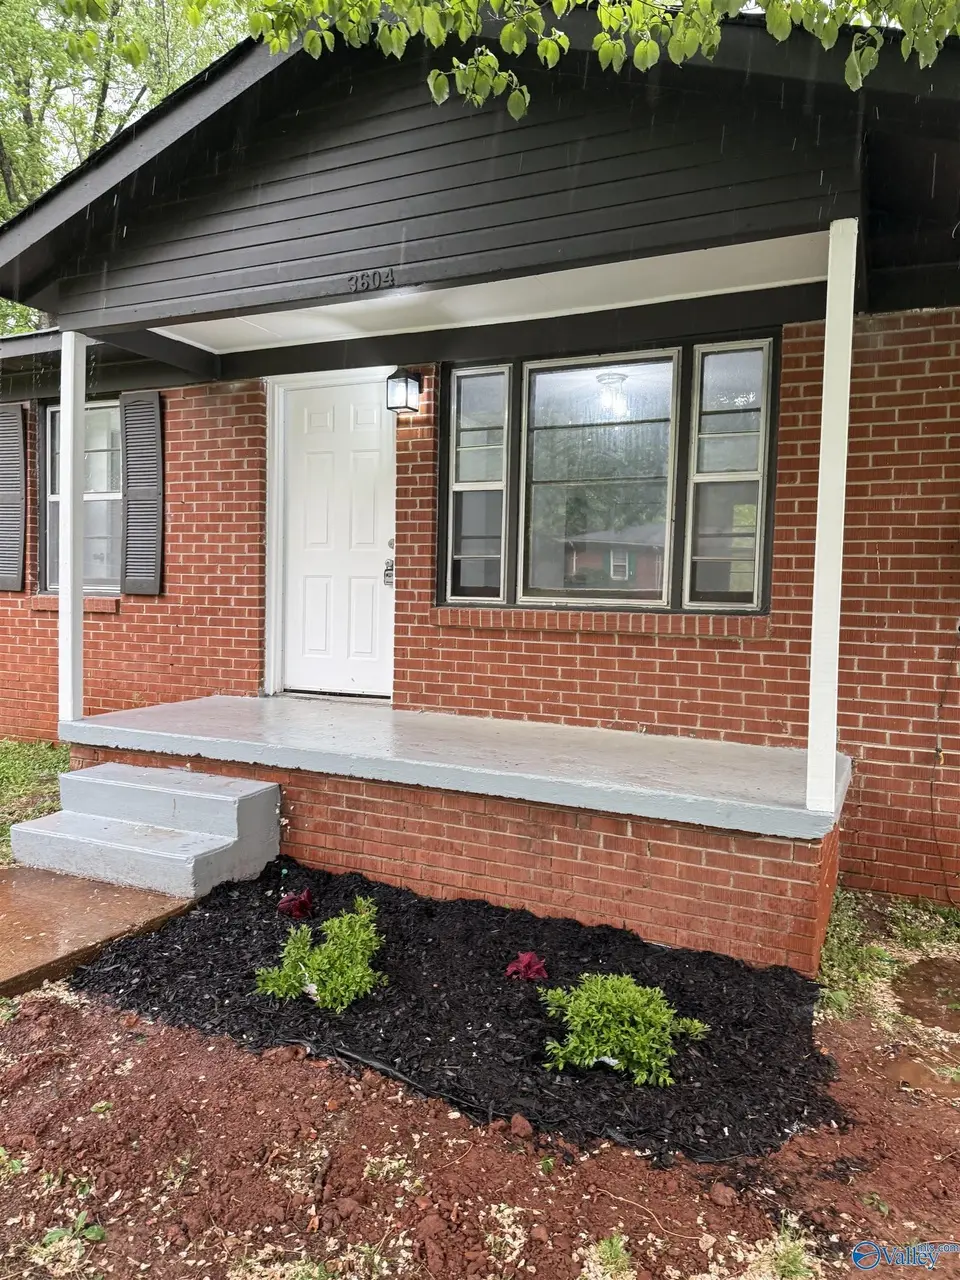
3604 Princess St NW · Huntsville, AL
Flood risk 1/10 · Minimal
- FEMA flood zone
- X (unshaded)
- Chance of flooding over 30 yrs
- 0.0%
- Est. flood insurance / yr
- $507 – $1,088
Fire risk 1/10 · Minimal
- Est. fire insurance / yr
- $916 – $1,700
Heat risk 5/10 · Moderate
- Hot days now (above 105°F)
- 7 days/yr
- Hot days in 30 yrs
- 19 days/yr
Wind risk 4/10 · Minor
- Chance of severe wind over 30 yrs
- 18.0%
Air-quality risk 2/10 · Minimal
- Unhealthy air days now
- 1 days/yr
- Unhealthy air days in 30 yrs
- 1 days/yr
Risk factors via First Street. Map © Google.
Why this score? — see what drove the D- grade
The composite is a weighted blend of 9 inputs, each scored 0–100. Each bar is that input's sub-score; the figure is the points it added to the 100-point composite (weight × sub-score).
- Cash flow +13.7/30.0
- DSCR +4.1/10.0
- Livability +4.1/5.0
- ARV discount +2.9/15.0
- Schools +2.9/10.0
- 1% rule +2.8/10.0
- Rent growth +2.5/5.0
- Condition / age +2.5/5.0
- Appreciation +0.0/10.0
$169,000
🖨 Deal sheet 📄 Offer letter ✓ Due diligence
Listing remarks MLS
3 bed 2 bath updated home in north Huntsville! this move-in ready property features a great roof, all new plumbing, and a completely remodeled bathroom. great hvac and solid construction make this a perfect option for a first-time homebuyer or rental investment.
Key facts
- Solid construction
- Great hvac
- All new plumbing
Tags
Neighborhood map
What this means for you Summary
Snapshot
- This is a 3-bed/2.0-bath single-family listed at $169k.
Deal economics
- At list price, monthly cash flow is $11 ($132/yr) — positive.
- The deal already cash-flows at list — no discount required.
- To meet the 1% rule (rent ≥ 1% of price), the offer needs to be $131k (22.3% below list).
- Recommended offer: $131k (22.3% below list) — sets the bar for 1% rule.
- Cap rate 6.4% vs local median 3.8% in Huntsville — top-decile yield for the area; either an underpriced asset or a hidden risk that comps aren't pricing in. Stress-test before assuming the spread holds.
Location & tenants
- Location reads 82/100 on livability (#3 in AL, #1,082 nationally) — a professional / high-income tenant draw. Strengths: commute A+, cost of living A+, housing A+; Watch: crime F.
- Huntsville City (urban): math 21% / reading 46% proficiency, ranked #48 of 129 in AL (top 37%) — families likely to look elsewhere, expect single-tenant / working-renter base with shorter leases.
- Market conditions: Rents soft (-0.1%/yr); 337 active listings in the ZIP; 24 comparable units currently listed for rent nearby; rentals lingering (median 44d on market — plan ~5-8 weeks vacancy on turnover, expect pricing pressure); 67% of comp listings sitting > 30 days — soft ceiling on asking rent; 4,709 units permitted in Madison County in 2024 (1,186 in 5+ unit buildings).
- This rent runs 31% of the median local income ($51k/yr) — at the standard rent-burdened threshold; future hikes will face affordability resistance.
Forward outlook
- Local home prices are declining (-3.0%/yr); year-one equity from $1k of loan paydown is wiped out by about $5k of value loss. Plan a longer hold.
- Madison County population projected at +18% by 2050 — long-run rental-demand tailwind backs the buy-and-hold thesis.
Negotiation context
- It's been on market 79 days — a 6% lower offer ($159k) is reasonable based on typical stale-listing flexibility.
- 2 sale attempts with the ask held roughly flat each time — persistent listings suggest the price (not the market) is what's stuck; bring a comps-based counter.
- Current owner paid $110k; list at $169k implies a 54% gain — meaningful room to come down on a strong offer.
Risks & watch-outs
- Watch-outs: built in 1958 — expect roof / HVAC / electrical / plumbing capex.
- Climate carrying-cost: extreme-heat days projected 7→19/yr by 2055 (HVAC capex compounding) — expect insurance premiums to compound above CPI over the hold.
Questions for the listing agent
- It's been on market 79 days. Have you received any prior offers? Is the seller open to a 22% concession, seller financing, or rate buy-down credit?
- Built in 1958 — when were the roof, HVAC, electrical panel, plumbing, and water heater last replaced?
- Why hasn't it sold? Are there any deal-killer items the seller is aware of (foundation, flood, title, zoning, code violations)?
- Is there a deadline driving the sale (1031 exchange, divorce, estate, relocation)? That informs how much negotiation room exists.
- Crime grade is F in this area — have there been break-ins, vandalism, or insurance claims at this property in the last 3 years? What carrier currently insures it and at what premium?
- The area grade is low — what's the realistic commute time and amenity access for the typical tenant pool here? Any planned neighborhood developments (good or bad) we should know about?
- What's the average days-on-market for RENTAL listings here right now (not sales)? A rising rental-DOM trend means longer vacancies and softer asking-rent achievability than the comps imply.
- What's the recent tenant-quality profile in this submarket — average credit score on applications, eviction rate, late-payment / NSF rate, and stable-employment percentage? A property-management company in the area should have these aggregated.
- How much new for-sale + rental construction is in the pipeline within 1–3 miles? Heavy new supply typically softens prices + rents 12–24 months out; constrained supply supports both.
Investment metrics
- 1% rule
- 0.78% ✗
- Cap rate
- 6.37%
- Cash-on-cash
- 0.28%
- DSCR
- 1.01
- GRM
- 10.7
CMA / ARV
- ARV (median comp)
- $153,316
- List price
- $169,000
- Delta
- 10.23%
- Verdict
- OVERPRICED
- Comps
- 20 within 1.0 mi
Show comp detail 12 sales within ~0.75 mi
| Address | Dist | Beds/Ba | Sqft | Sold | Price | $/sf | Match |
|---|---|---|---|---|---|---|---|
| 3610 Princess St | 0.05mi | 3/2.0 | 1,117 (+15%) | 1mo | $141,000 | $126 | 72 |
| 3607 Gay St | 0.22mi | 3/1.0 | 936 (-4%) | 11mo | $185,000 | $198 | 70 |
| 3506 Gay St | 0.18mi | 2/1.0 (-1) | 887 (-9%) | 4mo | $68,000 | $77 | 65 |
| 3612 Dawnwood Dr | 0.18mi | 3/1.5 | 1,072 (+10%) | 10mo | $110,000 | $103 | 64 |
| 4226 Tee Jay Dr NW | 0.57mi | 3/1.5 | 1,025 (+6%) | 4mo | $145,000 | $141 | 59 |
| 3121 Greenhill Dr NW | 0.34mi | 3/1.5 | 1,100 (+13%) | 2mo | $184,000 | $167 | 59 |
| 4206 Irondale Dr NW | 0.45mi | 2/1.0 (-1) | 1,000 (+3%) | 8mo | $127,000 | $127 | 58 |
| 2514 Jeri St NW | 0.69mi | 3/1.5 | 1,003 (+3%) | 10mo | $140,000 | $140 | 52 |
| 4227 Keith Dr NW | 0.63mi | 3/2.0 | 1,036 (+7%) | 10mo | $109,000 | $105 | 52 |
| 4209 Eastland Dr NW | 0.70mi | 3/1.5 | 1,014 (+4%) | 10mo | $173,500 | $171 | 50 |
| 4240 Tee Jay Dr | 0.65mi | 3/1.0 | 1,015 (+4%) | 15mo | $182,500 | $180 | 46 |
| 2906 Hester Ln | 0.53mi | 3/1.0 | 1,113 (+14%) | 2mo | $122,000 | $110 | 45 |
Match score weights: distance 35% · size 25% · config 20% · recency 20%. Top-matched comps best support the ARV.
Projected returns pro-forma
-3.0% appreciation · 0.0% rent growth · sell at horizon
- IRR
- -18.9%
- Equity multiple
- 0.35×
- Total profit
- $-30,599
- Equity at exit
- $25,198
- IRR
- -18.1%
- Equity multiple
- 0.14×
- Total profit
- $-40,883
- Equity at exit
- $14,612
Cash invested: $47,320 (down + closing). Projections, not guarantees.
Landlord ↔ Tenant lean methodology
- Overall (STATE)
- 90 Strongly Landlord-Friendly
- State Alabama
- 90 Strongly Landlord-Friendly · R+15
- County
- — inherits STATE
- City
- — inherits STATE
ZIP-level market 35810
- Home prices YoY
- -23.5%
- Rents YoY
- -0.1%
- Active inventory
- 337
- Price-to-rent
- 10.7×
Monthly cashflow live
- Estimated rent
- $1,313 high interval (Pro) →
- Mortgage (P&I)
- −$886
- Tax from tax record
- −$69 /mo · $833/yr
- Insurance
- −$70
- HOA
- −$0
- Vacancy / Maint / Mgmt
- −$276
- Net cashflow
- $11
Break-even live
UW: 25.0% down · 7.5% · 30yr · 1.5% tax · 5.0% vac · 8.0% maint · 8.0% mgmt
Financing live
Cash to close
- Down payment
- $42,250
- Closing costs
- $5,070
- Reserves months
- —
- Total cash needed
- —
Loan-product check · same deal, 3 products live
Conventional
25% down · 7.5% · 30yr
- Down + closing
- —
- Monthly P&I
- —
- Monthly cashflow
- —
- DSCR
- —
- Eligible?
- —
Personal DTI + credit; lowest rate.
DSCR
20% down · 8.5% · 30yr
- Down + closing
- —
- Monthly P&I
- —
- Monthly cashflow
- —
- DSCR
- —
- Eligible?
- —
No personal income docs; deal must DSCR.
Hard money
10% down · 12.0% · 12mo
- Down + closing
- —
- Monthly P&I
- —
- Monthly cashflow
- —
- DSCR
- —
- Eligible?
- —
Short-term bridge; refi at stabilization.
Rent comps 24 comps
| Address | Beds | Baths | Sqft | Rent | $/sqft | DOM | Units | Dist |
|---|---|---|---|---|---|---|---|---|
| 3601 Fay St NW Huntsville, AL | 2.0 | 1.0 | 972 | $1,195 | $1.23 | 43d | 1 | 0.13mi |
| 3803 Mastin Lake Rd NW Huntsville, AL | 3.0 | 1.0 | 1103 | $1,295 | $1.17 | 43d | 1 | 0.63mi |
| 3210 Tucker Dr NW Huntsville, AL | 3.0 | 1.0 | 1005 | $1,475 | $1.47 | 13d | 1 | 0.78mi |
| 4114 Blue Spring Rd NW Huntsville, AL | 3.0 | 2.0 | 1100 | $1,500 | $1.36 | 23d | 1 | 0.79mi |
| 2519 Birchfield St NW Huntsville, AL | 3.0 | 1.5 | 1125 | $1,195 | $1.06 | 43d | 1 | 0.85mi |
| 3706 Wilbanks Dr NW Huntsville, AL | 3.0 | 1.0 | 1000 | $1,300 | $1.30 | 43d | 1 | 0.90mi |
| 3210 Caywood Dr NW Huntsville, AL | 3.0 | 1.0 | 1005 | $1,475 | $1.47 | 13d | 1 | 0.91mi |
| 2708 Monticello Dr NW Huntsville, AL | 3.0 | 1.0 | 1025 | $1,300 | $1.27 | 23d | 1 | 1.02mi |
| 2708 Monticello Dr NW Huntsville, AL | 3.0 | 1.0 | 1025 | $1,350 | $1.32 | 43d | 1 | 1.02mi |
| 2640 Blue Spring Rd NW Huntsville, AL | 1.0–3.0 | 1.0–2.0 | 944 | $1,149 | $1.22 | 43d | 3 | 1.05mi |
| 2401 Mount Vernon Rd NW Huntsville, AL | 3.0 | 1.0 | 950 | $1,045 | $1.10 | 43d | 1 | 1.09mi |
| 3410 Elizabeth St NW Apt 7 Huntsville, AL | 2.0 | 1.0 | 800 | $799 | $1.00 | 43d | 1 | 1.10mi |
| 3410 Elizabeth St NW Unit 2 Huntsville, AL | 2.0 | 1.0 | 800 | $850 | $1.06 | 43d | 1 | 1.10mi |
| 3410 Elizabeth St NW Unit 5 Huntsville, AL | 2.0 | 1.0 | 675 | $799 | $1.18 | 23d | 1 | 1.10mi |
| 2219 Jonathan Dr NW Apt C Huntsville, AL | 2.0 | 1.5 | 850 | $850 | $1.00 | 43d | 1 | 1.17mi |
| 2728 Clayton Dr NW Unit B Huntsville, AL | 2.0 | 1.0 | 900 | $795 | $0.88 | 43d | 1 | 1.22mi |
| 2721 Clayton Dr NW Huntsville, AL | 3.0 | 1.0 | 1000 | $998 | $1.00 | 43d | 1 | 1.26mi |
| 2711 Clayton Dr NW Huntsville, AL | 3.0 | 1.5 | 1030 | $1,400 | $1.36 | 43d | 1 | 1.27mi |
| 4802 Proctor Cir NW Huntsville, AL | 3.0 | 1.0 | 1000 | $1,250 | $1.25 | 43d | 1 | 1.37mi |
| 2433 Shepherd Dr NW Huntsville, AL | 3.0 | 1.0 | 864 | $1,300 | $1.50 | 43d | 1 | 1.41mi |
| 2415 Vining Ave NW Huntsville, AL | 3.0 | 1.0 | 1079 | $1,250 | $1.16 | 13d | 1 | 1.43mi |
| 3100 Gayhart Dr NW Huntsville, AL | 3.0 | 1.0 | 1050 | $1,298 | $1.24 | 43d | 1 | 1.45mi |
| 2212 Old Blue Spring Rd NW Unit A Huntsville, AL | 2.0 | 1.0 | 970 | $970 | $1.00 | 23d | 1 | 1.49mi |
| 2212 Old Blue Spring Rd NW Unit B Huntsville, AL | 2.0 | 1.0 | 759 | $870 | $1.15 | 23d | 1 | 1.49mi |
Listing history 14 events
-
2026-06-09days on market $169,000 Active 79 DOM
-
2026-06-08days on market $169,000 Active 78 DOM
-
2026-06-07days on market $169,000 Active 77 DOM
-
2026-06-03days on market $169,000 Active 73 DOM
-
2026-06-02days on market $169,000 Active 72 DOM
-
2026-06-01days on market $169,000 Active 71 DOM
-
2026-05-31days on market $169,000 Active 70 DOM
-
2026-05-30days on market $169,000 Active 69 DOM
-
2026-04-28status Active 263-char remark
Show marketing remark (263 chars)
3 bed 2 bath updated home in north Huntsville! this move-in ready property features a great roof, all new plumbing, and a completely remodeled bathroom. great hvac and solid construction make this a perfect option for a first-time homebuyer or rental investment.
-
2026-04-28price $169,000 263-char remark
Show marketing remark (263 chars)
3 bed 2 bath updated home in north Huntsville! this move-in ready property features a great roof, all new plumbing, and a completely remodeled bathroom. great hvac and solid construction make this a perfect option for a first-time homebuyer or rental investment.
-
2026-03-23price $169,499 263-char remark
Show marketing remark (263 chars)
3 bed 2 bath updated home in north Huntsville! this move-in ready property features a great roof, all new plumbing, and a completely remodeled bathroom. great hvac and solid construction make this a perfect option for a first-time homebuyer or rental investment.
-
2026-03-14$174,900 Active 263-char remark
Show marketing remark (263 chars)
3 bed 2 bath updated home in north Huntsville! this move-in ready property features a great roof, all new plumbing, and a completely remodeled bathroom. great hvac and solid construction make this a perfect option for a first-time homebuyer or rental investment.
-
2026-02-10soldstatus $110,000
-
2006-02-28soldstatus $43,000
ⓘ Source: listings_history table (triggers on properties + properties_extension) + one-shot
backfill from property_details.listing_events for pre-trigger history.
Tax reassessment forecast AL · Resets to sale price
- Current annual tax
- $833 · $69/mo
- Projected year-2 tax
- $833 · $69/mo
- Expected delta
- $0/yr ($0/mo · 0.0%)
ⓘ Screening estimate from a state-policy table — verify with the county assessor before closing.
Climate risk First Street
- Flood 1/10 Low FEMA zone X (unshaded) · 0% chance over 30 yrs
- Wildfire 1/10 Low
- Heat 5/10 Major 7 d/yr ≥105°F today · 19 d/yr by 30 yrs out
- Wind 4/10 Moderate 18% chance of damaging wind over 30 yrs
- Air quality 2/10 Low 1 unhealthy d/yr today · 1 by 30 yrs out
Nearby sold comps map
Loading sold comps map…
Walkable amenities ~0.75 mi
Loading nearby amenities…
Taxation est. · year 1
- Rental income
- $15,753
- − Mortgage interest
- −$9,467
- − Property taxes
- −$833
- − Insurance
- −$845
- − Repairs & maintenance
- −$1,260
- − Management
- −$1,260
- − Depreciation
- −$4,916
- Taxable loss
- −$2,828
- Est. tax savings @ 24.0%
- +$679
- After-tax cash flow
- $811/yr
For passive investors: Depreciation is non-cash, so a rental often shows a tax loss while cash-flowing — sheltering income. Rental losses are passive: they offset passive income freely, and up to $25,000/yr can offset ordinary (W-2) income if you actively participate and your MAGI is under $100k (phasing out to $0 by $150k); unused losses carry forward. On sale, claimed depreciation is recaptured at up to 25%, and gains may owe capital-gains tax (a 1031 exchange can defer both). Figures are a year-1 estimate at your 24.0% rate — not tax advice; consult a CPA.
Schools (NCES district)
- District
- Huntsville City
- NCES district ID
- 0101800
- Math proficiency
- 21% ▼ -23.00%
- Reading proficiency
- 46% ▬ 0.00%
- Median HH income
- $48,264
- Composite
- 28.84/100
- National rank
- #6647
- State rank
- #48 of 129 in AL
Livability — Huntsville
- Score
- 82/100
- State rank
- #3
- US rank
- #1082
Category grades
Schools grade is shown separately in the Schools card above.
Census & demographics
- Census place
- Huntsville, AL
- County
- Madison County · 380,832 people
- City population
- 220,435
- Metro
- Huntsville, AL
- Population (ZIP)
- 32,843
- Household income
- $51,233
- Rent vs Own
- Severe rent burden
- 1223.0
Population outlook (Madison County) Hauer SSP2
- Today (2025)
- 392,086 people
- By 2030
- 409,788 · +4.5%
- By 2040
- 440,557 · +12.4%
- By 2050
- 460,990 · +17.6%
- By 2075
- 502,872 · +28.3%
- By 2100
- 513,623 · +31.0%
Race, ethnicity, and origin ACS 2023
- Neighborhood character
- Predominantly Black (69%)
- Race & ethnicity
- Black 69% White 18% Hispanic / Latino 9% Two or more races 5%
- Hispanic origin (detail)
- Mexican 3% Puerto Rican 2% Dominican 2%
- Common ancestry
- Italian 2% Lithuanian 0%
- Foreign-born
- 6% · Canada
- Languages at home
- 92% English-only · Spanish 7%
Political lean MEDSL · Madison
- 2024 margin
- Lean R (+9.0) · D 44.7% · R 53.7% · Other 1.6%
- 2008→2024 swing
- +6.0pp toward D · 2008: -14.9pp · 2024: -9.0pp
- All cycles
- 2024: R+9.0 2020: R+8.0 2016: R+16.8 2012: R+18.7 2008: R+14.9
Not yet ingested
- Civics
- —
Market trends
- HPI YoY
- ▼ -61.00%
- Current HPI
- 198.9629
- Rent YoY
- ▬ -0.05%
- Metro
- Huntsville, AL
- State GDP YoY
- ▲ 2.94%
- F500 in state
- 4
Industry mix (Fortune 500 HQ in AL)
| Industry | F500 HQs | Revenue |
|---|---|---|
| Financial Services | 1 | $8B |
|
||
| Healthcare | 1 | $5B |
|
||
Price history
+293.0% since first listed6 events — show timeline
- 2026-04-28 Relisted — VMLS
- 2026-04-28 Price Changed $169,000 VMLS
- 2026-03-23 Price Changed $169,499 VMLS
- 2026-03-14 Listed $174,900 VMLS
- 2026-02-10 Sold (Public Records) $110,000 Public Records
- 2006-02-28 Sold (Public Records) $43,000 Public Records
Property tax history
+3.8%/yrLatest (2024): $833 · +2.3% YoY. Source: county tax records.
Cash-flow waterfall
monthlySold comps — $/sqft
last 12 mo · ≤1 miLoading sold comps…