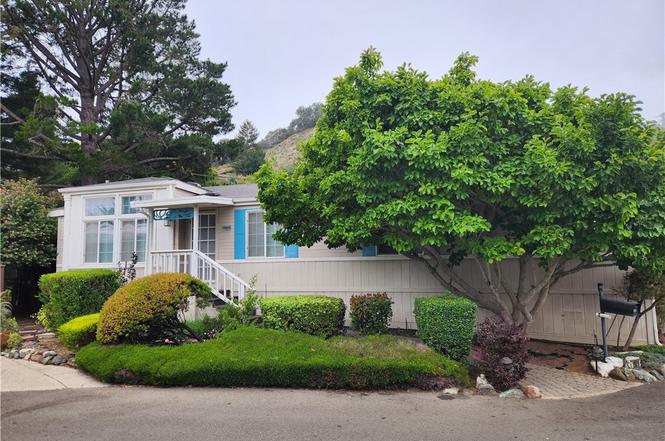
1909 Claire Dr · San Luis Obispo, CA
Flood risk 1/10 · Minimal
- FEMA flood zone
- X (unshaded)
- Chance of flooding over 30 yrs
- 0.0%
- Est. flood insurance / yr
- $507 – $1,088
Fire risk 5/10 · Moderate
- Est. fire insurance / yr
- $659 – $1,223
Heat risk 4/10 · Minor
- Hot days now (above 81°F)
- 5 days/yr
- Hot days in 30 yrs
- 14 days/yr
Wind risk 1/10 · Minimal
- Chance of severe wind over 30 yrs
- —
Air-quality risk 6/10 · Moderate
- Unhealthy air days now
- 11 days/yr
- Unhealthy air days in 30 yrs
- 11 days/yr
Risk factors via First Street. Map © Google.
Why this score? — see what drove the F grade
The composite is a weighted blend of 9 inputs, each scored 0–100. Each bar is that input's sub-score; the figure is the points it added to the 100-point composite (weight × sub-score).
- Cash flow +10.4/30.0
- Schools +4.6/10.0
- Rent growth +4.2/5.0
- Livability +3.7/5.0
- 1% rule +3.1/10.0
- DSCR +3.0/10.0
- Condition / age +2.5/5.0
- ARV discount +2.3/15.0
- Appreciation +0.0/10.0
$465,000
🖨 Deal sheet (PDF) 📄 Offer letter ✓ Due diligence
Listing remarks MLS
One of the best locations in Laguna Mobile Estates. This delightful, 1998 custom built Silvercrest manufactured home offers quality 2X6 construction, dual pane windows, energy efficient insulated roof, walls and floors, vaulted ceilings, and mature landscaping with drip irrigation. Enjoy this charming three bedroom, two bath home with open floor plan, spacious kitchen and master bedroom, plus the 300 SF redwood deck with fabulous creek and hillside views. Park amenities include a grand clubhouse with pool, gym, sauna and more.
Key facts
- Open floor plan
- Spacious kitchen
- Luxurious bath
Tags
Property features AI
Finance
- Other: Mobile home remains on site; Property condition: termite clearance
- Financial info: Land lease payable monthly (park lease)
- HOA & community: Part of an association with monthly fees; Laguna Mobile Home Park community amenities (pool, hiking, mountainous, lake nearby); Manager approval required; Pets allowed with breed restrictions
Exterior
- Parking: Carport; Has parking (located in Laguna Mobile Home Park)
- Security: Smoke detector; Carbon monoxide detector
- Utilities: Standard electric service; Natural gas connected; Water connected (district/public); Public sewer / sewer connected; Telephone in street; Cable available
- Home design: Single-story; One entry level; Mobile home (model: Westwood, approx. 56' x 24'); Has a view
- Construction: Masonite siding/skirt; Composition/shingle roof; Pillar/post/pier foundation with pier jacks
- Exterior features: Wood deck/patio; Shed; Wire fencing; Treed lot, rectangular and level/flat; Secluded setting; Community pool
Interior
- Kitchen: Formica counters; Kitchen open to family room; Garbage disposal; Refrigerator; Gas range; Dishwasher; Water heater unit
- Bedrooms: Primary bedroom; Primary suite; Main floor primary bedroom; All bedrooms on main floor; Main floor bedroom
- Flooring: Carpet; Laminate
- Bathrooms: One full bathroom; One 3/4 bathroom; Bathtub and shower; Shower in tub
- Heating & cooling: Natural gas heating; Central furnace; Wall/window cooling
- Interior features: Partially furnished; High ceilings (9 feet+); Living room deck attached; Formica counters; Double pane windows; No interior steps; Community spa
- Laundry & utility: Separate laundry room; Washer included; Dryer included
Neighborhood map
What this means for you Summary
Snapshot
- This is a 3-bed/2.0-bath manufactured listed at $465k.
Deal economics
- At list price, monthly cash flow is $-251 ($-3k/yr) — negative.
- To cash-flow at today's rent, offer at most $429k (7.8% below list).
- To meet the 1% rule (rent ≥ 1% of price), the offer needs to be $375k (19.4% below list).
- Recommended offer: $375k (19.4% below list) — sets the bar for 1% rule.
- Cap rate 5.6% vs local median 2.1% in San Luis Obispo — top-decile yield for the area; either an underpriced asset or a hidden risk that comps aren't pricing in. Stress-test before assuming the spread holds.
Location & tenants
- Location reads 74/100 on livability (#132 in CA, #4,576 nationally) — a middle-class / working-renter tenant base. Strengths: amenities A+, commute A+, health & safety A+; Watch: crime F, cost of living F.
- San Luis Coastal Unified (urban): math 50% / reading 58% proficiency, ranked #118 of 517 in CA (top 23%) — acceptable for families but not a draw, mixed tenant base, ~2y average lease.
- Zoned schools: Laguna Middle (math 57% / reading 65%, grade B+, #57 of 498 statewide, top 12%, 789 students, 30% FRL); San Luis Obispo High (math 47% / reading 67%, grade C, #234 of 1,170 statewide, top 21%, 1,644 students, 27% FRL) — zoned schools at 28% FRL track the district average.
- Market conditions: Rents rising fast (+7.0%/yr); 51 active listings in the ZIP; 13 comparable units currently listed for rent nearby; rentals at typical pace (median 22d on market — plan ~3-4 weeks tenant-placement turnaround); 46% of comp listings sitting > 30 days — soft ceiling on asking rent; 1,104 units permitted in San Luis Obispo County in 2024 (273 in 5+ unit buildings).
- At $3,750/mo this rent would consume 75% of the median local household income ($60k/yr) (locally 3368% of renters already pay >50% of income on rent) — very limited rent-growth headroom before tenants either downsize or default.
Forward outlook
- Local home prices are declining (-3.0%/yr); year-one equity from $3k of loan paydown is wiped out by about $14k of value loss. Plan a longer hold.
- San Luis Obispo County population projected at +20% by 2050 — long-run rental-demand tailwind backs the buy-and-hold thesis.
Negotiation context
- Only 1 days on market — expect competitive offers; lowballing is unlikely to land.
- 6 sale attempts since 28y ago; this cycle's ask is 98% above the opening price — seller raised mid-cycle; expect resistance to lowballs.
- Current owner paid $234k; list at $465k implies a 99% gain — meaningful room to come down on a strong offer.
Risks & watch-outs
- Climate carrying-cost: moderate wildfire risk — expect insurance premiums to compound above CPI over the hold.
Questions for the listing agent
- What do current leases actually rent for vs. the listed asking? Can we see a recent rent roll and the last 12 months of T-12 income?
- Is there a deadline driving the sale (1031 exchange, divorce, estate, relocation)? That informs how much negotiation room exists.
- Schools are B-rated — typically a magnet for longer-tenancy family renters. What's the average tenant stay here, and is there a school-zone premium baked into asking?
- Crime grade is F in this area — have there been break-ins, vandalism, or insurance claims at this property in the last 3 years? What carrier currently insures it and at what premium?
- The area grade is low — what's the realistic commute time and amenity access for the typical tenant pool here? Any planned neighborhood developments (good or bad) we should know about?
- What's the average days-on-market for RENTAL listings here right now (not sales)? A rising rental-DOM trend means longer vacancies and softer asking-rent achievability than the comps imply.
- What's the recent tenant-quality profile in this submarket — average credit score on applications, eviction rate, late-payment / NSF rate, and stable-employment percentage? A property-management company in the area should have these aggregated.
- How much new for-sale + rental construction is in the pipeline within 1–3 miles? Heavy new supply typically softens prices + rents 12–24 months out; constrained supply supports both.
Investment metrics
- 1% rule
- 0.81% ✗
- Cap rate
- 5.65%
- Cash-on-cash
- -2.31%
- DSCR
- 0.90
- GRM
- 10.3
CMA / ARV
- ARV (on-the-fly)
- $417,150
- Comps found
- 12
Show comp detail 12 sales within ~0.75 mi
| Address | Dist | Beds/Ba | Sqft | Sold | Price | $/sf | Match |
|---|---|---|---|---|---|---|---|
| 1029 Ilene Dr #195 | 0.08mi | 3/2.0 | 1,364 (+1%) | 8mo | $456,000 | $334 | 88 |
| 1845 Thelma Dr #59 | 0.04mi | 3/2.0 | 1,260 (-7%) | 0mo | $295,000 | $234 | 87 |
| 1000 Stephanie Dr | 0.29mi | 3/2.0 | 1,407 (+4%) | 0mo | $545,000 | $387 | 79 |
| 1700 Lynn Dr | 0.14mi | 2/2.0 (-1) | 1,368 (+1%) | 14mo | $276,000 | $202 | 74 |
| 1700 Lynn Dr #123 | 0.14mi | 2/2.0 (-1) | 1,368 (+1%) | 14mo | $276,000 | $202 | 74 |
| 1028 Jane Dr | 0.09mi | 2/2.0 (-1) | 1,296 (-4%) | 13mo | $379,000 | $292 | 73 |
| 1637 Gathe Dr #32 | 0.15mi | 2/2.0 (-1) | 1,296 (-4%) | 18mo | $400,000 | $309 | 67 |
| 1049 Jean Dr | 0.11mi | 2/2.0 (-1) | 1,440 (+7%) | 19mo | $220,000 | $153 | 63 |
| 1828 Thelma Dr | 0.10mi | 2/2.0 (-1) | 1,248 (-8%) | 21mo | $419,000 | $336 | 60 |
| 1020 Stephanie | 0.27mi | 2/2.5 (-1) | 1,400 (+4%) | 17mo | $530,000 | $379 | 60 |
| 1029 Kerry Dr #53 | 0.22mi | 2/2.0 (-1) | 1,284 (-5%) | 22mo | $441,000 | $343 | 59 |
| 1901 Claire Dr | 0.05mi | 3/2.0 | 1,540 (+14%) | 23mo | $377,500 | $245 | 55 |
Match score weights: distance 35% · size 25% · config 20% · recency 20%. Top-matched comps best support the ARV.
Projected returns pro-forma
-3.0% appreciation · 6.97% rent growth · sell at horizon
- IRR
- -15.8%
- Equity multiple
- 0.42×
- Total profit
- $-75,696
- Equity at exit
- $69,333
- IRR
- -1.6%
- Equity multiple
- 0.87×
- Total profit
- $-16,885
- Equity at exit
- $40,205
Cash invested: $130,200 (down + closing). Projections, not guarantees.
Landlord ↔ Tenant lean methodology
- Overall (STATE)
- 18 Strongly Tenant-Friendly
- State California
- 18 Strongly Tenant-Friendly · D+13
- County
- — inherits STATE
- City
- — inherits STATE
ZIP-level market 93405
- Rents YoY
- 7.0%
- Active inventory
- 51
- Price-to-rent
- 10.3×
Monthly cashflow live
- Estimated rent
- $3,750 high interval (Pro) →
- Mortgage (P&I)
- −$2,439
- Tax est. 1.5%
- −$581 /mo · $6,975/yr
- Insurance
- −$194
- HOA
- −$0
- Vacancy / Maint / Mgmt
- −$788
- Net cashflow
- $-251
Break-even live
Sensitivity live
| Price | -10% $70 | -5% $-90 | +0% $-251 | +5% $-412 | +10% $-572 |
|---|---|---|---|---|---|
| Rent | -10% $-547 | -5% $-399 | +0% $-251 | +5% $-103 | +10% $45 |
| Rate | -1.0pp $-17 | -0.5pp $-133 | base $-251 | +0.5pp $-371 | +1.0pp $-494 |
UW: 25.0% down · 7.5% · 30yr · 1.5% tax · 5.0% vac · 8.0% maint · 8.0% mgmt
Financing live
Cash to close
- Down payment
- $116,250
- Closing costs
- $13,950
- Reserves months
- —
- Total cash needed
- —
Loan-product check · same deal, 3 products live
Conventional
25% down · 7.5% · 30yr
- Down + closing
- —
- Monthly P&I
- —
- Monthly cashflow
- —
- DSCR
- —
- Eligible?
- —
Personal DTI + credit; lowest rate.
DSCR
20% down · 8.5% · 30yr
- Down + closing
- —
- Monthly P&I
- —
- Monthly cashflow
- —
- DSCR
- —
- Eligible?
- —
No personal income docs; deal must DSCR.
Hard money
10% down · 12.0% · 12mo
- Down + closing
- —
- Monthly P&I
- —
- Monthly cashflow
- —
- DSCR
- —
- Eligible?
- —
Short-term bridge; refi at stabilization.
Rent comps 13 comps
| Address | Beds | Baths | Sqft | Rent | $/sqft | DOM | Units | Dist |
|---|---|---|---|---|---|---|---|---|
| 1559 Royal Way Unit NA San Luis Obispo, CA | 4.0 | 2.0 | 1800 | $4,900 | $2.72 | 22d | 1 | 0.37mi |
| 11343 Los Osos Valley Rd Unit 4855-F San Luis Obispo, CA | 2.0 | 1.5 | 900 | $2,400 | $2.67 | 14d | 1 | 0.41mi |
| 11343 Los Osos Valley Rd Unit 4843-B San Luis Obispo, CA | 2.0 | 1.5 | 900 | $2,400 | $2.67 | 44d | 1 | 0.41mi |
| 11343 Los Osos Valley Rd Unit 48-21G San Luis Obispo, CA | 3.0 | 2.0 | 1225 | $3,200 | $2.61 | 44d | 1 | 0.41mi |
| 11343 Los Osos Valley Rd Unit 48-25D San Luis Obispo, CA | 2.0 | 2.0 | 1025 | $2,600 | $2.54 | 44d | 1 | 0.41mi |
| 11343 Los Osos Valley Rd Unit 48-55G San Luis Obispo, CA | 2.0 | 1.5 | 900 | $2,400 | $2.67 | 22d | 1 | 0.41mi |
| 1545 Descanso St San Luis Obispo, CA | 4.0 | 2.0 | 1560 | $4,400 | $2.82 | 14d | 1 | 0.42mi |
| 1704 Tonini Dr San Luis Obispo, CA | 1.0–2.0 | 1.0–2.5 | 985 | $3,445 | $3.50 | 14d | 3 | 0.58mi |
| 925 Madonna Rd #302 San Luis Obispo, CA | 3.0 | 2.0 | 1075 | $3,500 | $3.26 | 22d | 1 | 1.05mi |
| 905 Madonna Rd San Luis Obispo, CA | 3.0 | 3.0–3.5 | 1459 | $4,825 | $3.31 | 14d | 2 | 1.06mi |
| 915 Madonna Rd #102 San Luis Obispo, CA | 3.0 | 2.0 | 1141 | $1,685 | $1.48 | 44d | 1 | 1.07mi |
| 825 Madonna Rd San Luis Obispo, CA | 2.0 | 2.0 | 949 | $3,000 | $3.16 | 44d | 1 | 1.10mi |
| 1824 Homestead Pl San Luis Obispo, CA | 4.0 | 3.5 | 1869 | $5,300 | $2.84 | 44d | 1 | 1.20mi |
Listing history 3 events
-
2026-06-18status $465,000 Active 1 DOM
-
2026-06-17remarks 693-char remark
-
2026-06-17$465,000 Coming Soon 1 DOM
ⓘ Source: listings_history table (triggers on properties + properties_extension) + one-shot
backfill from property_details.listing_events for pre-trigger history.
Climate risk First Street
- Flood 1/10 Low FEMA zone X (unshaded) · 0% chance over 30 yrs
- Wildfire 5/10 Major
- Heat 4/10 Moderate 5 d/yr ≥81°F today · 14 d/yr by 30 yrs out
- Wind 1/10 Low
- Air quality 6/10 Major 11 unhealthy d/yr today · 11 by 30 yrs out
Nearby sold comps map
Loading sold comps map…
Walkable amenities ~0.75 mi
Loading nearby amenities…
Taxation est. · year 1
- Rental income
- $45,002
- − Mortgage interest
- −$26,047
- − Property taxes
- −$6,975
- − Insurance
- −$2,325
- − Repairs & maintenance
- −$3,600
- − Management
- −$3,600
- − Depreciation
- −$13,527
- Taxable loss
- −$11,073
- Est. tax savings @ 24.0%
- +$2,658
- After-tax cash flow
- $-353/yr
For passive investors: Depreciation is non-cash, so a rental often shows a tax loss while cash-flowing — sheltering income. Rental losses are passive: they offset passive income freely, and up to $25,000/yr can offset ordinary (W-2) income if you actively participate and your MAGI is under $100k (phasing out to $0 by $150k); unused losses carry forward. On sale, claimed depreciation is recaptured at up to 25%, and gains may owe capital-gains tax (a 1031 exchange can defer both). Figures are a year-1 estimate at your 24.0% rate — not tax advice; consult a CPA.
Schools (NCES district)
- District
- San Luis Coastal Unified
- NCES district ID
- 0634800
- Math proficiency
- 50% ▼ -14.00%
- Reading proficiency
- 58% ▼ -12.00%
- Median HH income
- $53,428
- Composite
- 46.4/100
- National rank
- #2455
- State rank
- #118 of 517 in CA
Livability — San Luis Obispo
- Score
- 74/100
- State rank
- #132
- US rank
- #4576
Category grades
Schools grade is shown separately in the Schools card above.
Census & demographics
- Census place
- San Luis Obispo, CA
- County
- San Luis Obispo County · 224,651 people
- City population
- 54,204
- Metro
- San Luis Obispo-Paso Robles, CA
- Population (ZIP)
- 25,002
- Household income
- $60,399
- Rent vs Own
- Severe rent burden
- 3368.0
Population outlook (San Luis Obispo County) Hauer SSP2
- Today (2025)
- 306,977 people
- By 2030
- 320,378 · +4.4%
- By 2040
- 343,933 · +12.0%
- By 2050
- 366,853 · +19.5%
- By 2075
- 428,329 · +39.5%
- By 2100
- 460,687 · +50.1%
Race, ethnicity, and origin ACS 2023
- Neighborhood character
- Predominantly White (72%)
- Race & ethnicity
- White 72% Hispanic / Latino 15% Two or more races 10% Asian 6% Black 1%
- Hispanic origin (detail)
- Mexican 11%
- Common ancestry
- Italian 4% Lithuanian 2% Portuguese 2%
- Foreign-born
- 6% · Canada, China
- Languages at home
- 84% English-only · Spanish 8% Other Indo-European 2% Chinese 1%
Political lean MEDSL · San Luis Obispo
- 2024 margin
- D (+10.9) · D 53.9% · R 43.1% · Other 3.0%
- 2008→2024 swing
- +5.5pp toward D · 2008: 5.4pp · 2024: 10.9pp
- All cycles
- 2024: D+10.9 2020: D+13.1 2016: D+8.3 2012: D+1.0 2008: D+5.4
Not yet ingested
- Civics
- —
Market trends
- HPI YoY
- ▼ -840.08%
- Current HPI
- 379.5701
- Rent YoY
- ▲ 6.97%
- Metro
- San Luis Obispo-Paso Robles, CA
- State GDP YoY
- ▲ 3.21%
- F500 in state
- 116
Industry mix (Fortune 500 HQ in CA)
| Industry | F500 HQs | Revenue |
|---|---|---|
| Technology | 27 | $1,492B |
|
||
| Financial Services | 3 | $174B |
|
||
| Retail | 3 | $44B |
|
||
| Insurance | 3 | $26B |
|
||
| Media / Entertainment | 2 | $115B |
|
||
| Pharmaceuticals / Biotech | 2 | $62B |
|
||
Price history
+1760.0% since first listed14 events — show timeline
- 2026-06-17 Coming Soon $465,000 CRMLS
- 2015-07-29 Sold (MLS) $233,500 CRMLS
- 2015-07-29 Listing Removed — NSBCRMLS
- 2015-04-27 Listing Removed — CRMLS
- 2015-04-21 Listed $235,000 CRMLS
- 2015-04-10 Listed $235,000 NSBCRMLS
- 2010-10-01 Listing Removed — NSBCRMLS
- 2010-10-01 Sold (MLS) $185,000 CRMLS
- 2009-12-04 Listed $189,999 NSBCRMLS
- 2009-12-04 Listed $189,999 CRMLS
- 1998-09-15 Listing Removed — NSBCRMLS
- 1998-09-15 Sold (MLS) $17,500 CRMLS
- 1998-06-09 Listed $25,000 NSBCRMLS
- 1998-06-09 Listed $25,000 CRMLS
Cash-flow waterfall
monthlySold comps — $/sqft
last 12 mo · ≤1 miLoading sold comps…