 Multi-family
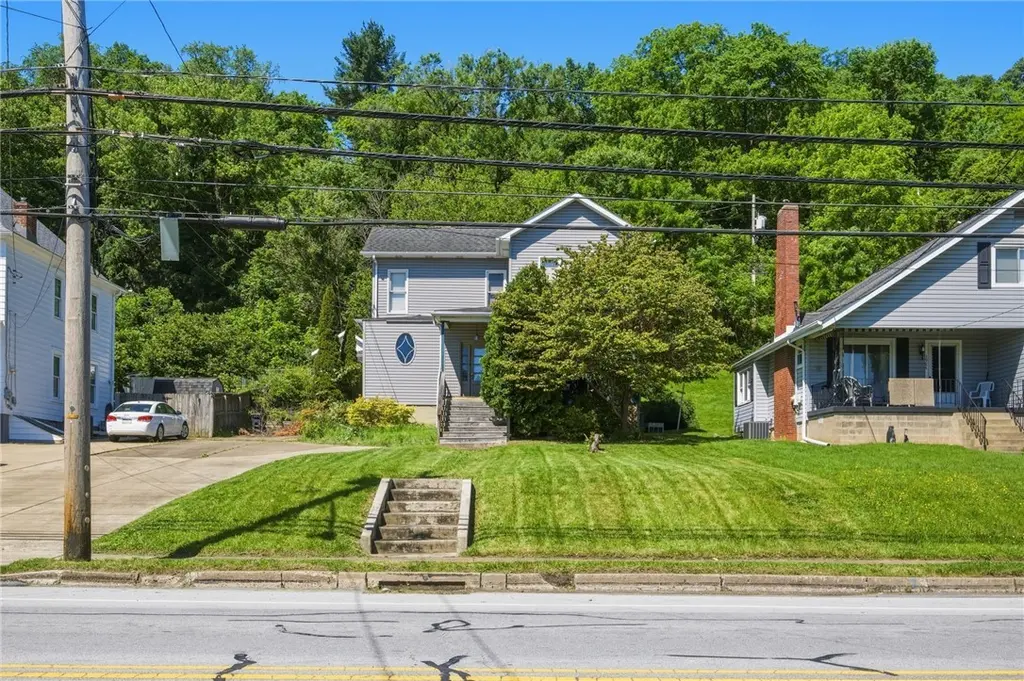
3988 Jordan St · South Heights, PA
Flood risk 1/10 · Minimal
- FEMA flood zone
- X (unshaded)
- Chance of flooding over 30 yrs
- 0.0%
- Est. flood insurance / yr
- $473 – $860
Fire risk 1/10 · Minimal
- Est. fire insurance / yr
- $511 – $949
Heat risk 4/10 · Minor
- Hot days now (above 97°F)
- 7 days/yr
- Hot days in 30 yrs
- 18 days/yr
Wind risk 2/10 · Minimal
- Chance of severe wind over 30 yrs
- —
Air-quality risk 3/10 · Minor
- Unhealthy air days now
- 2 days/yr
- Unhealthy air days in 30 yrs
- 3 days/yr
Risk factors via First Street. Map © Google.
Why this score? — see what drove the B- grade
The composite is a weighted blend of 9 inputs, each scored 0–100. Each bar is that input's sub-score; the figure is the points it added to the 100-point composite (weight × sub-score).
- Cash flow +25.1/30.0
- Appreciation +8.7/10.0
- DSCR +8.2/10.0
- ARV discount +7.5/15.0
- 1% rule +7.3/10.0
- Livability +3.9/5.0
- Schools +3.1/10.0
- Rent growth +2.5/5.0
- Condition / age +2.5/5.0
$110,000
🖨 Deal sheet (PDF) 📄 Offer letter ✓ Due diligence
Multi-family units
County records classify this as Multi-Family (2-4 Unit). Listing-text estimate: 1 unit. estimate disagrees with records
Listing remarks
Fully vacant duplex ready for its next owner! A great opportunity for investors or owner-occupants to set their own rents and build equity. Features include off-street parking, a spacious lot, basement storage, and separate living spaces. Conveniently located with easy access to major roadways, shopping, dining, and Pittsburgh International Airport. Bring your vision and unlock this property's potential!
Key facts
- Spacious lot
- Basement storage
- Off-street parking
Tags
Property features AI
Exterior
- Parking: Four parking spaces
- Utilities: Public water; Public sewer
- Home design: Two-story home; Vinyl siding; Asphalt roof
- Construction: Vinyl siding construction; Asphalt roof
- Exterior features: Property is a resale
Interior
- Flooring: Carpet; Vinyl
- Bathrooms: Two full bathrooms
- Interior features: Carpet and vinyl flooring
Neighborhood map
What this means for you Summary
Snapshot
- This is a 5-bed/2.0-bath multifamily listed at $110k.
Deal economics
- At list price, monthly cash flow is $243 ($3k/yr) — positive.
- The deal already cash-flows at list — no discount required.
- Meets the 1% rule at list price ($1k rent vs $110k).
- Recommended offer: $108k (1.5% below list) — sets the bar for market timing.
- Cap rate 8.9% vs local median 3.2% in South Heights — top-decile yield for the area; either an underpriced asset or a hidden risk that comps aren't pricing in. Stress-test before assuming the spread holds.
Location & tenants
- Location reads 77/100 on livability (#368 in PA, #3,206 nationally) — a middle-class / working-renter tenant base. Strengths: crime A+, cost of living A+, housing A+; Watch: schools F, amenities F, health & safety F.
- Ambridge Area SD (suburban): math 23% / reading 48% proficiency, ranked #408 of 539 in PA (top 76%) — families likely to look elsewhere, expect single-tenant / working-renter base with shorter leases.
- Market conditions: 4 active listings in the ZIP; 272 units permitted in Beaver County in 2024 (80 in 5+ unit buildings).
Forward outlook
- In year one you build about $9k of equity ($761 loan paydown + $8k appreciation (7.4% local appreciation)).
- Beaver County population projected at -14% by 2050 — secular population decline; favor cash flow + early exit over multi-decade hold.
- At projected returns (7.4% appreciation + 3.0% rent growth), your $31k cash investment doubles in ~3 years — after that, you're playing with house money.
- By year 4, paydown + projected appreciation supports a ~$31k cash-out refi (75% LTV) — recoverable capital for the next deal without selling this one.
Negotiation context
- It's been on market 20 days — a 2% lower offer ($108k) is reasonable based on typical stale-listing flexibility.
Risks & watch-outs
- Watch-outs: built in 1910 — expect roof / HVAC / electrical / plumbing capex.
Questions for the listing agent
- Built in 1910 — when were the roof, HVAC, electrical panel, plumbing, and water heater last replaced?
- Is there a deadline driving the sale (1031 exchange, divorce, estate, relocation)? That informs how much negotiation room exists.
- Schools are F-rated, which usually means shorter tenancies and higher turnover. Who's the typical renter profile here, and what's been the actual vacancy rate?
- What's the average days-on-market for RENTAL listings here right now (not sales)? A rising rental-DOM trend means longer vacancies and softer asking-rent achievability than the comps imply.
- What's the recent tenant-quality profile in this submarket — average credit score on applications, eviction rate, late-payment / NSF rate, and stable-employment percentage? A property-management company in the area should have these aggregated.
- How much new apartment / multifamily construction is in the pipeline within 1–3 miles? Heavy new supply (>2% of stock underway) typically softens rents 12–24 months out; light construction supports rent growth.
Investment metrics
- 1% rule
- 1.23% ✓
- Cap rate
- 8.94%
- Cash-on-cash
- 9.45%
- DSCR
- 1.42
- GRM
- 6.7
CMA / ARV
No comps found within radius.
Projected returns pro-forma
7.39% appreciation · 3.0% rent growth · sell at horizon
- IRR
- 26.1%
- Equity multiple
- 2.84×
- Total profit
- $56,552
- Equity at exit
- $79,020
- IRR
- 23.8%
- Equity multiple
- 5.96×
- Total profit
- $152,745
- Equity at exit
- $152,702
Cash invested: $30,800 (down + closing). Projections, not guarantees.
Landlord ↔ Tenant lean methodology
- Overall (STATE)
- 62 Landlord-Friendly
- State Pennsylvania
- 62 Landlord-Friendly · EVEN
- County
- — inherits STATE
- City
- — inherits STATE
ZIP-level market 15081
- Home prices YoY
- 1.9%
- Active inventory
- 4
- Price-to-rent
- 6.7×
Monthly cashflow live
- Estimated rent
- $1,358 medium interval (Pro) →
- Mortgage (P&I)
- −$577
- Tax from tax record
- −$208 /mo · $2,491/yr
- Insurance
- −$46
- HOA
- −$0
- Vacancy / Maint / Mgmt
- −$285
- Net cashflow
- $243
Break-even live
Sensitivity live
| Price | -10% $305 | -5% $274 | +0% $243 | +5% $211 | +10% $180 |
|---|---|---|---|---|---|
| Rent | -10% $135 | -5% $189 | +0% $243 | +5% $296 | +10% $350 |
| Rate | -1.0pp $298 | -0.5pp $271 | base $243 | +0.5pp $214 | +1.0pp $185 |
UW: 25.0% down · 7.5% · 30yr · 1.5% tax · 5.0% vac · 8.0% maint · 8.0% mgmt
Financing live
Cash to close
- Down payment
- $27,500
- Closing costs
- $3,300
- Reserves months
- —
- Total cash needed
- —
Loan-product check · same deal, 3 products live
Conventional
25% down · 7.5% · 30yr
- Down + closing
- —
- Monthly P&I
- —
- Monthly cashflow
- —
- DSCR
- —
- Eligible?
- —
Personal DTI + credit; lowest rate.
DSCR
20% down · 8.5% · 30yr
- Down + closing
- —
- Monthly P&I
- —
- Monthly cashflow
- —
- DSCR
- —
- Eligible?
- —
No personal income docs; deal must DSCR.
Hard money
10% down · 12.0% · 12mo
- Down + closing
- —
- Monthly P&I
- —
- Monthly cashflow
- —
- DSCR
- —
- Eligible?
- —
Short-term bridge; refi at stabilization.
Listing history 14 events
-
2026-06-21days on market $110,000 Active 20 DOM
-
2026-06-18days on market $110,000 Active 17 DOM
-
2026-06-17days on market $110,000 Active 16 DOM
-
2026-06-16pricedays on market $110,000 Active 15 DOM
-
2026-06-15days on market $150,000 Active 14 DOM
-
2026-06-13days on market $150,000 Active 12 DOM
-
2026-06-13days on market $150,000 Active 11 DOM
-
2026-06-10price $150,000 Active 8 DOM
-
2026-06-09days on market $155,000 Active 8 DOM
-
2026-06-08days on market $155,000 Active 7 DOM
-
2026-06-07days on market $155,000 Active 6 DOM
-
2026-06-03days on market $155,000 Active 2 DOM
-
2026-06-02remarks 407-char remark
-
2026-06-02$155,000 Active 1 DOM
ⓘ Source: listings_history table (triggers on properties + properties_extension) + one-shot
backfill from property_details.listing_events for pre-trigger history.
Tax reassessment forecast PA · Partial reset (capped growth)
- Current annual tax
- $2,491 · $208/mo
- Projected year-2 tax
- $2,491 · $208/mo
- Expected delta
- $0/yr ($0/mo · 0.0%)
ⓘ Screening estimate from a state-policy table — verify with the county assessor before closing.
Climate risk First Street
- Flood 1/10 Low FEMA zone X (unshaded) · 0% chance over 30 yrs
- Wildfire 1/10 Low
- Heat 4/10 Moderate 7 d/yr ≥97°F today · 18 d/yr by 30 yrs out
- Wind 2/10 Low
- Air quality 3/10 Moderate 2 unhealthy d/yr today · 3 by 30 yrs out
Nearby sold comps map
Loading sold comps map…
Walkable amenities ~0.75 mi
Loading nearby amenities…
Taxation est. · year 1
- Rental income
- $16,296
- − Mortgage interest
- −$6,162
- − Property taxes
- −$2,491
- − Insurance
- −$550
- − Repairs & maintenance
- −$1,304
- − Management
- −$1,304
- − Depreciation
- −$3,200
- Taxable income
- $1,287
- Est. tax owed @ 24.0%
- −$309
- After-tax cash flow
- $2,603/yr
For passive investors: Depreciation is non-cash, so a rental often shows a tax loss while cash-flowing — sheltering income. Rental losses are passive: they offset passive income freely, and up to $25,000/yr can offset ordinary (W-2) income if you actively participate and your MAGI is under $100k (phasing out to $0 by $150k); unused losses carry forward. On sale, claimed depreciation is recaptured at up to 25%, and gains may owe capital-gains tax (a 1031 exchange can defer both). Figures are a year-1 estimate at your 24.0% rate — not tax advice; consult a CPA.
Schools (NCES district)
- District
- Ambridge Area SD
- NCES district ID
- 4202440
- Math proficiency
- 23% ▼ -12.00%
- Reading proficiency
- 48% ▼ -10.00%
- Median HH income
- $49,514
- Composite
- 30.62/100
- National rank
- #6190
- State rank
- #408 of 539 in PA
Livability — South Heights
- Score
- 77/100
- State rank
- #368
- US rank
- #3206
Category grades
Schools grade is shown separately in the Schools card above.
Census & demographics
- Census place
- South Heights, PA
- City population
- 343
- Population (ZIP)
- 343
Population outlook (Beaver County) Hauer SSP2
- Today (2025)
- 164,976 people
- By 2030
- 161,449 · -2.1%
- By 2040
- 151,752 · -8.0%
- By 2050
- 141,155 · -14.4%
- By 2075
- 118,142 · -28.4%
- By 2100
- 91,740 · -44.4%
Race, ethnicity, and origin ACS 2023
- Neighborhood character
- Predominantly White (86%)
- Race & ethnicity
- White 86% Two or more races 11% Black 3% Hispanic / Latino 2%
- Common ancestry
- Slovak 9% Lithuanian 5% Scotch-Irish 4%
- Foreign-born
- 1% · Canada
Political lean MEDSL · Beaver
- 2024 margin
- Strong R (+20.7) · D 39.2% · R 59.9%
- 2008→2024 swing
- -17.9pp toward R · 2008: -2.8pp · 2024: -20.7pp
- All cycles
- 2024: R+20.7 2020: R+17.7 2016: R+20.1 2012: R+6.6 2008: R+2.8
Not yet ingested
- Civics
- —
Market trends
- HPI YoY
- ▲ 7.39%
- Current HPI
- 403.599
- Rent YoY
- —
- Metro
- —
- State GDP YoY
- ▲ 1.68%
- F500 in state
- 34
Industry mix (Fortune 500 HQ in PA)
| Industry | F500 HQs | Revenue |
|---|---|---|
| Healthcare | 2 | $309B |
|
||
| Insurance | 2 | $27B |
|
||
| Telecommunications / Media | 1 | $124B |
|
||
| Industrial Distribution | 1 | $22B |
|
||
| Financial Services | 1 | $20B |
|
||
| Chemicals / Materials | 1 | $18B |
|
||
Price history
+384.4% since first listed3 events — show timeline
- 2026-06-01 Listed $155,000 West Penn MLS
- 2007-04-20 Sold (Public Records) $115,000 Public Records
- 1985-09-27 Sold (Public Records) $32,000 Public Records
Property tax history
-0.5%/yrLatest (2026): $2,491 · +0.0% YoY. Source: county tax records.
Cash-flow waterfall
monthlySold comps — $/sqft
last 12 mo · ≤1 miLoading sold comps…