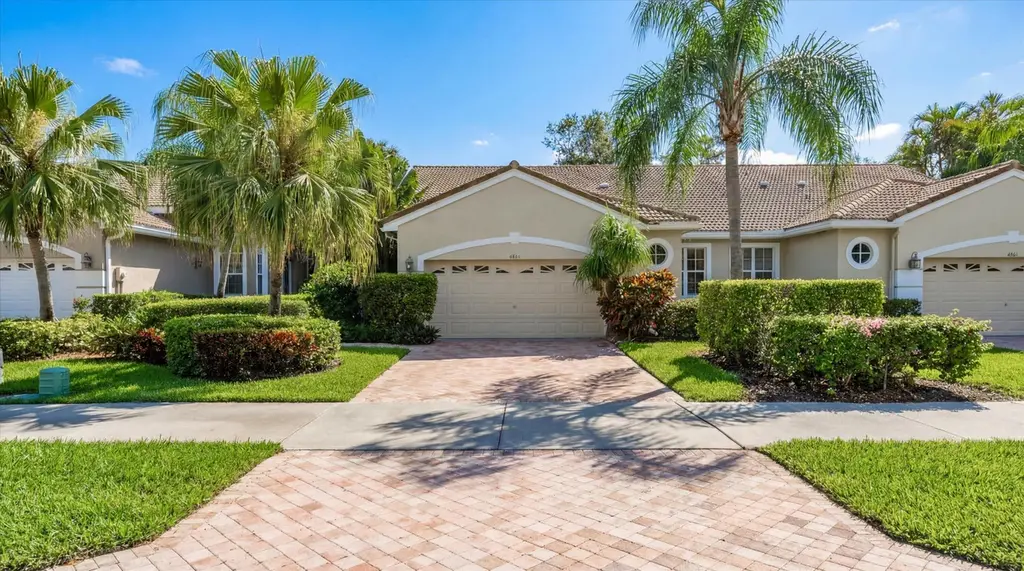
4681 Carlton Golf Dr · Wellington, FL
Flood risk 1/10 · Minimal
- FEMA flood zone
- X (unshaded)
- Chance of flooding over 30 yrs
- 0.0%
- Est. flood insurance / yr
- $507 – $1,088
Fire risk 1/10 · Minimal
- Est. fire insurance / yr
- $947 – $1,759
Heat risk 9/10 · Severe
- Hot days now (above 106°F)
- 7 days/yr
- Hot days in 30 yrs
- 25 days/yr
Wind risk 10/10 · Severe
- Chance of severe wind over 30 yrs
- 99.0%
Air-quality risk 2/10 · Minimal
- Unhealthy air days now
- 0 days/yr
- Unhealthy air days in 30 yrs
- 2 days/yr
Risk factors via First Street. Map © Google.
Why this score? — see what drove the C- grade
The composite is a weighted blend of 9 inputs, each scored 0–100. Each bar is that input's sub-score; the figure is the points it added to the 100-point composite (weight × sub-score).
- Cash flow +14.7/30.0
- ARV discount +7.5/15.0
- 1% rule +6.2/10.0
- Appreciation +4.7/10.0
- DSCR +4.5/10.0
- Schools +4.3/10.0
- Livability +3.7/5.0
- Rent growth +2.5/5.0
- Condition / age +2.5/5.0
$315,000
🖨 Deal sheet 📄 Offer letter ✓ Due diligence
Listing remarks
A rare opportunity with the option to purchase a silver (social) membership. Beautifully renovated and impeccably maintained villa in Wycliffe Golf & Country Club, offering effortless, move-in ready living. The thoughtfully updated kitchen is both stylish and functional, complete with granite countertops, a designer tile backsplash, and new stainless steel appliances. Step outside to a your covered and screened lanai, perfect for relaxing or entertaining while enjoying your own private, landscaped setting. This villa offers a peaceful and private atmosphere. This home is ready for immediate enjoyment! Schedule your showing today. This home is located within Wycliffe Golf & Count
Key facts
- Updated kitchen
- Granite countertops
- Renovated villa
Tags
Neighborhood map
What this means for you Summary
Snapshot
- This is a 2-bed/2.0-bath single-family listed at $315k.
Deal economics
- At list price, monthly cash flow is $81 ($973/yr) — positive.
- The deal already cash-flows at list — no discount required.
- Meets the 1% rule at list price ($4k rent vs $315k).
- Cap rate 6.6% vs local median 3.4% in Wellington — top-decile yield for the area; either an underpriced asset or a hidden risk that comps aren't pricing in. Stress-test before assuming the spread holds.
Location & tenants
- Location reads 73/100 on livability (#294 in FL, #4,986 nationally) — a middle-class / working-renter tenant base. Strengths: crime A+, employment A+, housing A+; Watch: amenities F, commute F, cost of living F.
- Palm Beach (suburban): math 46% / reading 53% proficiency, ranked #34 of 73 in FL (top 47%) — families likely to look elsewhere, expect single-tenant / working-renter base with shorter leases.
- Zoned schools: Panther Run Elementary School (math 85% / reading 82%, grade A+, #60 of 2,144 statewide, top 3%, 787 students, 19% FRL); Polo Park Middle School (math 65% / reading 68%, grade A-, #84 of 571 statewide, top 16%, 1,156 students, 33% FRL); Palm Beach Central High School (math 42% / reading 55%, grade D, #198 of 667 statewide, top 30%, 2,980 students, 40% FRL) — zoned schools average 31% FRL vs 52% district-wide (21 pts lower); this property's tenant base skews higher-income than the district average.
- Zoned-school proficiency averages 66% at this address vs 50% district-wide (+17 pts) — the actual schools serving this property are materially stronger than the Palm Beach average implies; a family-tenant draw the district grade alone would hide.
- Market conditions: 168 active listings in the ZIP; 26 comparable units currently listed for rent nearby; rentals at typical pace (median 25d on market — plan ~3-4 weeks tenant-placement turnaround); 3,974 units permitted in Palm Beach County in 2024 (1,012 in 5+ unit buildings).
Forward outlook
- In year one you build about $52 of equity ($2k loan paydown + $-2k appreciation (-0.7% local appreciation)).
- Palm Beach County population projected at +30% by 2050 — long-run rental-demand tailwind backs the buy-and-hold thesis.
Negotiation context
- Only 13 days on market — expect competitive offers; lowballing is unlikely to land.
- 5 sale attempts since 8y ago with the ask held roughly flat each time — persistent listings suggest the price (not the market) is what's stuck; bring a comps-based counter.
- Current owner paid $200k; list at $315k implies a 57% gain — meaningful room to come down on a strong offer.
Risks & watch-outs
- Watch-outs: HOA is 20% of rent.
- Climate carrying-cost: severe wind risk, 99% chance of damaging wind over 30y; extreme-heat days projected 7→25/yr by 2055 (HVAC capex compounding) — expect insurance premiums to compound above CPI over the hold.
Questions for the listing agent
- What does the HOA fee cover, when was the last increase, and are there any pending special assessments or reserve-fund shortfalls?
- Is there a deadline driving the sale (1031 exchange, divorce, estate, relocation)? That informs how much negotiation room exists.
- Schools are A-rated — typically a magnet for longer-tenancy family renters. What's the average tenant stay here, and is there a school-zone premium baked into asking?
- What's the average days-on-market for RENTAL listings here right now (not sales)? A rising rental-DOM trend means longer vacancies and softer asking-rent achievability than the comps imply.
- What's the recent tenant-quality profile in this submarket — average credit score on applications, eviction rate, late-payment / NSF rate, and stable-employment percentage? A property-management company in the area should have these aggregated.
- How much new for-sale + rental construction is in the pipeline within 1–3 miles? Heavy new supply typically softens prices + rents 12–24 months out; constrained supply supports both.
Investment metrics
- 1% rule
- 1.12% ✓
- Cap rate
- 6.60%
- Cash-on-cash
- 1.10%
- DSCR
- 1.05
- GRM
- 7.4
CMA / ARV
No comps found within radius.
Projected returns pro-forma
-0.67% appreciation · 3.0% rent growth · sell at horizon
- IRR
- -3.4%
- Equity multiple
- 0.85×
- Total profit
- $-13,531
- Equity at exit
- $80,979
- IRR
- 3.1%
- Equity multiple
- 1.31×
- Total profit
- $26,926
- Equity at exit
- $89,322
Cash invested: $88,200 (down + closing). Projections, not guarantees.
Landlord ↔ Tenant lean methodology
- Overall (STATE)
- 87 Strongly Landlord-Friendly
- State Florida
- 87 Strongly Landlord-Friendly · R+3
- County
- — inherits STATE
- City
- — inherits STATE
ZIP-level market 33449
- Home prices YoY
- -0.2%
- Active inventory
- 168
- Price-to-rent
- 7.4×
Monthly cashflow live
- Estimated rent
- $3,529 high interval (Pro) →
- Mortgage (P&I)
- −$1,652
- Tax from tax record
- −$213 /mo · $2,561/yr
- Insurance
- −$131
- HOA
- −$710
- Vacancy / Maint / Mgmt
- −$741
- Net cashflow
- $81
Break-even live
UW: 25.0% down · 7.5% · 30yr · 1.5% tax · 5.0% vac · 8.0% maint · 8.0% mgmt
Financing live
Cash to close
- Down payment
- $78,750
- Closing costs
- $9,450
- Reserves months
- —
- Total cash needed
- —
Loan-product check · same deal, 3 products live
Conventional
25% down · 7.5% · 30yr
- Down + closing
- —
- Monthly P&I
- —
- Monthly cashflow
- —
- DSCR
- —
- Eligible?
- —
Personal DTI + credit; lowest rate.
DSCR
20% down · 8.5% · 30yr
- Down + closing
- —
- Monthly P&I
- —
- Monthly cashflow
- —
- DSCR
- —
- Eligible?
- —
No personal income docs; deal must DSCR.
Hard money
10% down · 12.0% · 12mo
- Down + closing
- —
- Monthly P&I
- —
- Monthly cashflow
- —
- DSCR
- —
- Eligible?
- —
Short-term bridge; refi at stabilization.
Rent comps 26 comps
| Address | Beds | Baths | Sqft | Rent | $/sqft | DOM | Units | Dist |
|---|---|---|---|---|---|---|---|---|
| 10173 Andover Coach Cir Unit G2 Lake Worth, FL | 3.0 | 2.0 | 1807 | $3,500 | $1.94 | 24d | 1 | 0.16mi |
| 10303 Andover Coach Cir Unit A1 Wellington, FL | 2.0 | 2.0 | 1420 | $5,500 | $3.87 | 24d | 1 | 0.18mi |
| 4173 Imperial Club Ln Lake Worth, FL | 3.0 | 2.5 | 1989 | $2,995 | $1.51 | 19d | 1 | 0.90mi |
| 3470 Custer Ave Lake Worth, FL | 3.0 | 2.0 | 2040 | $4,500 | $2.21 | 24d | 1 | 0.97mi |
| 10385 Wellington Parc Dr Lake Worth, FL | 3.0 | 2.5 | 1783 | $3,250 | $1.82 | 19d | 1 | 0.98mi |
| 10457 Wellington Parc Dr Lake Worth, FL | 3.0 | 2.5 | 1688 | $3,200 | $1.90 | 24d | 1 | 0.98mi |
| 9855 Herons Nest Ct Lake Worth, FL | 1.0–3.0 | 1.0–2.0 | 1026 | $2,244 | $2.19 | 2d | 7 | 1.01mi |
| 10348 Wellington Parc Dr Lake Worth, FL | 3.0 | 2.5 | 2060 | $3,300 | $1.60 | 24d | 1 | 1.01mi |
| 10450 Wellington Parc Dr Wellington, FL | 3.0 | 2.5 | 1983 | $3,350 | $1.69 | 24d | 1 | 1.01mi |
| 4790 Navali Dr Lake Worth, FL | 3.0 | 2.5 | 1708 | $3,200 | $1.87 | 24d | 1 | 1.18mi |
| 4839 Navali Dr Lake Worth, FL | 3.0 | 2.5 | 2124 | $3,300 | $1.55 | 24d | 1 | 1.19mi |
| 9006 Zevon Ct Lake Worth, FL | 3.0 | 2.5 | 2032 | $3,300 | $1.62 | 24d | 1 | 1.19mi |
| 8951 Kingsmoor Way Lake Worth, FL | 3.0 | 2.5 | 1918 | $3,500 | $1.82 | 5d | 1 | 1.27mi |
| 10372 Old Winston Ct Lake Worth, FL | 3.0 | 2.0 | 1798 | $3,395 | $1.89 | 7d | 1 | 1.29mi |
| 9108 Kingsmoor Way Lake Worth, FL | 3.0 | 2.5 | 1918 | $3,400 | $1.77 | 11d | 1 | 1.29mi |
| 4194 Bluff Harbor Way Wellington, FL | 3.0 | 2.5 | 2152 | $4,001 | $1.86 | 2d | 1 | 1.32mi |
| 8914 Kingsmoor Way Lake Worth, FL | 3.0 | 2.0 | 2019 | $4,500 | $2.23 | 24d | 1 | 1.33mi |
| 8914 Kingsmoor Way Lake Worth, FL | 3.0 | 2.0 | 2019 | $4,500 | $2.23 | 11d | 1 | 1.33mi |
| 4178 Bluff Harbor Way Wellington, FL | 3.0 | 2.0 | 1904 | $3,800 | $2.00 | 24d | 1 | 1.34mi |
| 8883 Kingsmoor Way Lake Worth, FL | 3.0 | 2.0 | 1997 | $4,225 | $2.12 | 11d | 1 | 1.36mi |
| 4985 Navali Dr Lake Worth, FL | 3.0 | 2.5 | 1604 | $3,050 | $1.90 | 2d | 1 | 1.36mi |
| 10567 Paso Fino Dr Lake Worth, FL | 3.0 | 2.0 | 1655 | $3,950 | $2.39 | 24d | 1 | 1.38mi |
| 8807 Antarus Dr Lake Worth, FL | 3.0 | 2.5 | 1954 | $3,700 | $1.89 | 15d | 1 | 1.39mi |
| 8807 Antarus Dr Lake Worth, FL | 3.0 | 2.5 | 1954 | $3,700 | $1.89 | 24d | 1 | 1.39mi |
| 10591 Paso Fino Dr Lake Worth, FL | 3.0 | 2.0 | 1764 | $3,500 | $1.98 | 5d | 1 | 1.40mi |
| 8835 Sandy Creek Way Lake Worth, FL | 3.0 | 2.5 | 2049 | $3,500 | $1.71 | 24d | 1 | 1.49mi |
HOA detail
- Monthly dues
- $710 · $8,520/yr
Listing history 19 events
-
2026-04-02status Pending
-
2026-03-17$315,000 Active
-
2026-03-13historical
-
2025-12-19price $315,000
-
2025-11-04price $329,000
-
2025-09-09$339,900 Active
-
2025-03-11historical
-
2024-11-20price $375,000
-
2024-10-19price $399,000
-
2024-09-21$425,000 Active
-
2021-09-20historical
-
2021-08-12soldstatus $200,000 Closed
-
2021-06-04historical Active Under Contract
-
2021-04-26$215,000 Active
-
2018-04-30soldstatus $53,000 Closed
-
2018-04-04status Pending
-
2018-03-23price $64,900
-
2018-02-21price $70,000
-
2018-01-17$74,000 Active
ⓘ Source: listings_history table (triggers on properties + properties_extension) + one-shot
backfill from property_details.listing_events for pre-trigger history.
Tax reassessment forecast FL · Resets to sale price
- Current annual tax
- $2,561 · $213/mo
- Projected year-2 tax
- $2,614 · $218/mo
- Expected delta
- +$53/yr (+$4/mo · 2.1%)
ⓘ Screening estimate from a state-policy table — verify with the county assessor before closing.
Climate risk First Street
- Flood 1/10 Low FEMA zone X (unshaded) · 0% chance over 30 yrs
- Wildfire 1/10 Low
- Heat 9/10 Extreme 7 d/yr ≥106°F today · 25 d/yr by 30 yrs out
- Wind 10/10 Extreme 99% chance of damaging wind over 30 yrs
- Air quality 2/10 Low 0 unhealthy d/yr today · 2 by 30 yrs out
Nearby sold comps map
Loading sold comps map…
Walkable amenities ~0.75 mi
Loading nearby amenities…
Taxation est. · year 1
- Rental income
- $42,344
- − Mortgage interest
- −$17,645
- − Property taxes
- −$2,561
- − Insurance
- −$1,575
- − Repairs & maintenance
- −$3,388
- − Management
- −$3,388
- − HOA
- −$8,520
- − Depreciation
- −$9,164
- Taxable loss
- −$3,896
- Est. tax savings @ 24.0%
- +$935
- After-tax cash flow
- $1,908/yr
For passive investors: Depreciation is non-cash, so a rental often shows a tax loss while cash-flowing — sheltering income. Rental losses are passive: they offset passive income freely, and up to $25,000/yr can offset ordinary (W-2) income if you actively participate and your MAGI is under $100k (phasing out to $0 by $150k); unused losses carry forward. On sale, claimed depreciation is recaptured at up to 25%, and gains may owe capital-gains tax (a 1031 exchange can defer both). Figures are a year-1 estimate at your 24.0% rate — not tax advice; consult a CPA.
Schools (NCES district)
- District
- Palm Beach
- NCES district ID
- 1201500
- Math proficiency
- 46% ▼ -16.00%
- Reading proficiency
- 53% ▼ -4.00%
- Median HH income
- $53,943
- Composite
- 42.72/100
- National rank
- #3160
- State rank
- #34 of 73 in FL
Livability — Wellington
- Score
- 73/100
- State rank
- #294
- US rank
- #4986
Category grades
Schools grade is shown separately in the Schools card above.
Census & demographics
- City population
- 60,184
- Population (ZIP)
- 9,131
Population outlook (Palm Beach County) Hauer SSP2
- Today (2025)
- 1,637,487 people
- By 2030
- 1,743,255 · +6.5%
- By 2040
- 1,948,712 · +19.0%
- By 2050
- 2,132,979 · +30.3%
- By 2075
- 2,530,027 · +54.5%
- By 2100
- 2,706,979 · +65.3%
Race, ethnicity, and origin ACS 2023
- Neighborhood character
- Majority White (65%)
- Race & ethnicity
- White 65% Hispanic / Latino 16% Black 14% Two or more races 7% Asian 4%
- Hispanic origin (detail)
- Mexican 3% Puerto Rican 3% Cuban 3% Salvadoran 2%
- Common ancestry
- Scotch-Irish 5% Romanian 4% Hispanic 3%
- Foreign-born
- 21% · Canada, Jamaica, Vietnam
- Languages at home
- 75% English-only · Spanish 12% French/Haitian/Cajun 4% Other Indo-European 3%
Political lean MEDSL · Palm Beach
- 2024 margin
- Toss-up / Even · D 50.0% · R 49.2%
- 2008→2024 swing
- -22.1pp toward R · 2008: 22.9pp · 2024: 0.8pp
- All cycles
- 2024: D+0.8 2020: D+12.8 2016: D+15.3 2012: D+17.0 2008: D+22.9
Not yet ingested
- Civics
- —
Market trends
- HPI YoY
- ▼ -0.67%
- Current HPI
- 271.0184
- Rent YoY
- —
- Metro
- —
- State GDP YoY
- ▲ 3.28%
- F500 in state
- 36
Industry mix (Fortune 500 HQ in FL)
| Industry | F500 HQs | Revenue |
|---|---|---|
| Industrial Technology | 2 | $29B |
|
||
| Insurance | 2 | $17B |
|
||
| Retail | 1 | $60B |
|
||
| Technology Distribution | 1 | $58B |
|
||
| Homebuilding | 1 | $35B |
|
||
| Technology Manufacturing | 1 | $35B |
|
||
Price history
+325.7% since first listed19 events — show timeline
- 2026-04-02 Pending — Beaches MLS
- 2026-03-17 Listed $315,000 Beaches MLS
- 2026-03-13 Listing Removed — Beaches MLS
- 2025-12-19 Price Changed $315,000 Beaches MLS
- 2025-11-04 Price Changed $329,000 Beaches MLS
- 2025-09-09 Listed $339,900 Beaches MLS
- 2025-03-11 Listing Removed — Beaches MLS
- 2024-11-20 Price Changed $375,000 Beaches MLS
- 2024-10-19 Price Changed $399,000 Beaches MLS
- 2024-09-21 Listed $425,000 Beaches MLS
- 2021-09-20 Listing Removed — Beaches MLS
- 2021-08-12 Sold (MLS) $200,000 Beaches MLS
- 2021-06-04 Contingent — Beaches MLS
- 2021-04-26 Listed $215,000 Beaches MLS
- 2018-04-30 Sold (MLS) $53,000 Beaches MLS
- 2018-04-04 Pending — Beaches MLS
- 2018-03-23 Price Changed $64,900 Beaches MLS
- 2018-02-21 Price Changed $70,000 Beaches MLS
- 2018-01-17 Listed $74,000 Beaches MLS
Property tax history
+3.1%/yrLatest (2025): $2,561 · +3.3% YoY. Source: county tax records.
Cash-flow waterfall
monthlySold comps — $/sqft
last 12 mo · ≤1 miLoading sold comps…