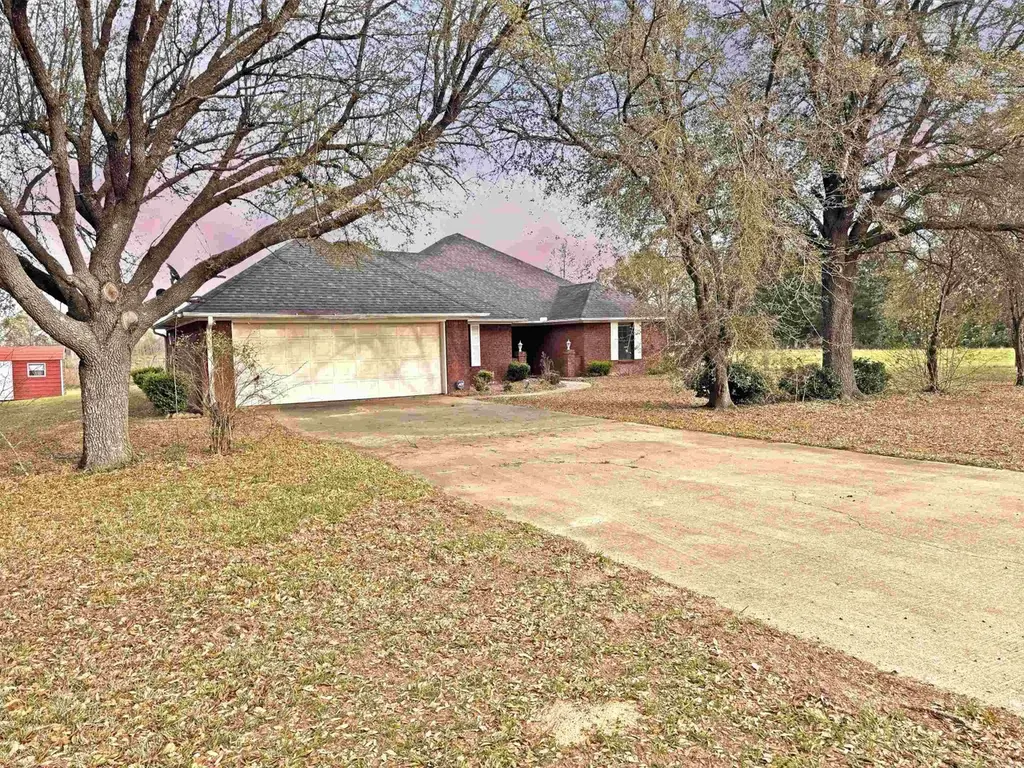
766 County Rd 1229 · Daingerfield, TX
Flood risk 1/10 · Minimal
- FEMA flood zone
- X
- Chance of flooding over 30 yrs
- 0.0%
- Est. flood insurance / yr
- $507 – $1,088
Fire risk 6/10 · Moderate
- Est. fire insurance / yr
- $1,222 – $2,270
Heat risk 7/10 · Major
- Hot days now (above 112°F)
- 7 days/yr
- Hot days in 30 yrs
- 23 days/yr
Wind risk 6/10 · Moderate
- Chance of severe wind over 30 yrs
- 27.0%
Air-quality risk 2/10 · Minimal
- Unhealthy air days now
- 1 days/yr
- Unhealthy air days in 30 yrs
- 1 days/yr
Risk factors via First Street. Map © Google.
Why this score? — see what drove the D- grade
The composite is a weighted blend of 9 inputs, each scored 0–100. Each bar is that input's sub-score; the figure is the points it added to the 100-point composite (weight × sub-score).
- Cash flow +12.2/30.0
- ARV discount +9.4/15.0
- DSCR +3.6/10.0
- Livability +3.4/5.0
- 1% rule +3.2/10.0
- Rent growth +2.5/5.0
- Condition / age +2.5/5.0
- Schools +2.3/10.0
- Appreciation +0.0/10.0
$224,900
🖨 Deal sheet 📄 Offer letter ✓ Due diligence
Listing remarks MLS
Welcome home to this meticulously maintained 3-bedroom, 3-bathroom residence perfectly situated at 766 County Road 1229 in Pittsburg. This home offers an expansive layout featuring a large living area designed for both relaxation and effortless entertaining. The heart of the home is the well-appointed kitchen, which flows seamlessly into a charming breakfast nook for casual mornings, while the formal dining room provides an elegant setting for special occasions. Retire to spacious bedrooms and appreciate the convenience of three full baths. The property also includes a functional 2-car garage and a storage building, perfect for hobbies or extra equipment. Nestled in a serene setting with plenty of curb appeal, this home combines traditional comfort with the space you need. Don't miss your chance to see this East Texas gem! The property is sold As-Is, Where-Is. Seller has no knowledge, buyer should perform their due diligence and make their own assessments.
Key facts
- Formal dining room
- Spacious bedrooms
- 1 acre lot
Tags
Neighborhood map
What this means for you Summary
Snapshot
- This is a 3-bed/1.0-bath single-family listed at $225k.
Deal economics
- At list price, monthly cash flow is $-43 ($-522/yr) — negative.
- To cash-flow at today's rent, offer at most $217k (3.4% below list).
- To meet the 1% rule (rent ≥ 1% of price), the offer needs to be $183k (18.4% below list).
- Recommended offer: $183k (18.4% below list) — sets the bar for 1% rule.
- Cap rate 6.1% vs local median 3.5% in Daingerfield — top-decile yield for the area; either an underpriced asset or a hidden risk that comps aren't pricing in. Stress-test before assuming the spread holds.
Location & tenants
- Location reads 67/100 on livability (#536 in TX) — a middle-class / working-renter tenant base. Strengths: cost of living A+, housing A+, health & safety A+; Watch: schools F, crime F, amenities F.
- Daingerfield-Lone Star ISD (town): math 24% / reading 32% proficiency, ranked #679 of 826 in TX (top 82%) — low school quality limits family demand, transient renter base, plan for 1-2y turnover; 71% free/reduced lunch — lower-income household profile, screen leases tightly.
- Market conditions: 313 active listings in the ZIP; 3 units permitted in Morris County in 2024 (0 in 5+ unit buildings).
Forward outlook
- Local home prices are declining (-3.0%/yr); year-one equity from $2k of loan paydown is wiped out by about $7k of value loss. Plan a longer hold.
- Morris County population projected at -19% by 2050 — secular population decline; favor cash flow + early exit over multi-decade hold.
Negotiation context
- It's been on market 93 days — a 9% lower offer ($205k) is reasonable based on typical stale-listing flexibility.
- 3 sale attempts with the ask held roughly flat each time — persistent listings suggest the price (not the market) is what's stuck; bring a comps-based counter.
Risks & watch-outs
- Climate carrying-cost: major wind risk, 27% chance of damaging wind over 30y; major wildfire risk; extreme-heat days projected 7→23/yr by 2055 (HVAC capex compounding) — expect insurance premiums to compound above CPI over the hold.
Questions for the listing agent
- What do current leases actually rent for vs. the listed asking? Can we see a recent rent roll and the last 12 months of T-12 income?
- It's been on market 93 days. Have you received any prior offers? Is the seller open to a 18% concession, seller financing, or rate buy-down credit?
- Why hasn't it sold? Are there any deal-killer items the seller is aware of (foundation, flood, title, zoning, code violations)?
- Is there a deadline driving the sale (1031 exchange, divorce, estate, relocation)? That informs how much negotiation room exists.
- Schools are F-rated, which usually means shorter tenancies and higher turnover. Who's the typical renter profile here, and what's been the actual vacancy rate?
- Crime grade is F in this area — have there been break-ins, vandalism, or insurance claims at this property in the last 3 years? What carrier currently insures it and at what premium?
- The area grade is low — what's the realistic commute time and amenity access for the typical tenant pool here? Any planned neighborhood developments (good or bad) we should know about?
- What's the average days-on-market for RENTAL listings here right now (not sales)? A rising rental-DOM trend means longer vacancies and softer asking-rent achievability than the comps imply.
- What's the recent tenant-quality profile in this submarket — average credit score on applications, eviction rate, late-payment / NSF rate, and stable-employment percentage? A property-management company in the area should have these aggregated.
- How much new for-sale + rental construction is in the pipeline within 1–3 miles? Heavy new supply typically softens prices + rents 12–24 months out; constrained supply supports both.
Investment metrics
- 1% rule
- 0.82% ✗
- Cap rate
- 6.06%
- Cash-on-cash
- -0.83%
- DSCR
- 0.96
- GRM
- 10.2
CMA / ARV
- ARV (median comp)
- $234,659
- List price
- $224,900
- Delta
- -4.16%
- Verdict
- FAIR
- Comps
- 2 within 2.0 mi
Projected returns pro-forma
-3.0% appreciation · 3.0% rent growth · sell at horizon
- IRR
- -17.7%
- Equity multiple
- 0.38×
- Total profit
- $-39,222
- Equity at exit
- $33,533
- IRR
- -9.8%
- Equity multiple
- 0.40×
- Total profit
- $-37,760
- Equity at exit
- $19,445
Cash invested: $62,972 (down + closing). Projections, not guarantees.
Landlord ↔ Tenant lean methodology
- Overall (STATE)
- 87 Strongly Landlord-Friendly
- State Texas
- 87 Strongly Landlord-Friendly · R+5
- County
- — inherits STATE
- City
- — inherits STATE
ZIP-level market 75686
- Home prices YoY
- -21.6%
- Active inventory
- 313
- Price-to-rent
- 10.2×
Monthly cashflow live
- Estimated rent
- $1,835 medium interval (Pro) →
- Mortgage (P&I)
- −$1,179
- Tax from tax record
- −$220 /mo · $2,636/yr
- Insurance
- −$94
- HOA
- −$0
- Vacancy / Maint / Mgmt
- −$385
- Net cashflow
- $-43
Break-even live
UW: 25.0% down · 7.5% · 30yr · 1.5% tax · 5.0% vac · 8.0% maint · 8.0% mgmt
Financing live
Cash to close
- Down payment
- $56,225
- Closing costs
- $6,747
- Reserves months
- —
- Total cash needed
- —
Loan-product check · same deal, 3 products live
Conventional
25% down · 7.5% · 30yr
- Down + closing
- —
- Monthly P&I
- —
- Monthly cashflow
- —
- DSCR
- —
- Eligible?
- —
Personal DTI + credit; lowest rate.
DSCR
20% down · 8.5% · 30yr
- Down + closing
- —
- Monthly P&I
- —
- Monthly cashflow
- —
- DSCR
- —
- Eligible?
- —
No personal income docs; deal must DSCR.
Hard money
10% down · 12.0% · 12mo
- Down + closing
- —
- Monthly P&I
- —
- Monthly cashflow
- —
- DSCR
- —
- Eligible?
- —
Short-term bridge; refi at stabilization.
Listing history 18 events
-
2026-06-19days on market $224,900 Active 93 DOM
-
2026-06-18days on market $224,900 Active 92 DOM
-
2026-06-17days on market $224,900 Active 91 DOM
-
2026-06-16days on market $224,900 Active 90 DOM
-
2026-06-15days on market $224,900 Active 89 DOM
-
2026-06-14days on market $224,900 Active 87 DOM
-
2026-06-12statusdays on market $224,900 Active 86 DOM
-
2026-06-09days on market $224,900 Price Change 83 DOM
-
2026-06-08days on market $224,900 Price Change 82 DOM
-
2026-06-07days on market $224,900 Price Change 81 DOM
-
2026-06-07pricestatusdays on market $224,900 Price Change 80 DOM
-
2026-06-02days on market $229,900 Active 76 DOM
-
2026-06-01days on market $229,900 Active 75 DOM
-
2026-05-31days on market $229,900 Active 74 DOM
-
2026-05-30days on market $229,900 Active 73 DOM
-
2026-03-18$229,900 Active 970-char remark
Show marketing remark (976 chars)
Welcome home to this meticulously maintained 3-bedroom, 3-bathroom residence perfectly situated at 766 County Road 1229 in Pittsburg. This home offers an expansive layout featuring a large living area designed for both relaxation and effortless entertaining. The heart of the home is the well-appointed kitchen, which flows seamlessly into a charming breakfast nook for casual mornings, while the formal dining room provides an elegant setting for special occasions. Retire to spacious bedrooms and appreciate the convenience of three full baths. The property also includes a functional 2-car garage and a storage building, perfect for hobbies or extra equipment. Nestled in a serene setting with plenty of curb appeal, this home combines traditional comfort with the space you need. Don’t miss your chance to see this East Texas gem! The property is sold As-Is, Where-Is. Seller has no knowledge, buyer should perform their due diligence and make their own assessments.
-
2026-03-18$229,900 Active 976-char remark
Show marketing remark (976 chars)
Welcome home to this meticulously maintained 3-bedroom, 3-bathroom residence perfectly situated at 766 County Road 1229 in Pittsburg. This home offers an expansive layout featuring a large living area designed for both relaxation and effortless entertaining. The heart of the home is the well-appointed kitchen, which flows seamlessly into a charming breakfast nook for casual mornings, while the formal dining room provides an elegant setting for special occasions. Retire to spacious bedrooms and appreciate the convenience of three full baths. The property also includes a functional 2-car garage and a storage building, perfect for hobbies or extra equipment. Nestled in a serene setting with plenty of curb appeal, this home combines traditional comfort with the space you need. Don’t miss your chance to see this East Texas gem! The property is sold As-Is, Where-Is. Seller has no knowledge, buyer should perform their due diligence and make their own assessments.
-
2026-03-14$229,900 New Listing
ⓘ Source: listings_history table (triggers on properties + properties_extension) + one-shot
backfill from property_details.listing_events for pre-trigger history.
Tax reassessment forecast TX · Resets to sale price
- Current annual tax
- $2,636 · $220/mo
- Projected year-2 tax
- $4,116 · $343/mo
- Expected delta
- +$1,480/yr (+$123/mo · 56.1%)
ⓘ Screening estimate from a state-policy table — verify with the county assessor before closing.
Climate risk First Street
- Flood 1/10 Low FEMA zone X · 0% chance over 30 yrs
- Wildfire 6/10 Major
- Heat 7/10 Severe 7 d/yr ≥112°F today · 23 d/yr by 30 yrs out
- Wind 6/10 Major 27% chance of damaging wind over 30 yrs
- Air quality 2/10 Low 1 unhealthy d/yr today · 1 by 30 yrs out
Nearby sold comps map
Loading sold comps map…
Walkable amenities ~0.75 mi
Loading nearby amenities…
Taxation est. · year 1
- Rental income
- $22,014
- − Mortgage interest
- −$12,598
- − Property taxes
- −$2,636
- − Insurance
- −$1,124
- − Repairs & maintenance
- −$1,761
- − Management
- −$1,761
- − Depreciation
- −$6,543
- Taxable loss
- −$4,409
- Est. tax savings @ 24.0%
- +$1,058
- After-tax cash flow
- $536/yr
For passive investors: Depreciation is non-cash, so a rental often shows a tax loss while cash-flowing — sheltering income. Rental losses are passive: they offset passive income freely, and up to $25,000/yr can offset ordinary (W-2) income if you actively participate and your MAGI is under $100k (phasing out to $0 by $150k); unused losses carry forward. On sale, claimed depreciation is recaptured at up to 25%, and gains may owe capital-gains tax (a 1031 exchange can defer both). Figures are a year-1 estimate at your 24.0% rate — not tax advice; consult a CPA.
Schools (NCES district)
- District
- Daingerfield-Lone Star ISD
- NCES district ID
- 4816180
- Math proficiency
- 24% ▼ -11.00%
- Reading proficiency
- 32% ▼ -4.00%
- Median HH income
- $39,097
- Composite
- 23.48/100
- National rank
- #7877
- State rank
- #679 of 826 in TX
Livability — Daingerfield
- Score
- 67/100
- State rank
- #536
- US rank
- #10463
Category grades
Schools grade is shown separately in the Schools card above.
Census & demographics
- Population (ZIP)
- 13,427
Population outlook (Morris County) Hauer SSP2
- Today (2025)
- 11,628 people
- By 2030
- 11,126 · -4.3%
- By 2040
- 10,181 · -12.4%
- By 2050
- 9,408 · -19.1%
- By 2075
- 8,268 · -28.9%
- By 2100
- 7,463 · -35.8%
Race, ethnicity, and origin ACS 2023
- Neighborhood character
- Diverse neighborhood (Simpson 0.63)
- Race & ethnicity
- White 52% Hispanic / Latino 28% Two or more races 16% Black 14% Asian 1%
- Hispanic origin (detail)
- Mexican 25%
- Common ancestry
- Slovak 1% Scottish 1% Serbian 1%
- Foreign-born
- 11% · Canada, Vietnam, Dominican Republic
- Languages at home
- 79% English-only · Spanish 20% Vietnamese 1%
Political lean MEDSL · Morris
- 2024 margin
- Solid R (+51.2) · D 24.1% · R 75.3%
- 2008→2024 swing
- -30.2pp toward R · 2008: -21.0pp · 2024: -51.2pp
- All cycles
- 2024: R+51.2 2020: R+39.4 2016: R+40.6 2012: R+26.7 2008: R+21.0
Not yet ingested
- Civics
- —
Market trends
- HPI YoY
- ▼ -50.12%
- Current HPI
- 181.5522
- Rent YoY
- —
- Metro
- —
- State GDP YoY
- ▲ 3.95%
- F500 in state
- 110
Industry mix (Fortune 500 HQ in TX)
| Industry | F500 HQs | Revenue |
|---|---|---|
| Energy | 16 | $1,198B |
|
||
| Technology | 5 | $198B |
|
||
| Engineering / Construction | 4 | $72B |
|
||
| Energy Services | 3 | $60B |
|
||
| Utilities | 3 | $41B |
|
||
| Healthcare | 2 | $330B |
|
||
Price history
+0.0% since first listed3 events — show timeline
- 2026-03-18 Listed $229,900 TBOR
- 2026-03-18 Listed $229,900 LAAR
- 2026-03-14 Listed $229,900 CARMLS
Property tax history
+0.5%/yrLatest (2025): $2,636 · +1.1% YoY. Source: county tax records.
Cash-flow waterfall
monthlySold comps — $/sqft
last 12 mo · ≤1 miLoading sold comps…