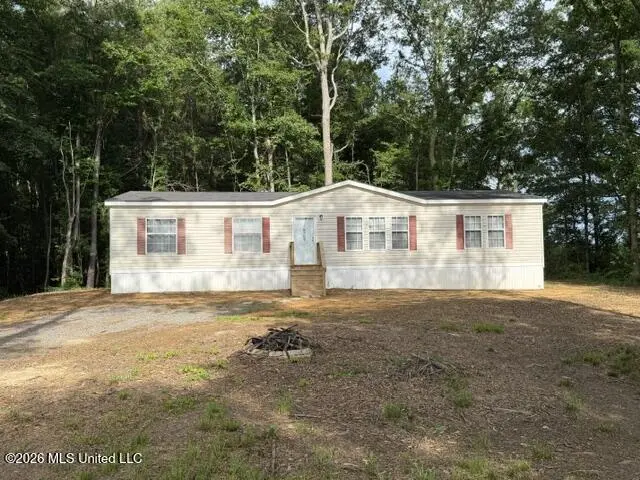
660 Woodrow Martin Rd · Polkville, MS
Flood risk No data
- FEMA flood zone
- —
- Chance of flooding over 30 yrs
- —
- Est. flood insurance / yr
- —
Fire risk No data
- Est. fire insurance / yr
- —
Heat risk No data
- Hot days now (above threshold)
- —
- Hot days in 30 yrs
- —
Wind risk No data
- Chance of severe wind over 30 yrs
- —
Air-quality risk No data
- Unhealthy air days now
- —
- Unhealthy air days in 30 yrs
- —
Risk factors via First Street. Map © Google.
Why this score? — see what drove the C grade
The composite is a weighted blend of 9 inputs, each scored 0–100. Each bar is that input's sub-score; the figure is the points it added to the 100-point composite (weight × sub-score).
- Cash flow +20.5/30.0
- ARV discount +7.5/15.0
- DSCR +6.5/10.0
- 1% rule +5.4/10.0
- Schools +4.6/10.0
- Rent growth +4.3/5.0
- Condition / age +4.0/5.0
- Livability +2.9/5.0
- Appreciation +0.0/10.0
$189,000
🖨 Deal sheet 📄 Offer letter ✓ Due diligence
Listing remarks
Welcome home to peaceful country living! This spacious 4-bedroom, 2-bath manufactured home offers nearly 1,700 square feet of comfortable living space and sits on approximately 3 beautiful acres. Inside, you'll find a large open layout with wood-look vinyl flooring and carpet throughout, creating both style and comfort. The kitchen is designed with both functionality and style in mind, featuring stainless steel appliances, a separate pantry, and a large island with a breakfast bar area that's perfect for gatherings, meal prep, or casual dining. The oversized master suite features a private bath with a separate soaking tub and shower area, perfect for relaxing after a long day. Enjoy the qui
Key facts
- Separate pantry
- Open layout
- Large island
Tags
Property features AI
Exterior
- Parking: Gravel parking
- Utilities: Public water; Septic tank; Electricity connected; Water connected; Sewer connected
- Home design: Manufactured home; Manufactured house; One level; Move-in ready
- Construction: Siding exterior; Conventional foundation; Asphalt roof; Built in owner-reported year
- Exterior features: Wooded lot; Outdoor lighting
Interior
- Kitchen: Built-in electric range; Dishwasher
- Flooring: Carpet; Laminate
- Bathrooms: 2 full bathrooms
- Heating & cooling: Central heating (electric); Central air; Ceiling fan(s)
- Interior features: Breakfast bar; Crown molding; Eat-in kitchen; Kitchen island; Pantry; Soaking tub; Blinds; Dead bolt lock(s)
- Laundry & utility: Laundry located inside
Neighborhood map
What this means for you Summary
Snapshot
- This is a 4-bed/2.0-bath manufactured listed at $189k. Condition is rated good.
Deal economics
- At list price, monthly cash flow is $251 ($3k/yr) — positive.
- The deal already cash-flows at list — no discount required.
- Meets the 1% rule at list price ($2k rent vs $189k).
- Recommended offer: $186k (1.5% below list) — sets the bar for market timing.
Location & tenants
- Location reads 58/100 on livability (#269 in MS) — a working-class tenant base; expect higher turnover. Strengths: cost of living A+, housing A+, crime B+; Watch: amenities F, commute F, employment F.
- Rankin County School District (rural): math 56% / reading 48% proficiency, ranked #6 of 130 in MS (top 5%) — acceptable for families but not a draw, mixed tenant base, ~2y average lease.
- Zoned schools: Puckett Elementary School (math 47% / reading 44%, grade D-, #89 of 375 statewide, top 24%, 380 students, 99% FRL); Puckett Attendance Center (math 52% / reading 37%, grade F, #36 of 197 statewide, top 19%, 342 students, 99% FRL) — zoned schools average 99% FRL vs 35% district-wide (65 pts higher); higher-poverty schools than district average — tighter screening recommended.
- Market conditions: Rents rising fast (+7.1%/yr); 302 active listings in the ZIP; solid renter incomes; 343 units permitted in Rankin County in 2024 (0 in 5+ unit buildings).
Forward outlook
- Local home prices are declining (-3.0%/yr); year-one equity from $1k of loan paydown is wiped out by about $6k of value loss. Plan a longer hold.
- Rankin County population projected at +17% by 2050 — long-run rental-demand tailwind backs the buy-and-hold thesis.
- At projected returns (-3.0% appreciation + 7.1% rent growth), your $53k cash investment doubles in ~10 years — after that, you're playing with house money.
Negotiation context
- It's been on market 17 days — a 2% lower offer ($186k) is reasonable based on typical stale-listing flexibility.
Questions for the listing agent
- Is there a deadline driving the sale (1031 exchange, divorce, estate, relocation)? That informs how much negotiation room exists.
- Schools are F-rated, which usually means shorter tenancies and higher turnover. Who's the typical renter profile here, and what's been the actual vacancy rate?
- What's the average days-on-market for RENTAL listings here right now (not sales)? A rising rental-DOM trend means longer vacancies and softer asking-rent achievability than the comps imply.
- What's the recent tenant-quality profile in this submarket — average credit score on applications, eviction rate, late-payment / NSF rate, and stable-employment percentage? A property-management company in the area should have these aggregated.
- How much new for-sale + rental construction is in the pipeline within 1–3 miles? Heavy new supply typically softens prices + rents 12–24 months out; constrained supply supports both.
Investment metrics
- 1% rule
- 1.04% ✓
- Cap rate
- 7.88%
- Cash-on-cash
- 5.68%
- DSCR
- 1.25
- GRM
- 8.0
CMA / ARV
No comps found within radius.
Projected returns pro-forma
-3.0% appreciation · 7.13% rent growth · sell at horizon
- IRR
- -2.9%
- Equity multiple
- 0.88×
- Total profit
- $-6,109
- Equity at exit
- $28,181
- IRR
- 10.9%
- Equity multiple
- 2.01×
- Total profit
- $53,461
- Equity at exit
- $16,341
Cash invested: $52,920 (down + closing). Projections, not guarantees.
Landlord ↔ Tenant lean methodology
- Overall (STATE)
- 90 Strongly Landlord-Friendly
- State Mississippi
- 90 Strongly Landlord-Friendly · R+11
- County
- — inherits STATE
- City
- — inherits STATE
ZIP-level market 39042
- Home prices YoY
- -34.3%
- Rents YoY
- 7.1%
- Active inventory
- 302
- Price-to-rent
- 8.0×
Monthly cashflow live
- Estimated rent
- $1,971 medium interval (Pro) →
- Mortgage (P&I)
- −$991
- Tax est. 1.5%
- −$236 /mo · $2,835/yr
- Insurance
- −$79
- HOA
- −$0
- Vacancy / Maint / Mgmt
- −$414
- Net cashflow
- $251
Break-even live
UW: 25.0% down · 7.5% · 30yr · 1.5% tax · 5.0% vac · 8.0% maint · 8.0% mgmt
Financing live
Cash to close
- Down payment
- $47,250
- Closing costs
- $5,670
- Reserves months
- —
- Total cash needed
- —
Loan-product check · same deal, 3 products live
Conventional
25% down · 7.5% · 30yr
- Down + closing
- —
- Monthly P&I
- —
- Monthly cashflow
- —
- DSCR
- —
- Eligible?
- —
Personal DTI + credit; lowest rate.
DSCR
20% down · 8.5% · 30yr
- Down + closing
- —
- Monthly P&I
- —
- Monthly cashflow
- —
- DSCR
- —
- Eligible?
- —
No personal income docs; deal must DSCR.
Hard money
10% down · 12.0% · 12mo
- Down + closing
- —
- Monthly P&I
- —
- Monthly cashflow
- —
- DSCR
- —
- Eligible?
- —
Short-term bridge; refi at stabilization.
Listing history 8 events
-
2026-06-08status $189,000 Pending 17 DOM
-
2026-06-07days on market $189,000 Active 17 DOM
-
2026-06-03days on market $189,000 Active 13 DOM
-
2026-06-02days on market $189,000 Active 12 DOM
-
2026-06-01days on market $189,000 Active 11 DOM
-
2026-05-31days on market $189,000 Active 10 DOM
-
2026-05-30days on market $189,000 Active 9 DOM
-
2026-05-21$189,000 Active
ⓘ Source: listings_history table (triggers on properties + properties_extension) + one-shot
backfill from property_details.listing_events for pre-trigger history.
Nearby sold comps map
Loading sold comps map…
Walkable amenities ~0.75 mi
Loading nearby amenities…
Taxation est. · year 1
- Rental income
- $23,646
- − Mortgage interest
- −$10,587
- − Property taxes
- −$2,835
- − Insurance
- −$945
- − Repairs & maintenance
- −$1,892
- − Management
- −$1,892
- − Depreciation
- −$5,498
- Taxable loss
- −$2
- Est. tax savings @ 24.0%
- +$1
- After-tax cash flow
- $3,007/yr
For passive investors: Depreciation is non-cash, so a rental often shows a tax loss while cash-flowing — sheltering income. Rental losses are passive: they offset passive income freely, and up to $25,000/yr can offset ordinary (W-2) income if you actively participate and your MAGI is under $100k (phasing out to $0 by $150k); unused losses carry forward. On sale, claimed depreciation is recaptured at up to 25%, and gains may owe capital-gains tax (a 1031 exchange can defer both). Figures are a year-1 estimate at your 24.0% rate — not tax advice; consult a CPA.
Condition & rehab AI · 30 photos
This spacious 4-bedroom, 2-bath manufactured home is in good condition with a good condition score of 80. It offers nearly 1,700 square feet of comfortable living space and sits on approximately 3 beautiful acres. The home is move-in ready with minor cosmetic updates that can further enhance its value.
Value-add opportunities
- Both Painting the exterior and interior walls — Fresh paint can enhance curb appeal and interior aesthetics
- Both Updating the flooring in the bathrooms — Modern flooring can improve the look and feel of the bathrooms
- Both Upgrading the kitchen appliances — New appliances can make the kitchen more functional and appealing
- Both Adding a small deck or patio area — An outdoor space can increase the home's appeal and functionality
Renovation cost estimate screening
Value-add ROI direction
- Both Painting the exterior and interior walls — Fresh paint can enhance curb appeal and interior aesthetics ↑
- Both Updating the flooring in the bathrooms — Modern flooring can improve the look and feel of the bathrooms ↑
- Both Upgrading the kitchen appliances — New appliances can make the kitchen more functional and appealing ↑
- Both Adding a small deck or patio area — An outdoor space can increase the home's appeal and functionality ↑
ⓘ Cost ranges are severity-bucket heuristics (US national rule-of-thumb). Get contractor quotes + a written scope before underwriting a rehab budget.
Schools (NCES district)
- District
- Rankin County School District
- NCES district ID
- 2803830
- Math proficiency
- 56% ▼ -4.00%
- Reading proficiency
- 48% ▼ -6.00%
- Median HH income
- $61,867
- Composite
- 45.62/100
- National rank
- #2587
- State rank
- #6 of 130 in MS
Livability — Polkville
- Score
- 58/100
- State rank
- #269
- US rank
- #21209
Category grades
Schools grade is shown separately in the Schools card above.
Census & demographics
- County
- Rankin County · 123,614 people
- Metro
- Jackson, MS
- Population (ZIP)
- 39,142
- Household income
- $88,597
- Rent vs Own
- Severe rent burden
- 474.0
Population outlook (Rankin County) Hauer SSP2
- Today (2025)
- 164,317 people
- By 2030
- 171,013 · +4.1%
- By 2040
- 182,723 · +11.2%
- By 2050
- 192,376 · +17.1%
- By 2075
- 209,535 · +27.5%
- By 2100
- 209,534 · +27.5%
Race, ethnicity, and origin ACS 2023
- Neighborhood character
- Predominantly White (75%)
- Race & ethnicity
- White 75% Black 21% Hispanic / Latino 2% Two or more races 2%
- Common ancestry
- Italian 5% Slovak 2% Iranian 2%
- Foreign-born
- 2% · Canada
- Languages at home
- 97% English-only · Spanish 2%
Political lean MEDSL · Rankin
- 2024 margin
- Solid R (+47.1) · D 25.9% · R 73.0% · Other 1.0%
- 2008→2024 swing
- +6.4pp toward D · 2008: -53.5pp · 2024: -47.1pp
- All cycles
- 2024: R+47.1 2020: R+45.4 2016: R+52.9 2012: R+51.9 2008: R+53.5
Not yet ingested
- Civics
- —
Market trends
- HPI YoY
- ▼ -90.04%
- Current HPI
- 172.5248
- Rent YoY
- ▲ 7.13%
- Metro
- Jackson, MS
- State GDP YoY
- —
- F500 in state
- 0
Price history
1 event — show timeline
- 2026-05-21 Listed $189,000 MLSU
Cash-flow waterfall
monthlySold comps — $/sqft
last 12 mo · ≤1 miLoading sold comps…