15 Calvert Dr #202 · Monsey, NY
Flood risk 1/10 · Minimal
- FEMA flood zone
- X (unshaded)
- Chance of flooding over 30 yrs
- 0.0%
- Est. flood insurance / yr
- $473 – $860
Fire risk 1/10 · Minimal
- Est. fire insurance / yr
- $691 – $1,283
Heat risk 5/10 · Moderate
- Hot days now (above 97°F)
- 7 days/yr
- Hot days in 30 yrs
- 15 days/yr
Wind risk 4/10 · Minor
- Chance of severe wind over 30 yrs
- 24.0%
Air-quality risk 3/10 · Minor
- Unhealthy air days now
- 2 days/yr
- Unhealthy air days in 30 yrs
- 4 days/yr
Risk factors via First Street. Map © Google.
Why this score? — see what drove the C- grade
The composite is a weighted blend of 9 inputs, each scored 0–100. Each bar is that input's sub-score; the figure is the points it added to the 100-point composite (weight × sub-score).
- Cash flow +20.6/30.0
- ARV discount +7.5/15.0
- DSCR +6.6/10.0
- 1% rule +5.4/10.0
- Condition / age +5.0/5.0
- Livability +3.1/5.0
- Schools +2.6/10.0
- Rent growth +2.5/5.0
- Appreciation +0.0/10.0
$1,149,000
🖨 Deal sheet 📄 Offer letter ✓ Due diligence
Listing remarks
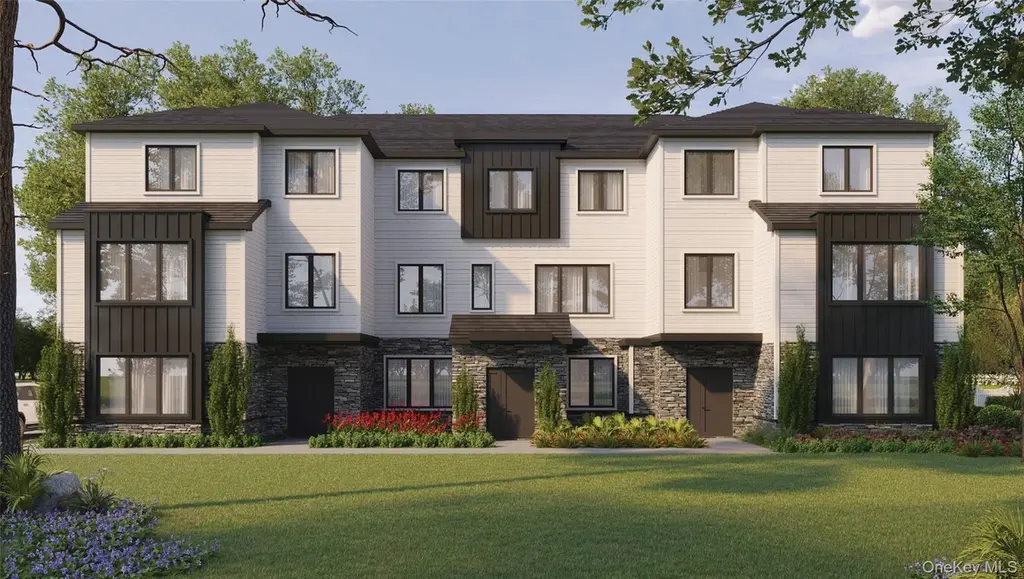
Brand new construction luxury townhouse offering an exceptional layout, upscale finishes, and spacious living throughout! Enter through a welcoming foyer and head upstairs to an expansive main living level featuring a stunning oversized dining room, bright and spacious living area, and a beautifully designed kitchen with a large center island and door leading to a massive porch overlooking the backyard — perfect for entertaining and outdoor enjoyment. This level also includes a spacious playroom, private office, and full bathroom. The upper level features a luxurious primary suite complete with a walk-in closet and beautiful full primary bathroom. Also on this floor are 4 additional s
Key facts
- Large center island
- Bright living area
- New construction
Tags
Property features AI
Exterior
- Parking: Driveway
- Utilities: Electricity connected (Orange & Rockland); Public sewer
- Home design: Townhouse; Condominium; Entry on level 1
- Construction: Advanced Framing Technique
- Exterior features: Advanced framing construction; Not waterfront
Interior
- Kitchen: Eat-in kitchen; Kitchen island; Pantry
- Bedrooms: Bedrooms located on entry level
- Bathrooms: 3 full bathrooms; 1 half bathroom
- Heating & cooling: Baseboard heating; Central air conditioning
- Interior features: Eat-in kitchen; Kitchen island; Open floorplan; Pantry; Primary bathroom; Walk-in closet(s); Unfinished attic; No basement
- Laundry & utility: Dedicated laundry room
Neighborhood map
What this means for you Summary
Snapshot
- This is a 5-bed/3.5-bath condo listed at $1.15M. Condition is rated excellent.
Deal economics
- At list price, monthly cash flow is $2k ($18k/yr) — positive.
- The deal already cash-flows at list — no discount required.
- Meets the 1% rule at list price ($12k rent vs $1.15M).
- Cap rate 7.9% vs local median 1.7% in Monsey — top-decile yield for the area; either an underpriced asset or a hidden risk that comps aren't pricing in. Stress-test before assuming the spread holds.
Location & tenants
- Location reads 62/100 on livability (#862 in NY) — a middle-class / working-renter tenant base. Strengths: health & safety A-, crime B; Watch: employment D+, amenities D, commute F.
- East Ramapo Central School District (Spring Valley) (suburban): math 22% / reading 34% proficiency, ranked #576 of 590 in NY (top 98%) — low school quality limits family demand, transient renter base, plan for 1-2y turnover; 68% free/reduced lunch — lower-income household profile, screen leases tightly.
- Zoned schools: East Ramapo Early Childhood Center At Kakiat (386 students, 53% FRL); Pomona Middle School (math 6% / reading 19%, grade F, #713 of 729 statewide, top 98%, 574 students, 81% FRL); Ramapo High School (math 66% / reading 76%, grade B+, #699 of 1,100 statewide, top 64%, 1,603 students, 83% FRL) — zoned schools at 72% FRL track the district average.
- Zoned-school proficiency averages 42% at this address vs 28% district-wide (+14 pts) — the actual schools serving this property are materially stronger than the East Ramapo Central School District (Spring Valley) average implies; a family-tenant draw the district grade alone would hide.
- Market conditions: 153 active listings in the ZIP; 1 comparable units currently listed for rent nearby; 429 units permitted in Rockland County in 2024 (231 in 5+ unit buildings).
Forward outlook
- Local home prices are declining (-3.0%/yr); year-one equity from $8k of loan paydown is wiped out by about $34k of value loss. Plan a longer hold.
- Rockland County population projected at +7% by 2050 — modest demand growth; plan on rents tracking national, not racing it.
Negotiation context
- Only 1 days on market — expect competitive offers; lowballing is unlikely to land.
Risks & watch-outs
- Climate carrying-cost: extreme-heat days projected 7→15/yr by 2055 (HVAC capex compounding) — expect insurance premiums to compound above CPI over the hold.
Questions for the listing agent
- Any open or pending special assessments — roof, HVAC, plumbing, elevator, façade? What's the per-unit balance and payoff schedule, and is the seller paying it off at close or rolling it to the buyer?
- Is there a deadline driving the sale (1031 exchange, divorce, estate, relocation)? That informs how much negotiation room exists.
- Schools are D-rated, which usually means shorter tenancies and higher turnover. Who's the typical renter profile here, and what's been the actual vacancy rate?
- What's the average days-on-market for RENTAL listings here right now (not sales)? A rising rental-DOM trend means longer vacancies and softer asking-rent achievability than the comps imply.
- What's the recent tenant-quality profile in this submarket — average credit score on applications, eviction rate, late-payment / NSF rate, and stable-employment percentage? A property-management company in the area should have these aggregated.
- How much new apartment / multifamily construction is in the pipeline within 1–3 miles? Heavy new supply (>2% of stock underway) typically softens rents 12–24 months out; light construction supports rent growth.
Investment metrics
- 1% rule
- 1.04% ✓
- Cap rate
- 7.90%
- Cash-on-cash
- 5.74%
- DSCR
- 1.26
- GRM
- 8.0
CMA / ARV
No comps found within radius.
Projected returns pro-forma
-3.0% appreciation · 3.0% rent growth · sell at horizon
- IRR
- -7.4%
- Equity multiple
- 0.73×
- Total profit
- $-87,953
- Equity at exit
- $171,320
- IRR
- 2.2%
- Equity multiple
- 1.16×
- Total profit
- $50,406
- Equity at exit
- $99,345
Cash invested: $321,720 (down + closing). Projections, not guarantees.
Landlord ↔ Tenant lean methodology
- Overall (STATE)
- 15 Strongly Tenant-Friendly
- State New York
- 15 Strongly Tenant-Friendly · D+10
- County
- — inherits STATE
- City
- — inherits STATE
ZIP-level market 10952
- Active inventory
- 153
- Price-to-rent
- 8.0×
Monthly cashflow live
- Estimated rent
- $12,000 medium interval (Pro) →
- Mortgage (P&I)
- −$6,025
- Tax est. 1.5%
- −$1,436 /mo · $17,235/yr
- Insurance
- −$479
- HOA
- −$0
- Vacancy / Maint / Mgmt
- −$2,520
- Net cashflow
- $1,540
Break-even live
UW: 25.0% down · 7.5% · 30yr · 1.5% tax · 5.0% vac · 8.0% maint · 8.0% mgmt
Financing live
Cash to close
- Down payment
- $287,250
- Closing costs
- $34,470
- Reserves months
- —
- Total cash needed
- —
Loan-product check · same deal, 3 products live
Conventional
25% down · 7.5% · 30yr
- Down + closing
- —
- Monthly P&I
- —
- Monthly cashflow
- —
- DSCR
- —
- Eligible?
- —
Personal DTI + credit; lowest rate.
DSCR
20% down · 8.5% · 30yr
- Down + closing
- —
- Monthly P&I
- —
- Monthly cashflow
- —
- DSCR
- —
- Eligible?
- —
No personal income docs; deal must DSCR.
Hard money
10% down · 12.0% · 12mo
- Down + closing
- —
- Monthly P&I
- —
- Monthly cashflow
- —
- DSCR
- —
- Eligible?
- —
Short-term bridge; refi at stabilization.
Rent comps 1 comps
| Address | Beds | Baths | Sqft | Rent | $/sqft | DOM | Units | Dist |
|---|---|---|---|---|---|---|---|---|
| 9 E Stemmer Ln Suffern, NY | 5.0 | 3.0 | 2432 | $12,000 | $4.93 | 1d | 1 | 1.44mi |
HOA detail condo
- Monthly dues
- $0 · $0/yr
- Assessments
- None detected in remarks — confirm with the listing agent.
Listing history 3 events
-
2026-06-10status $1,149,000 Pending 1 DOM
-
2026-06-08remarks 693-char remark
-
2026-06-08$1,149,000 Active 1 DOM
ⓘ Source: listings_history table (triggers on properties + properties_extension) + one-shot
backfill from property_details.listing_events for pre-trigger history.
Climate risk First Street
- Flood 1/10 Low FEMA zone X (unshaded) · 0% chance over 30 yrs
- Wildfire 1/10 Low
- Heat 5/10 Major 7 d/yr ≥97°F today · 15 d/yr by 30 yrs out
- Wind 4/10 Moderate 24% chance of damaging wind over 30 yrs
- Air quality 3/10 Moderate 2 unhealthy d/yr today · 4 by 30 yrs out
Nearby sold comps map
Loading sold comps map…
Walkable amenities ~0.75 mi
Loading nearby amenities…
Taxation est. · year 1
- Rental income
- $144,000
- − Mortgage interest
- −$64,362
- − Property taxes
- −$17,235
- − Insurance
- −$5,745
- − Repairs & maintenance
- −$11,520
- − Management
- −$11,520
- − Depreciation
- −$33,425
- Taxable income
- $193
- Est. tax owed @ 24.0%
- −$46
- After-tax cash flow
- $18,428/yr
For passive investors: Depreciation is non-cash, so a rental often shows a tax loss while cash-flowing — sheltering income. Rental losses are passive: they offset passive income freely, and up to $25,000/yr can offset ordinary (W-2) income if you actively participate and your MAGI is under $100k (phasing out to $0 by $150k); unused losses carry forward. On sale, claimed depreciation is recaptured at up to 25%, and gains may owe capital-gains tax (a 1031 exchange can defer both). Figures are a year-1 estimate at your 24.0% rate — not tax advice; consult a CPA.
Condition & rehab AI · 1 photo
This brand new construction luxury townhouse is in excellent condition with modern finishes and ample living space, making it an ideal investment property.
Value-add opportunities
- Both Landscaping improvements — Enhances curb appeal and adds value for both resale and rental.
- Both Interior paint touch-ups — Freshens the interior and enhances the home's appeal for potential buyers or renters.
Renovation cost estimate screening
Value-add ROI direction
- Both Landscaping improvements — Enhances curb appeal and adds value for both resale and rental. ↑
- Both Interior paint touch-ups — Freshens the interior and enhances the home's appeal for potential buyers or renters. ↑
ⓘ Cost ranges are severity-bucket heuristics (US national rule-of-thumb). Get contractor quotes + a written scope before underwriting a rehab budget.
Schools (NCES district)
- District
- East Ramapo Central School District (Spring Valley)
- NCES district ID
- 3627810
- Math proficiency
- 22% ▼ -10.00%
- Reading proficiency
- 34% ▼ -2.00%
- Median HH income
- $61,547
- Composite
- 25.6/100
- National rank
- #7418
- State rank
- #576 of 590 in NY
Livability — Monsey
- Score
- 62/100
- State rank
- #862
- US rank
- #16633
Category grades
Schools grade is shown separately in the Schools card above.
Census & demographics
- Census place
- Monsey, NY
- City population
- 47,169
- Population (ZIP)
- 47,169
Population outlook (Rockland County) Hauer SSP2
- Today (2025)
- 339,642 people
- By 2030
- 345,987 · +1.9%
- By 2040
- 357,178 · +5.2%
- By 2050
- 362,456 · +6.7%
- By 2075
- 367,281 · +8.1%
- By 2100
- 328,211 · -3.4%
Race, ethnicity, and origin ACS 2023
- Neighborhood character
- Predominantly White (88%)
- Race & ethnicity
- White 88% Black 6% Hispanic / Latino 4% Two or more races 3%
- Common ancestry
- Romanian 7% Italian 5% Hispanic 5%
- Foreign-born
- 12% · Canada
- Languages at home
- 34% English-only · German/W. Germanic 55% French/Haitian/Cajun 5% Spanish 2%
Political lean MEDSL · Rockland
- 2024 margin
- R (+11.8) · D 44.1% · R 55.9%
- 2008→2024 swing
- -17.7pp toward R · 2008: 5.9pp · 2024: -11.8pp
- All cycles
- 2024: R+11.8 2020: D+1.7 2016: D+5.1 2012: D+6.6 2008: D+5.9
Not yet ingested
- Civics
- —
Market trends
- HPI YoY
- ▼ -671.35%
- Current HPI
- 399.2068
- Rent YoY
- —
- Metro
- —
- State GDP YoY
- ▲ 2.60%
- F500 in state
- 92
Industry mix (Fortune 500 HQ in NY)
| Industry | F500 HQs | Revenue |
|---|---|---|
| Financial Services | 10 | $950B |
|
||
| Consumer Goods | 9 | $162B |
|
||
| Insurance | 4 | $225B |
|
||
| Telecommunications | 2 | $144B |
|
||
| Pharmaceuticals | 2 | $112B |
|
||
| Media / Entertainment | 2 | $69B |
|
||
Price history
1 event — show timeline
- 2026-06-08 Listed $1,149,000 OneKey® MLS as Distributed by MLS Grid
Cash-flow waterfall
monthlySold comps — $/sqft
last 12 mo · ≤1 miLoading sold comps…