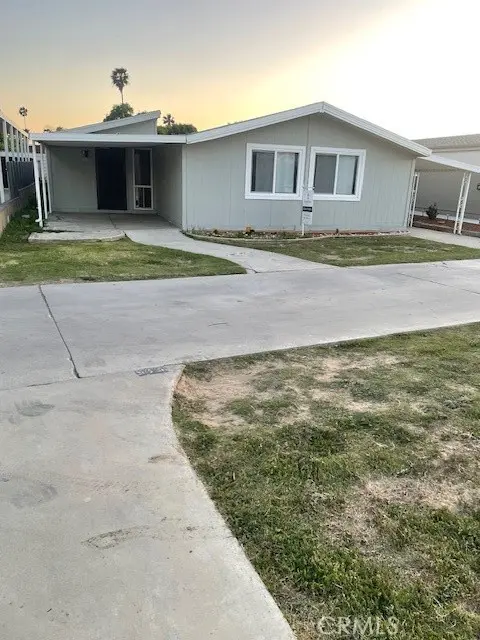
5800-601 Hamner Ave #601 · Eastvale, CA
Flood risk 4/10 · Minor
- FEMA flood zone
- X (unshaded)
- Chance of flooding over 30 yrs
- 0.2%
- Est. flood insurance / yr
- $507 – $1,088
Fire risk 7/10 · Major
- Est. fire insurance / yr
- $659 – $1,223
Heat risk 7/10 · Major
- Hot days now (above 102°F)
- 3 days/yr
- Hot days in 30 yrs
- 7 days/yr
Wind risk 1/10 · Minimal
- Chance of severe wind over 30 yrs
- —
Air-quality risk 9/10 · Severe
- Unhealthy air days now
- 23 days/yr
- Unhealthy air days in 30 yrs
- 26 days/yr
Risk factors via First Street. Map © Google.
Why this score? — see what drove the B grade
The composite is a weighted blend of 9 inputs, each scored 0–100. Each bar is that input's sub-score; the figure is the points it added to the 100-point composite (weight × sub-score).
- Cash flow +30.0/30.0
- 1% rule +10.0/10.0
- DSCR +10.0/10.0
- ARV discount +7.5/15.0
- Condition / age +4.0/5.0
- Rent growth +3.2/5.0
- Livability +3.2/5.0
- Schools +3.1/10.0
- Appreciation +0.0/10.0
$215,000
🖨 Deal sheet (PDF) 📄 Offer letter ✓ Due diligence
Listing remarks
One of the Largest Manufactured Homes in the Community – Triple-Wide, 1,920 Sq. Ft. ! Welcome to this spacious and well-maintained 4-bedroom, 2-bathroom triple-wide manufactured home located in the heart of Eastvale. Offering approximately 1,920 square feet of living space, this is one of the largest homes in the community. Situated within a desirable all-ages, family-friendly community with 24-hour gated security, residents enjoy a variety of amenities including an Olympic-size swimming pool, scenic lake, basketball court, clubhouse/party room, greenbelt areas, school bus transportation, and pet-friendly policies. Inside, you'll find a functional open layout with four generously s
Key facts
- Triple-wide
- Basketball court
- Scenic lake
Tags
Property features AI
Finance
- Other: Density indicated as approximately 36-40 units per acre
- Financial info: Land lease amount approximately $1,400
- HOA & community: Association amenities include a pool; Located in a community with shared amenities (fishing, lake, park); Property is on a land lease
Exterior
- Parking: Located in the Swanlake park
- Utilities: Public/District water; Sewer or septic (unknown type)
- Home design: Single-story home; Mobile home model: Levitt; Mobile home dimensions approximately 30 ft by 64 ft; Mobile home remains on site
- Construction: Year built: source listed as other
- Exterior features: Community pool; Community offers fishing, lake access, and park amenities
Interior
- Bathrooms: 2 full bathrooms
- Interior features: Entry level is at ground level; Entry location: None indicated
- Laundry & utility: Washer/dryer hookups for gas and electric; Has laundry
Neighborhood map
What this means for you Summary
Snapshot
- This is a 4-bed/2.0-bath manufactured listed at $215k. Condition is rated good.
Deal economics
- At list price, monthly cash flow is $1k ($17k/yr) — positive.
- The deal already cash-flows at list — no discount required.
- Meets the 1% rule at list price ($4k rent vs $215k).
- Recommended offer: $212k (1.5% below list) — sets the bar for market timing.
- Cap rate 14.4% vs local median 2.9% in Eastvale — top-decile yield for the area; either an underpriced asset or a hidden risk that comps aren't pricing in. Stress-test before assuming the spread holds.
Location & tenants
- Location reads 63/100 on livability (#464 in CA) — a middle-class / working-renter tenant base. Strengths: employment A+, housing A+, crime A-; Watch: amenities F, commute F, cost of living F.
- Jurupa Unified (suburban): math 25% / reading 38% proficiency, ranked #953 of 1,400 in CA (top 68%) — families likely to look elsewhere, expect single-tenant / working-renter base with shorter leases; 64% free/reduced lunch — lower-income household profile, screen leases tightly.
- Market conditions: Rents rising (+3.0%/yr); 64 active listings in the ZIP; 40 comparable units currently listed for rent nearby; rentals at typical pace (median 25d on market — plan ~3-4 weeks tenant-placement turnaround); high-income renter base; 9,195 units permitted in Riverside County in 2024 (1,512 in 5+ unit buildings).
- This rent runs 39% of the median local income ($115k/yr) — at the standard rent-burdened threshold; future hikes will face affordability resistance.
Forward outlook
- Local home prices are declining (-3.0%/yr); year-one equity from $1k of loan paydown is wiped out by about $6k of value loss. Plan a longer hold.
- Riverside County population projected at +22% by 2050 — long-run rental-demand tailwind backs the buy-and-hold thesis.
- At projected returns (-3.0% appreciation + 3.0% rent growth), your $60k cash investment doubles in ~5 years — after that, you're playing with house money.
Negotiation context
- It's been on market 16 days — a 2% lower offer ($212k) is reasonable based on typical stale-listing flexibility.
- 11 sale attempts since 2y ago with the ask held roughly flat each time — persistent listings suggest the price (not the market) is what's stuck; bring a comps-based counter.
Risks & watch-outs
- Climate carrying-cost: major wildfire risk; extreme-heat days projected 3→7/yr by 2055 (HVAC capex compounding) — expect insurance premiums to compound above CPI over the hold.
Questions for the listing agent
- Built in 1977 — when were the roof, HVAC, electrical panel, plumbing, and water heater last replaced?
- Is there a deadline driving the sale (1031 exchange, divorce, estate, relocation)? That informs how much negotiation room exists.
- Schools are B-rated — typically a magnet for longer-tenancy family renters. What's the average tenant stay here, and is there a school-zone premium baked into asking?
- What's the average days-on-market for RENTAL listings here right now (not sales)? A rising rental-DOM trend means longer vacancies and softer asking-rent achievability than the comps imply.
- What's the recent tenant-quality profile in this submarket — average credit score on applications, eviction rate, late-payment / NSF rate, and stable-employment percentage? A property-management company in the area should have these aggregated.
- How much new for-sale + rental construction is in the pipeline within 1–3 miles? Heavy new supply typically softens prices + rents 12–24 months out; constrained supply supports both.
Investment metrics
- 1% rule
- 1.73% ✓
- Cap rate
- 14.37%
- Cash-on-cash
- 28.83%
- DSCR
- 2.28
- GRM
- 4.8
CMA / ARV
- ARV (median comp)
- $130,452
- List price
- $215,000
- Delta
- 60.98%
- Verdict
- OVERPRICED
- Comps
- 20 within 1.0 mi
Show comp detail 12 sales within ~0.75 mi
| Address | Dist | Beds/Ba | Sqft | Sold | Price | $/sf | Match |
|---|---|---|---|---|---|---|---|
| 5800 Hamner Ave #197 | 0.10mi | 4/2.0 | 1,344 | 2mo | $249,000 | $185 | 81 |
| 5800 Hamner Ave #670 | 0.21mi | 4/2.0 | 1,728 | 5mo | $185,000 | $107 | 74 |
| 5800 Hamner #431 | 0.21mi | 3/2.0 (-1) | 1,248 | 1mo | $155,000 | $124 | 72 |
| 5800 Hamner #64 | 0.12mi | 3/2.0 (-1) | 1,056 | 6mo | $160,000 | $152 | 72 |
| 5800 Hamner Ave #436 | 0.21mi | 3/2.0 (-1) | 1,230 | 1mo | $235,000 | $191 | 71 |
| 5800 Hamner Ave #72 | 0.21mi | 3/2.0 (-1) | 1,344 | 3mo | $255,000 | $190 | 70 |
| 5800 Hamner #156 | 0.21mi | 3/2.0 (-1) | 1,152 | 3mo | $172,500 | $150 | 70 |
| 5800 Hamner Ave #447 | 0.21mi | 3/2.5 (-1) | 1,632 | 1mo | $115,000 | $70 | 70 |
| 5800 Hamner Ave #568 | 0.27mi | 3/2.0 (-1) | 1,344 | 0mo | $247,500 | $184 | 70 |
| 5800 Hamner #416 | 0.21mi | 3/3.0 (-1) | 1,200 | 1mo | $115,000 | $96 | 68 |
| 5800 Hamner Ave #237 | 0.29mi | 3/2.0 (-1) | 1,440 | 4mo | $82,500 | $57 | 66 |
| 5800 Hamner #53 | 0.21mi | 3/1.0 (-1) | 720 | 3mo | $58,000 | $81 | 66 |
Match score weights: distance 35% · size 25% · config 20% · recency 20%. Top-matched comps best support the ARV.
Projected returns pro-forma
-3.0% appreciation · 3.0% rent growth · sell at horizon
- IRR
- 23.2%
- Equity multiple
- 1.95×
- Total profit
- $57,334
- Equity at exit
- $32,057
- IRR
- 31.1%
- Equity multiple
- 3.80×
- Total profit
- $168,769
- Equity at exit
- $18,589
Cash invested: $60,200 (down + closing). Projections, not guarantees.
Landlord ↔ Tenant lean methodology
- Overall (STATE)
- 18 Strongly Tenant-Friendly
- State California
- 18 Strongly Tenant-Friendly · D+13
- County
- — inherits STATE
- City
- — inherits STATE
ZIP-level market 91752
- Rents YoY
- 3.0%
- Active inventory
- 64
- Price-to-rent
- 4.8×
Monthly cashflow live
- Estimated rent
- $3,712 high interval (Pro) →
- Mortgage (P&I)
- −$1,127
- Tax est. 1.5%
- −$269 /mo · $3,225/yr
- Insurance
- −$90
- HOA
- −$0
- Vacancy / Maint / Mgmt
- −$779
- Net cashflow
- $1,446
Break-even live
Sensitivity live
| Price | -10% $1,595 | -5% $1,521 | +0% $1,446 | +5% $1,372 | +10% $1,298 |
|---|---|---|---|---|---|
| Rent | -10% $1,153 | -5% $1,300 | +0% $1,446 | +5% $1,593 | +10% $1,740 |
| Rate | -1.0pp $1,555 | -0.5pp $1,501 | base $1,446 | +0.5pp $1,391 | +1.0pp $1,334 |
UW: 25.0% down · 7.5% · 30yr · 1.5% tax · 5.0% vac · 8.0% maint · 8.0% mgmt
Financing live
Cash to close
- Down payment
- $53,750
- Closing costs
- $6,450
- Reserves months
- —
- Total cash needed
- —
Loan-product check · same deal, 3 products live
Conventional
25% down · 7.5% · 30yr
- Down + closing
- —
- Monthly P&I
- —
- Monthly cashflow
- —
- DSCR
- —
- Eligible?
- —
Personal DTI + credit; lowest rate.
DSCR
20% down · 8.5% · 30yr
- Down + closing
- —
- Monthly P&I
- —
- Monthly cashflow
- —
- DSCR
- —
- Eligible?
- —
No personal income docs; deal must DSCR.
Hard money
10% down · 12.0% · 12mo
- Down + closing
- —
- Monthly P&I
- —
- Monthly cashflow
- —
- DSCR
- —
- Eligible?
- —
Short-term bridge; refi at stabilization.
Rent comps 40 comps
| Address | Beds | Baths | Sqft | Rent | $/sqft | DOM | Units | Dist |
|---|---|---|---|---|---|---|---|---|
| 5929 Rockport Rd Eastvale, CA | 3.0 | 2.5 | 1605 | $3,300 | $2.06 | 25d | 1 | 0.17mi |
| 12515 Celebration Dr Eastvale, CA | 3.0 | 2.0 | 1760 | $3,400 | $1.93 | 44d | 1 | 0.19mi |
| 12488 Celebration Dr Eastvale, CA | 4.0 | 3.0 | 2828 | $3,550 | $1.26 | 6d | 1 | 0.23mi |
| 5634 Cambria Dr Eastvale, CA | 3.0 | 3.0 | 2828 | $4,000 | $1.41 | 44d | 1 | 0.28mi |
| 12766 Bolsa Dr Eastvale, CA | 3.0 | 2.5 | 1772 | $3,300 | $1.86 | 44d | 1 | 0.34mi |
| 12782 Lomond Way Eastvale, CA | 3.0 | 2.5 | 1775 | $3,300 | $1.86 | 44d | 1 | 0.35mi |
| 12774 Bolsa Dr Eastvale, CA | 3.0 | 3.0 | 1772 | $3,395 | $1.92 | 17d | 1 | 0.35mi |
| 5464 W Homecoming Cir Eastvale, CA | 1.0–3.0 | 1.5–3.0 | 1359 | $4,299 | $3.16 | 0d | 22 | 0.36mi |
| 12788 Bolsa Dr Eastvale, CA | 4.0 | 3.5 | 1780 | $3,550 | $1.99 | 20d | 1 | 0.37mi |
| 13010 58th St Eastvale, CA | 3.0 | 2.5 | 1554 | $3,299 | $2.12 | 15d | 1 | 0.60mi |
| 5930 Ginger Dr Eastvale, CA | 3.0 | 2.5 | 1554 | $2,990 | $1.92 | 44d | 1 | 0.60mi |
| 5942 Ginger Dr Eastvale, CA | 3.0 | 2.5 | 1742 | $3,000 | $1.72 | 44d | 1 | 0.61mi |
| 12538 Tavira Ln Eastvale, CA | 3.0 | 3.5 | 1583 | $3,000 | $1.90 | 5d | 1 | 0.63mi |
| 12432 Constellation St Eastvale, CA | 3.0 | 2.0 | 1668 | $3,150 | $1.89 | 44d | 1 | 0.64mi |
| 12432 Constellation St Unit 10 Eastvale, CA | 3.0 | 2.5 | 1668 | $3,150 | $1.89 | 44d | 1 | 0.64mi |
| 12402 Constellation St Eastvale, CA | 3.0 | 3.0 | 1499 | $3,300 | $2.20 | 44d | 1 | 0.64mi |
| 6337 Andromeda Ct Eastvale, CA | 3.0 | 4.0 | 1513 | $3,300 | $2.18 | 25d | 1 | 0.66mi |
| 12967 Paradiso Dr #103 Eastvale, CA | 3.0 | 3.5 | 1597 | $6,400 | $4.01 | 0d | 1 | 0.67mi |
| 6371 Estrela Ln Eastvale, CA | 3.0 | 4.0 | 1583 | $3,500 | $2.21 | 0d | 1 | 0.67mi |
| 5945 Silveira St Eastvale, CA | 4.0 | 3.0 | 2325 | $3,600 | $1.55 | 18d | 1 | 0.69mi |
| 6055 Snapdragon St Eastvale, CA | 4.0 | 3.0 | 2664 | $3,600 | $1.35 | 25d | 1 | 0.70mi |
| 6395 Delgado Ln Eastvale, CA | 3.0 | 3.0 | 1884 | $3,250 | $1.73 | 44d | 1 | 0.70mi |
| 6400 Marbella Ln Eastvale, CA | 4.0 | 2.5 | 2075 | $3,600 | $1.73 | 44d | 1 | 0.71mi |
| 6366 Aquila Way Eastvale, CA | 3.0 | 2.5 | 1681 | $3,000 | $1.78 | 44d | 1 | 0.71mi |
| 6116 Snapdragon St Eastvale, CA | 4.0 | 3.0 | 2096 | $3,800 | $1.81 | 19d | 1 | 0.71mi |
| 6386 Pegasus Ct Eastvale, CA | 3.0 | 4.0 | 1500 | $3,100 | $2.07 | 25d | 1 | 0.72mi |
| 6397 Peacock Ct Eastvale, CA | 3.0 | 2.5 | 1668 | $6,000 | $3.60 | 0d | 1 | 0.73mi |
| 6077 Rosewood Way Eastvale, CA | 4.0 | 2.5 | 2319 | $3,750 | $1.62 | 25d | 1 | 0.76mi |
| 6001 Flagstaff Dr Eastvale, CA | 5.0 | 4.0 | 3270 | $4,200 | $1.28 | 13d | 1 | 0.79mi |
| 5942 Berryhill Dr Eastvale, CA | 4.0 | 2.5 | 2567 | $3,845 | $1.50 | 3d | 1 | 0.80mi |
| 4395 S Alegre Privado #2 Ontario, CA | 3.0 | 2.5 | 1628 | $3,600 | $2.21 | 4d | 1 | 0.81mi |
| 4130 E Malagon Privado #88 Ontario, CA | 3.0 | 2.5 | 1389 | $3,150 | $2.27 | 25d | 1 | 0.84mi |
| 4282 S Malagon Privado Ontario, CA | 3.0 | 2.5 | 1707 | $3,300 | $1.93 | 25d | 1 | 0.86mi |
| 13202 Ruby Ct Eastvale, CA | 3.0 | 2.5 | 2269 | $2,100 | $0.93 | 44d | 1 | 0.86mi |
| 4208 E Flutter Privado Ontario, CA | 5.0 | 3.0 | 2390 | $3,850 | $1.61 | 2d | 1 | 0.87mi |
| 3918 E Cambria Privado Ontario, CA | 4.0 | 3.0 | 2308 | $3,850 | $1.67 | 11d | 1 | 0.88mi |
| 3994 E Catalina St Ontario, CA | 5.0 | 3.0 | 2501 | $3,950 | $1.58 | 0d | 1 | 0.88mi |
| 4209 S Malagon Privado Ontario, CA | 3.0 | 2.5 | 1753 | $3,400 | $1.94 | 0d | 1 | 0.93mi |
| 4340 S Encinitas Ave Ontario, CA | 4.0 | 3.0 | 2308 | $3,600 | $1.56 | 15d | 1 | 0.93mi |
| 4340 S Encinitas Ave Ontario, CA | 4.0 | 3.0 | 2308 | $3,600 | $1.56 | 0d | 1 | 0.93mi |
Listing history 32 events
-
2026-06-18days on market $215,000 Active 16 DOM
-
2026-06-17days on market $215,000 Active 15 DOM
-
2026-06-16days on market $215,000 Active 14 DOM
-
2026-06-15days on market $215,000 Active 13 DOM
-
2026-06-13days on market $215,000 Active 11 DOM
-
2026-06-13days on market $215,000 Active 10 DOM
-
2026-06-09days on market $215,000 Active 7 DOM
-
2026-06-08days on market $215,000 Active 6 DOM
-
2026-06-07days on market $215,000 Active 5 DOM
-
2026-06-04days on market $215,000 Active 2 DOM
-
2026-06-03pricedays on market $215,000 Active 1 DOM
-
2026-05-31days on market $210,000 Active 113 DOM
-
2026-02-07$210,000 Active 1623-char remark
-
2025-07-03historical
-
2025-06-03$200,000 Active
-
2025-05-10historical
-
2025-04-30historical
-
2025-04-29status Active
-
2025-04-03$199,000 Active
-
2025-04-02historical
-
2025-03-04price $199,000
-
2025-02-05$225,000 Active
-
2025-02-02historical
-
2024-12-20price $220,000
-
2024-12-19$22,000 Active
-
2024-10-30historical
-
2024-09-07$225,000 Active
-
2024-08-02$219,000 Active
-
2024-07-31historical
-
2024-06-18$225,000 Active
-
2024-06-15historical
-
2024-05-15$225,000 Active
ⓘ Source: listings_history table (triggers on properties + properties_extension) + one-shot
backfill from property_details.listing_events for pre-trigger history.
Climate risk First Street
- Flood 4/10 Moderate FEMA zone X (unshaded) · 20% chance over 30 yrs
- Wildfire 7/10 Severe
- Heat 7/10 Severe 3 d/yr ≥102°F today · 7 d/yr by 30 yrs out
- Wind 1/10 Low
- Air quality 9/10 Extreme 23 unhealthy d/yr today · 26 by 30 yrs out
Nearby sold comps map
Loading sold comps map…
Walkable amenities ~0.75 mi
Loading nearby amenities…
Taxation est. · year 1
- Rental income
- $44,539
- − Mortgage interest
- −$12,043
- − Property taxes
- −$3,225
- − Insurance
- −$1,075
- − Repairs & maintenance
- −$3,563
- − Management
- −$3,563
- − Depreciation
- −$6,255
- Taxable income
- $14,815
- Est. tax owed @ 24.0%
- −$3,556
- After-tax cash flow
- $13,800/yr
For passive investors: Depreciation is non-cash, so a rental often shows a tax loss while cash-flowing — sheltering income. Rental losses are passive: they offset passive income freely, and up to $25,000/yr can offset ordinary (W-2) income if you actively participate and your MAGI is under $100k (phasing out to $0 by $150k); unused losses carry forward. On sale, claimed depreciation is recaptured at up to 25%, and gains may owe capital-gains tax (a 1031 exchange can defer both). Figures are a year-1 estimate at your 24.0% rate — not tax advice; consult a CPA.
Condition & rehab AI · 13 photos
This well-maintained and recently updated manufactured home is move-in ready with new finishes and fresh curb appeal.
Value-add opportunities
- Both landscaping — improves curb appeal and adds value
- Both fence — creates a more private and secure environment
Renovation cost estimate screening
Value-add ROI direction
- Both landscaping — improves curb appeal and adds value ↑
- Both fence — creates a more private and secure environment ↑
ⓘ Cost ranges are severity-bucket heuristics (US national rule-of-thumb). Get contractor quotes + a written scope before underwriting a rehab budget.
Schools (NCES district)
- District
- Jurupa Unified
- NCES district ID
- 0619260
- Math proficiency
- 25% ▲ 2.00%
- Reading proficiency
- 38% ▲ 2.00%
- Median HH income
- $58,100
- Composite
- 30.97/100
- National rank
- #11327
- State rank
- #953 of 1400 in CA
Livability — Eastvale
- Score
- 63/100
- State rank
- #464
- US rank
- #15853
Category grades
Schools grade is shown separately in the Schools card above.
Census & demographics
- Census place
- Eastvale, CA
- County
- Riverside County · 2,287,001 people
- City population
- 75,043
- Metro
- Riverside-San Bernardino-Ontario, CA
- Population (ZIP)
- 37,983
- Household income
- $115,177
- Rent vs Own
- Severe rent burden
- 1280.0
Population outlook (Riverside County) Hauer SSP2
- Today (2025)
- 2,664,475 people
- By 2030
- 2,802,692 · +5.2%
- By 2040
- 3,050,904 · +14.5%
- By 2050
- 3,256,783 · +22.2%
- By 2075
- 3,655,058 · +37.2%
- By 2100
- 3,766,594 · +41.4%
Race, ethnicity, and origin ACS 2023
- Neighborhood character
- Diverse neighborhood (Simpson 0.57)
- Race & ethnicity
- Hispanic / Latino 61% White 20% Two or more races 16% Asian 10% Black 7% Native American 1%
- Hispanic origin (detail)
- Mexican 54% Puerto Rican 1%
- Common ancestry
- Italian 1% Lithuanian 1% Iranian 1%
- Foreign-born
- 26% · Canada, China, South Korea
- Languages at home
- 47% English-only · Spanish 45% Tagalog/Filipino 2% Other Indo-European 2%
Political lean MEDSL · Riverside
- 2024 margin
- Toss-up / Even · D 48.0% · R 49.3% · Other 2.6%
- 2008→2024 swing
- -3.6pp toward R · 2008: 2.3pp · 2024: -1.3pp
- All cycles
- 2024: R+1.3 2020: D+8.0 2016: D+4.3 2012: R+0.4 2008: D+2.3
Not yet ingested
- Civics
- —
Market trends
- HPI YoY
- ▼ -560.99%
- Current HPI
- 426.3636
- Rent YoY
- ▲ 3.00%
- Metro
- Riverside-San Bernardino-Ontario, CA
- State GDP YoY
- ▲ 3.21%
- F500 in state
- 116
Industry mix (Fortune 500 HQ in CA)
| Industry | F500 HQs | Revenue |
|---|---|---|
| Technology | 27 | $1,492B |
|
||
| Financial Services | 3 | $174B |
|
||
| Retail | 3 | $44B |
|
||
| Insurance | 3 | $26B |
|
||
| Media / Entertainment | 2 | $115B |
|
||
| Pharmaceuticals / Biotech | 2 | $62B |
|
||
Price history
-4.4% since first listed22 events — show timeline
- 2026-06-02 Listed $215,000 CRMLS
- 2026-05-30 Listing Removed — CRMLS
- 2026-02-07 Listed $210,000 CRMLS
- 2025-07-03 Listing Removed — CRMLS
- 2025-06-03 Listed $200,000 CRMLS
- 2025-05-10 Listing Removed — CRMLS
- 2025-04-30 Listing Removed — CRMLS
- 2025-04-29 Relisted — CRMLS
- 2025-04-03 Listed $199,000 CRMLS
- 2025-04-02 Listing Removed — CRMLS
- 2025-03-04 Price Changed $199,000 CRMLS
- 2025-02-05 Listed $225,000 CRMLS
- 2025-02-02 Listing Removed — CRMLS
- 2024-12-20 Price Changed $220,000 CRMLS
- 2024-12-19 Listed $22,000 CRMLS
- 2024-10-30 Listing Removed — CRMLS
- 2024-09-07 Listed $225,000 CRMLS
- 2024-08-02 Listed $219,000 CRMLS
- 2024-07-31 Listing Removed — CRMLS
- 2024-06-18 Listed $225,000 CRMLS
- 2024-06-15 Listing Removed — CRMLS
- 2024-05-15 Listed $225,000 CRMLS
Cash-flow waterfall
monthlySold comps — $/sqft
last 12 mo · ≤1 miLoading sold comps…