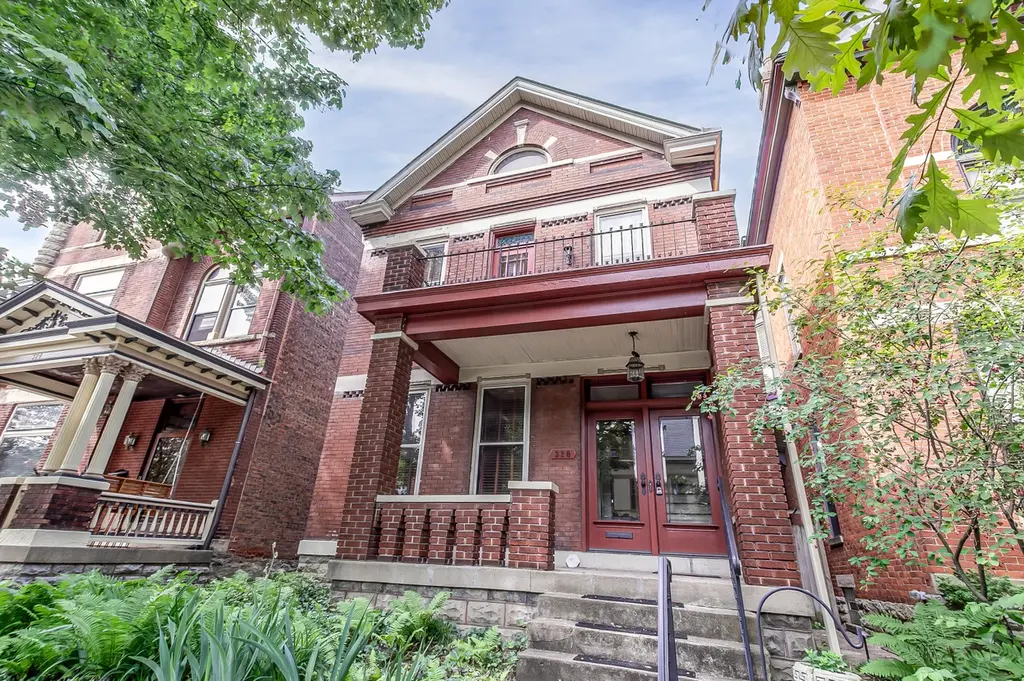
320 Overton St · Newport, KY
Flood risk 1/10 · Minimal
- FEMA flood zone
- X (unshaded)
- Chance of flooding over 30 yrs
- 0.0%
- Est. flood insurance / yr
- $473 – $860
Fire risk 1/10 · Minimal
- Est. fire insurance / yr
- $839 – $1,559
Heat risk 5/10 · Moderate
- Hot days now (above 103°F)
- 7 days/yr
- Hot days in 30 yrs
- 19 days/yr
Wind risk 2/10 · Minimal
- Chance of severe wind over 30 yrs
- 1.0%
Air-quality risk 3/10 · Minor
- Unhealthy air days now
- 2 days/yr
- Unhealthy air days in 30 yrs
- 3 days/yr
Risk factors via First Street. Map © Google.
Why this score? — see what drove the C grade
The composite is a weighted blend of 9 inputs, each scored 0–100. Each bar is that input's sub-score; the figure is the points it added to the 100-point composite (weight × sub-score).
- Cash flow +22.2/30.0
- ARV discount +13.2/15.0
- DSCR +7.1/10.0
- 1% rule +4.4/10.0
- Livability +4.1/5.0
- Rent growth +3.7/5.0
- Condition / age +2.5/5.0
- Schools +1.7/10.0
- Appreciation +0.0/10.0
$449,900
🖨 Deal sheet 📄 Offer letter ✓ Due diligence
Listing remarks MLS
Extensive rehab needed for single family-Licenses expired for 2 family property built and used as 2 family. Located in upscale Historic Mansion Hill. Walk to Levee.
Key facts
- Exposed brick walls
- Large windows
- Wood floors
Tags
Property features AI
Exterior
- Parking: 2 parking spaces; Detached garage; Garage with door opener; Garage faces rear; On-street parking available; Approximately 1.5 garage spaces
- Utilities: Public water; Public sewer; Cable available
- Home design: Single-family house; Three or more levels; Built in 1890; Has a view
- Construction: Brick construction; Shingle/asphalt roof; Stone foundation
- Exterior features: Private yard; Balcony; Patio; Porch; Perimeter privacy wood fencing; Paved city street frontage
Interior
- Kitchen: Dishwasher; Microwave; Eat-in layout
- Bedrooms: Primary bedroom (12 x 13)
- Bathrooms: 1 full bathroom; 1 half bathroom
- Heating & cooling: Central air; Heating present
- Interior features: Entrance foyer; Eat-in kitchen; Crown molding; Ceiling fans; High ceilings; Multi-panel doors; Natural woodwork; Master bedroom on main level; Full basement; Fireplace (inoperable)
- Laundry & utility: Laundry in basement
Neighborhood map
What this means for you Summary
Snapshot
- This is a 4-bed/2.0-bath single-family listed at $450k.
Deal economics
- At list price, monthly cash flow is $729 ($9k/yr) — positive.
- The deal already cash-flows at list — no discount required.
- To meet the 1% rule (rent ≥ 1% of price), the offer needs to be $425k (5.6% below list).
- Recommended offer: $425k (5.6% below list) — sets the bar for 1% rule.
- Cap rate 8.2% vs local median 4.9% in Newport — top-decile yield for the area; either an underpriced asset or a hidden risk that comps aren't pricing in. Stress-test before assuming the spread holds.
Location & tenants
- Location reads 82/100 on livability (#58 in KY, #1,070 nationally) — a professional / high-income tenant draw. Strengths: amenities A+, commute A+, cost of living A+; Watch: crime F, employment D-.
- Newport Independent (suburban): math 14% / reading 26% proficiency, ranked #160 of 165 in KY (top 97%) — low school quality limits family demand, transient renter base, plan for 1-2y turnover; 79% free/reduced lunch — lower-income household profile, screen leases tightly.
- Zoned schools: Newport High School (math 16% / reading 28%, grade F, #202 of 254 statewide, top 82%, 579 students, 84% FRL).
- Market conditions: Rents rising fast (+4.6%/yr); 236 active listings in the ZIP; 13 comparable units currently listed for rent nearby; rentals leasing fast (median 12d on market — plan ~1-2 weeks tenant-placement turnaround); 247 units permitted in Campbell County in 2024 (77 in 5+ unit buildings).
- At $4,249/mo this rent would consume 85% of the median local household income ($60k/yr) (locally 1136% of renters already pay >50% of income on rent) — very limited rent-growth headroom before tenants either downsize or default.
Forward outlook
- Local home prices are declining (-3.0%/yr); year-one equity from $3k of loan paydown is wiped out by about $13k of value loss. Plan a longer hold.
Negotiation context
- Only 4 days on market — expect competitive offers; lowballing is unlikely to land.
- 2 sale attempts since 15y ago with the ask held roughly flat each time — persistent listings suggest the price (not the market) is what's stuck; bring a comps-based counter.
- Current owner paid $110k; list at $450k implies a 309% gain — meaningful room to come down on a strong offer.
Risks & watch-outs
- Watch-outs: built in 1890 — expect roof / HVAC / electrical / plumbing capex.
- Climate carrying-cost: extreme-heat days projected 7→19/yr by 2055 (HVAC capex compounding) — expect insurance premiums to compound above CPI over the hold.
Questions for the listing agent
- Built in 1890 — when were the roof, HVAC, electrical panel, plumbing, and water heater last replaced?
- Is there a deadline driving the sale (1031 exchange, divorce, estate, relocation)? That informs how much negotiation room exists.
- Schools are D-rated, which usually means shorter tenancies and higher turnover. Who's the typical renter profile here, and what's been the actual vacancy rate?
- Crime grade is F in this area — have there been break-ins, vandalism, or insurance claims at this property in the last 3 years? What carrier currently insures it and at what premium?
- What's the average days-on-market for RENTAL listings here right now (not sales)? A rising rental-DOM trend means longer vacancies and softer asking-rent achievability than the comps imply.
- What's the recent tenant-quality profile in this submarket — average credit score on applications, eviction rate, late-payment / NSF rate, and stable-employment percentage? A property-management company in the area should have these aggregated.
- How much new for-sale + rental construction is in the pipeline within 1–3 miles? Heavy new supply typically softens prices + rents 12–24 months out; constrained supply supports both.
Investment metrics
- 1% rule
- 0.94% ✗
- Cap rate
- 8.24%
- Cash-on-cash
- 6.94%
- DSCR
- 1.31
- GRM
- 8.8
CMA / ARV
- ARV (on-the-fly)
- $515,355
- Comps found
- 12
Show comp detail 12 sales within ~0.75 mi
| Address | Dist | Beds/Ba | Sqft | Sold | Price | $/sf | Match |
|---|---|---|---|---|---|---|---|
| 228 E 4th St | 0.11mi | 3/2.5 (-1) | 2,460 (+3%) | 11mo | $500,000 | $203 | 74 |
| 615 Saratoga St | 0.24mi | 3/1.5 (-1) | 2,400 (+0%) | 13mo | $325,000 | $135 | 71 |
| 530 Lexington Ave | 0.14mi | 3/2.5 (-1) | 2,122 (-12%) | 0mo | $600,000 | $283 | 67 |
| 728 Park Ave | 0.35mi | 3/3.5 (-1) | 2,490 (+4%) | 3mo | $925,000 | $371 | 64 |
| 838 Maple Ave | 0.47mi | 4/2.5 | 2,414 (+1%) | 13mo | $462,500 | $192 | 64 |
| 612 Roberts St | 0.23mi | 3/2.5 (-1) | 2,232 (-7%) | 13mo | $284,900 | $128 | 60 |
| 416 E 8th St | 0.37mi | 3/2.5 (-1) | 2,251 (-6%) | 7mo | $455,000 | $202 | 60 |
| 606 Monroe St | 0.19mi | 3/2.0 (-1) | 2,092 (-13%) | 10mo | $729,000 | $348 | 57 |
| 1020 York St | 0.69mi | 3/3.0 (-1) | 2,416 (+1%) | 3mo | $520,000 | $215 | 55 |
| 816 Park Ave | 0.40mi | 3/3.0 (-1) | 2,200 (-8%) | 10mo | $599,000 | $272 | 51 |
| 842 Monroe St | 0.44mi | 3/2.5 (-1) | 2,217 (-8%) | 11mo | $749,900 | $338 | 50 |
| 725 Columbia St | 0.52mi | 4/3.0 | 2,752 (+15%) | 3mo | $385,000 | $140 | 45 |
Match score weights: distance 35% · size 25% · config 20% · recency 20%. Top-matched comps best support the ARV.
Projected returns pro-forma
-3.0% appreciation · 4.64% rent growth · sell at horizon
- IRR
- -4.1%
- Equity multiple
- 0.84×
- Total profit
- $-19,591
- Equity at exit
- $67,082
- IRR
- 7.1%
- Equity multiple
- 1.57×
- Total profit
- $72,007
- Equity at exit
- $38,899
Cash invested: $125,972 (down + closing). Projections, not guarantees.
Landlord ↔ Tenant lean methodology
- Overall (STATE)
- 83 Strongly Landlord-Friendly
- State Kentucky
- 83 Strongly Landlord-Friendly · R+16
- County
- — inherits STATE
- City
- — inherits STATE
ZIP-level market 41071
- Rents YoY
- 4.6%
- Active inventory
- 236
- Price-to-rent
- 8.8×
Monthly cashflow live
- Estimated rent
- $4,249 high interval (Pro) →
- Mortgage (P&I)
- −$2,359
- Tax from tax record
- −$81 /mo · $976/yr
- Insurance
- −$187
- HOA
- −$0
- Vacancy / Maint / Mgmt
- −$892
- Net cashflow
- $729
Break-even live
UW: 25.0% down · 7.5% · 30yr · 1.5% tax · 5.0% vac · 8.0% maint · 8.0% mgmt
Financing live
Cash to close
- Down payment
- $112,475
- Closing costs
- $13,497
- Reserves months
- —
- Total cash needed
- —
Loan-product check · same deal, 3 products live
Conventional
25% down · 7.5% · 30yr
- Down + closing
- —
- Monthly P&I
- —
- Monthly cashflow
- —
- DSCR
- —
- Eligible?
- —
Personal DTI + credit; lowest rate.
DSCR
20% down · 8.5% · 30yr
- Down + closing
- —
- Monthly P&I
- —
- Monthly cashflow
- —
- DSCR
- —
- Eligible?
- —
No personal income docs; deal must DSCR.
Hard money
10% down · 12.0% · 12mo
- Down + closing
- —
- Monthly P&I
- —
- Monthly cashflow
- —
- DSCR
- —
- Eligible?
- —
Short-term bridge; refi at stabilization.
Rent comps 13 comps
| Address | Beds | Baths | Sqft | Rent | $/sqft | DOM | Units | Dist |
|---|---|---|---|---|---|---|---|---|
| 118 Beech St Newport, KY | 3.0 | 2.0 | 1610 | $2,400 | $1.49 | 1d | 1 | 0.26mi |
| 835 York St #1 Newport, KY | 5.0 | 2.0 | 2700 | $2,395 | $0.89 | 43d | 1 | 0.55mi |
| 987 Hill St Cincinnati, OH | 3.0 | 3.0 | 2878 | $7,000 | $2.43 | 1d | 1 | 0.77mi |
| 140 W 13th St Newport, KY | 3.0 | 3.5 | 2505 | $4,200 | $1.68 | 11d | 1 | 1.03mi |
| 923 Paradrome St Cincinnati, OH | 3.0 | 2.5 | 2098 | $3,000 | $1.43 | 23d | 1 | 1.03mi |
| 1287 Ida St Cincinnati, OH | 3.0 | 2.5 | 2494 | $4,700 | $1.88 | 17d | 1 | 1.15mi |
| 1 W 4th St Cincinnati, OH | 3.0 | 1.0–3.5 | 1675 | $9,200 | $5.49 | 2d | 96 | 1.16mi |
| 417 Vine St Cincinnati, OH | 3.0 | 2.0 | 1602 | $2,950 | $1.84 | 14d | 1 | 1.18mi |
| 516 E 12th St Unit 1314562P Cincinnati, OH | 4.0 | 2.0 | 2023 | $10,170 | $5.03 | 23d | 1 | 1.23mi |
| 1304 Broadway Unit 1056130P Cincinnati, OH | 1.0–5.0 | 1.0–4.0 | 2072 | $7,152 | $3.45 | 10d | 2 | 1.34mi |
| 1354 Broadway Unit 1056136P Cincinnati, OH | 4.0 | 3.0 | 2529 | $7,307 | $2.89 | 2d | 1 | 1.44mi |
| 126 E 13th St Unit 1056025P Cincinnati, OH | 5.0 | 4.0 | 2960 | $5,339 | $1.80 | 2d | 1 | 1.45mi |
| 120 E 13th St Unit 1056091P Cincinnati, OH | 4.0 | 2.0 | 3229 | $10,667 | $3.30 | 21d | 1 | 1.47mi |
Listing history 5 events
-
2026-06-17status $449,900 Pending 4 DOM
-
2026-06-16days on market $449,900 Active 4 DOM
-
2026-06-15days on market $449,900 Active 3 DOM
-
2026-06-13remarks 699-char remark
-
2026-06-13$449,900 Active 1 DOM
ⓘ Source: listings_history table (triggers on properties + properties_extension) + one-shot
backfill from property_details.listing_events for pre-trigger history.
Tax reassessment forecast KY · Resets to sale price
- Current annual tax
- $976 · $81/mo
- Projected year-2 tax
- $3,869 · $322/mo
- Expected delta
- +$2,893/yr (+$241/mo · 296.3%)
ⓘ Screening estimate from a state-policy table — verify with the county assessor before closing.
Climate risk First Street
- Flood 1/10 Low FEMA zone X (unshaded) · 0% chance over 30 yrs
- Wildfire 1/10 Low
- Heat 5/10 Major 7 d/yr ≥103°F today · 19 d/yr by 30 yrs out
- Wind 2/10 Low 100% chance of damaging wind over 30 yrs
- Air quality 3/10 Moderate 2 unhealthy d/yr today · 3 by 30 yrs out
Nearby sold comps map
Loading sold comps map…
Walkable amenities ~0.75 mi
Loading nearby amenities…
Taxation est. · year 1
- Rental income
- $50,991
- − Mortgage interest
- −$25,201
- − Property taxes
- −$976
- − Insurance
- −$2,250
- − Repairs & maintenance
- −$4,079
- − Management
- −$4,079
- − Depreciation
- −$13,088
- Taxable income
- $1,318
- Est. tax owed @ 24.0%
- −$316
- After-tax cash flow
- $8,429/yr
For passive investors: Depreciation is non-cash, so a rental often shows a tax loss while cash-flowing — sheltering income. Rental losses are passive: they offset passive income freely, and up to $25,000/yr can offset ordinary (W-2) income if you actively participate and your MAGI is under $100k (phasing out to $0 by $150k); unused losses carry forward. On sale, claimed depreciation is recaptured at up to 25%, and gains may owe capital-gains tax (a 1031 exchange can defer both). Figures are a year-1 estimate at your 24.0% rate — not tax advice; consult a CPA.
Schools (NCES district)
- District
- Newport Independent
- NCES district ID
- 2104440
- Math proficiency
- 14% ▼ -11.00%
- Reading proficiency
- 26% ▼ -6.00%
- Median HH income
- $35,783
- Composite
- 16.51/100
- National rank
- #9182
- State rank
- #160 of 165 in KY
Livability — Newport
- Score
- 82/100
- State rank
- #58
- US rank
- #1070
Category grades
Schools grade is shown separately in the Schools card above.
Census & demographics
- Census place
- Newport, KY
- County
- Campbell County · 84,793 people
- City population
- 19,680
- Metro
- Cincinnati, OH-KY-IN
- Population (ZIP)
- 19,680
- Household income
- $59,976
- Rent vs Own
- Severe rent burden
- 1136.0
Population outlook (Campbell County) Hauer SSP2
- Today (2025)
- 95,668 people
- By 2030
- 96,886 · +1.3%
- By 2040
- 97,734 · +2.2%
- By 2050
- 96,413 · +0.8%
- By 2075
- 90,211 · -5.7%
- By 2100
- 79,434 · -17.0%
Race, ethnicity, and origin ACS 2023
- Neighborhood character
- Predominantly White (84%)
- Race & ethnicity
- White 84% Black 7% Two or more races 6% Hispanic / Latino 5%
- Common ancestry
- Slovak 3% Lithuanian 2% Italian 2%
- Foreign-born
- 4% · Canada
- Languages at home
- 95% English-only · Spanish 3% Other Indo-European 1%
Political lean MEDSL · Campbell
- 2024 margin
- R (+19.7) · D 39.2% · R 58.9% · Other 1.9%
- 2008→2024 swing
- +1.2pp toward D · 2008: -20.9pp · 2024: -19.7pp
- All cycles
- 2024: R+19.7 2020: R+18.6 2016: R+24.5 2012: R+22.8 2008: R+20.9
Not yet ingested
- Civics
- —
Market trends
- HPI YoY
- ▼ -193.38%
- Current HPI
- 244.9069
- Rent YoY
- ▲ 4.64%
- Metro
- Cincinnati, OH-KY-IN
- State GDP YoY
- ▲ 1.81%
- F500 in state
- 4
Industry mix (Fortune 500 HQ in KY)
| Industry | F500 HQs | Revenue |
|---|---|---|
| Healthcare | 1 | $118B |
|
||
| Food / Beverage | 1 | $7B |
|
||
Price history
+542.7% since first listed4 events — show timeline
- 2026-06-12 Listed $449,900 NKMLS
- 2011-10-14 Sold (MLS) $110,000 NKMLS
- 2011-08-23 Listed $129,000 NKMLS
- 1994-11-18 Sold (Public Records) $70,000 Public Records
Property tax history
+5.7%/yrLatest (2025): $976 · -4.8% YoY. Source: county tax records.
Cash-flow waterfall
monthlySold comps — $/sqft
last 12 mo · ≤1 miLoading sold comps…