 🏗️ New Construction
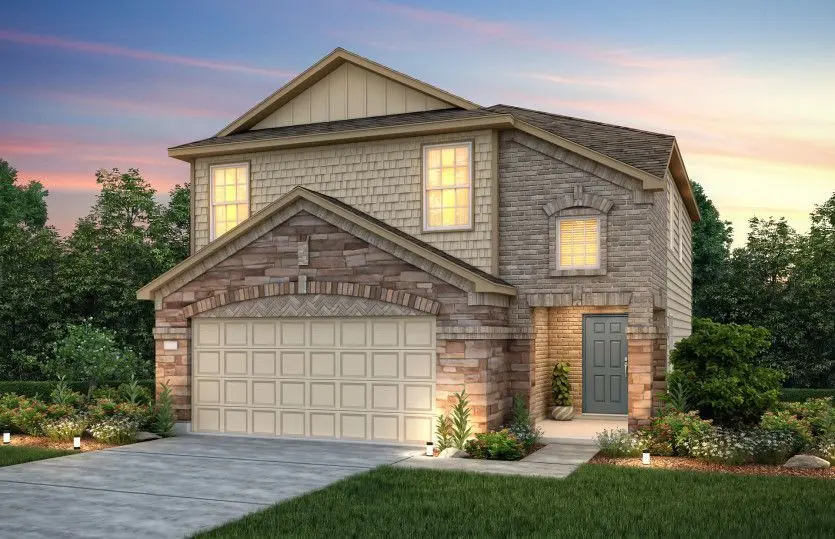
Springfield Plan · Conroe, TX
Flood risk No data
- FEMA flood zone
- —
- Chance of flooding over 30 yrs
- —
- Est. flood insurance / yr
- —
Fire risk No data
- Est. fire insurance / yr
- —
Heat risk No data
- Hot days now (above threshold)
- —
- Hot days in 30 yrs
- —
Wind risk No data
- Chance of severe wind over 30 yrs
- —
Air-quality risk No data
- Unhealthy air days now
- —
- Unhealthy air days in 30 yrs
- —
Risk factors via First Street. Map © Google.
Why this score? — see what drove the D+ grade
The composite is a weighted blend of 9 inputs, each scored 0–100. Each bar is that input's sub-score; the figure is the points it added to the 100-point composite (weight × sub-score).
- Cash flow +17.5/30.0
- ARV discount +7.5/15.0
- DSCR +5.5/10.0
- 1% rule +4.7/10.0
- Condition / age +4.0/5.0
- Livability +3.7/5.0
- Schools +3.2/10.0
- Rent growth +2.7/5.0
- Appreciation +0.9/10.0
$228,990
🖨 Deal sheet 📄 Offer letter ✓ Due diligence
Listing remarks MLS
The Springfield is built for keeping growing families connected, with a contemporary oversized great room and a spacious gourmet kitchen with informal nook. An upstairs loft or roomy fourth bedroom adds flexibility for your family's needs. A first-floor covered patio option is great for outdoor entertaining.
Key facts
- 2 garage spots
- Listed 686 days
Tags
Neighborhood map
What this means for you Summary
Snapshot
- This is a 4-bed/2.5-bath single-family listed at $229k. Condition is rated good.
Deal economics
- At list price, monthly cash flow is $187 ($2k/yr) — positive.
- The deal already cash-flows at list — no discount required.
- Meets the 1% rule at list price ($2k rent vs $229k).
- Recommended offer: $202k (12.0% below list) — sets the bar for market timing.
- Cap rate 7.2% vs local median 3.1% in Conroe — top-decile yield for the area; either an underpriced asset or a hidden risk that comps aren't pricing in. Stress-test before assuming the spread holds.
Location & tenants
- Location reads 74/100 on livability (#169 in TX, #4,447 nationally) — a middle-class / working-renter tenant base. Strengths: cost of living A+, housing A+, amenities B; Watch: schools D+, commute F, health & safety F.
- Willis ISD (rural): math 33% / reading 40% proficiency, ranked #458 of 826 in TX (top 55%) — families likely to look elsewhere, expect single-tenant / working-renter base with shorter leases.
- Market conditions: Rents flat; 710 active listings in the ZIP; 2 comparable units currently listed for rent nearby; 13,259 units permitted in Montgomery County in 2024 (1,402 in 5+ unit buildings).
- This rent runs 40% of the median local income ($71k/yr) — at the standard rent-burdened threshold; future hikes will face affordability resistance.
Forward outlook
- Local home prices are declining (-3.0%/yr); year-one equity from $2k of loan paydown is wiped out by about $7k of value loss. Plan a longer hold.
- Montgomery County population projected at +65% by 2050 — long-run rental-demand tailwind backs the buy-and-hold thesis.
Negotiation context
- It's been on market 687 days — a 12% lower offer ($202k) is reasonable based on typical stale-listing flexibility.
Questions for the listing agent
- It's been on market 687 days. Have you received any prior offers? Is the seller open to a 12% concession, seller financing, or rate buy-down credit?
- Why hasn't it sold? Are there any deal-killer items the seller is aware of (foundation, flood, title, zoning, code violations)?
- Is there a deadline driving the sale (1031 exchange, divorce, estate, relocation)? That informs how much negotiation room exists.
- Schools are D-rated, which usually means shorter tenancies and higher turnover. Who's the typical renter profile here, and what's been the actual vacancy rate?
- The area grade is low — what's the realistic commute time and amenity access for the typical tenant pool here? Any planned neighborhood developments (good or bad) we should know about?
- What's the average days-on-market for RENTAL listings here right now (not sales)? A rising rental-DOM trend means longer vacancies and softer asking-rent achievability than the comps imply.
- What's the recent tenant-quality profile in this submarket — average credit score on applications, eviction rate, late-payment / NSF rate, and stable-employment percentage? A property-management company in the area should have these aggregated.
- How much new for-sale + rental construction is in the pipeline within 1–3 miles? Heavy new supply typically softens prices + rents 12–24 months out; constrained supply supports both.
Investment metrics
- 1% rule
- 0.97% ✗
- Cap rate
- 7.21%
- Cash-on-cash
- 3.27%
- DSCR
- 1.15
- GRM
- 8.6
CMA / ARV
- ARV (median comp)
- $245,223
- List price
- $228,990
- Delta
- -6.62%
- Verdict
- FAIR
- Comps
- 20 within 1.0 mi
Show comp detail 12 sales within ~0.75 mi
| Address | Dist | Beds/Ba | Sqft | Sold | Price | $/sf | Match |
|---|---|---|---|---|---|---|---|
| 410 Kinglet Dr | 0.06mi | 4/2.5 | 1,812 (-1%) | 3mo | $251,440 | $139 | 93 |
| 10723 Sora Dr | 0.07mi | 4/2.5 | 1,780 (-2%) | 4mo | $248,210 | $139 | 89 |
| 406 Kinglet Dr | 0.07mi | 4/2.5 | 1,619 (-11%) | 3mo | $239,290 | $148 | 75 |
| 10727 Sora Dr | 0.08mi | 4/3.0 | 2,025 (+11%) | 4mo | $260,700 | $129 | 72 |
| 500 Kinglet Dr | 0.04mi | 3/2.0 (-1) | 1,580 (-13%) | 2mo | $235,000 | $149 | 67 |
| 10730 Sora Dr | 0.09mi | 3/2.0 (-1) | 1,580 (-13%) | 3mo | $242,910 | $154 | 64 |
| 10778 Sora Dr | 0.18mi | 3/2.5 (-1) | 1,570 (-14%) | 1mo | $243,110 | $155 | 63 |
| 993 Oak Glen Dr | 0.51mi | 3/2.5 (-1) | 1,921 (+5%) | 1mo | $239,000 | $124 | 62 |
| 10702 Sora Dr | 0.05mi | 3/2.0 (-1) | 1,580 (-13%) | 9mo | $254,920 | $161 | 61 |
| 947 Oak Terrace Dr | 0.54mi | 4/2.0 | 1,718 (-6%) | 7mo | $195,000 | $114 | 57 |
| 301 Maple Bark Trl | 0.51mi | 4/3.0 | 2,081 (+14%) | 4mo | $249,900 | $120 | 48 |
| 261 Mountain Knolls Ln | 0.73mi | 4/2.0 | 1,990 (+9%) | 8mo | $314,990 | $158 | 42 |
Match score weights: distance 35% · size 25% · config 20% · recency 20%. Top-matched comps best support the ARV.
Projected returns pro-forma
-3.0% appreciation · 0.98% rent growth · sell at horizon
- IRR
- -13.4%
- Equity multiple
- 0.53×
- Total profit
- $-32,533
- Equity at exit
- $36,564
- IRR
- -8.0%
- Equity multiple
- 0.54×
- Total profit
- $-31,544
- Equity at exit
- $21,202
Cash invested: $68,662 (down + closing). Projections, not guarantees.
Landlord ↔ Tenant lean methodology
- Overall (STATE)
- 87 Strongly Landlord-Friendly
- State Texas
- 87 Strongly Landlord-Friendly · R+5
- County
- — inherits STATE
- City
- — inherits STATE
ZIP-level market 77378
- Home prices YoY
- -3.0%
- Rents YoY
- 1.0%
- Active inventory
- 710
- Price-to-rent
- 8.0×
Monthly cashflow live
- Estimated rent
- $2,382 medium interval (Pro) →
- Mortgage (P&I)
- −$1,286
- Tax est. 1.5%
- −$307 /mo · $3,678/yr
- Insurance
- −$102
- HOA
- −$0
- Vacancy / Maint / Mgmt
- −$500
- Net cashflow
- $187
Break-even live
UW: 25.0% down · 7.5% · 30yr · 1.5% tax · 5.0% vac · 8.0% maint · 8.0% mgmt
Financing live
Cash to close
- Down payment
- $61,306
- Closing costs
- $7,357
- Reserves months
- —
- Total cash needed
- —
Loan-product check · same deal, 3 products live
Conventional
25% down · 7.5% · 30yr
- Down + closing
- —
- Monthly P&I
- —
- Monthly cashflow
- —
- DSCR
- —
- Eligible?
- —
Personal DTI + credit; lowest rate.
DSCR
20% down · 8.5% · 30yr
- Down + closing
- —
- Monthly P&I
- —
- Monthly cashflow
- —
- DSCR
- —
- Eligible?
- —
No personal income docs; deal must DSCR.
Hard money
10% down · 12.0% · 12mo
- Down + closing
- —
- Monthly P&I
- —
- Monthly cashflow
- —
- DSCR
- —
- Eligible?
- —
Short-term bridge; refi at stabilization.
Rent comps 2 comps
| Address | Beds | Baths | Sqft | Rent | $/sqft | DOM | Units | Dist |
|---|---|---|---|---|---|---|---|---|
| 974 Oak Falls Dr Willis, TX | 4.0 | 2.5 | 2499 | $2,210 | $0.88 | 43d | 1 | 0.53mi |
| 314 Harbor Bend Ct Willis, TX | 3.0 | 2.0 | 1311 | $1,800 | $1.37 | 43d | 1 | 1.21mi |
Listing history 19 events
-
2026-06-18days on market $228,990 Active 687 DOM
-
2026-06-17days on market $228,990 Active 686 DOM
-
2026-06-16days on market $228,990 Active 685 DOM
-
2026-06-15days on market $228,990 Active 684 DOM
-
2026-06-13pricedays on market $228,990 Active 682 DOM
-
2026-06-09days on market $225,990 Active 678 DOM
-
2026-06-08days on market $225,990 Active 677 DOM
-
2026-06-07days on market $225,990 Active 676 DOM
-
2026-06-04days on market $225,990 Active 673 DOM
-
2026-06-03days on market $225,990 Active 672 DOM
-
2026-06-02days on market $225,990 Active 671 DOM
-
2026-06-01days on market $225,990 Active 670 DOM
-
2026-05-31days on market $225,990 Active 669 DOM
-
2026-03-27price $225,990 309-char remark
Show marketing remark (309 chars)
The Springfield is built for keeping growing families connected, with a contemporary oversized great room and a spacious gourmet kitchen with informal nook. An upstairs loft or roomy fourth bedroom adds flexibility for your family's needs. A first-floor covered patio option is great for outdoor entertaining.
-
2026-03-03price $222,990 309-char remark
Show marketing remark (309 chars)
The Springfield is built for keeping growing families connected, with a contemporary oversized great room and a spacious gourmet kitchen with informal nook. An upstairs loft or roomy fourth bedroom adds flexibility for your family's needs. A first-floor covered patio option is great for outdoor entertaining.
-
2026-01-29price $219,990 309-char remark
Show marketing remark (309 chars)
The Springfield is built for keeping growing families connected, with a contemporary oversized great room and a spacious gourmet kitchen with informal nook. An upstairs loft or roomy fourth bedroom adds flexibility for your family's needs. A first-floor covered patio option is great for outdoor entertaining.
-
2025-04-03price $247,990 309-char remark
Show marketing remark (309 chars)
The Springfield is built for keeping growing families connected, with a contemporary oversized great room and a spacious gourmet kitchen with informal nook. An upstairs loft or roomy fourth bedroom adds flexibility for your family's needs. A first-floor covered patio option is great for outdoor entertaining.
-
2024-09-18price $246,990 309-char remark
Show marketing remark (309 chars)
The Springfield is built for keeping growing families connected, with a contemporary oversized great room and a spacious gourmet kitchen with informal nook. An upstairs loft or roomy fourth bedroom adds flexibility for your family's needs. A first-floor covered patio option is great for outdoor entertaining.
-
2024-08-01$245,990 Active 309-char remark
Show marketing remark (309 chars)
The Springfield is built for keeping growing families connected, with a contemporary oversized great room and a spacious gourmet kitchen with informal nook. An upstairs loft or roomy fourth bedroom adds flexibility for your family's needs. A first-floor covered patio option is great for outdoor entertaining.
ⓘ Source: listings_history table (triggers on properties + properties_extension) + one-shot
backfill from property_details.listing_events for pre-trigger history.
Nearby sold comps map
Loading sold comps map…
Walkable amenities ~0.75 mi
Loading nearby amenities…
Taxation est. · year 1
- Rental income
- $28,583
- − Mortgage interest
- −$13,736
- − Property taxes
- −$3,678
- − Insurance
- −$1,226
- − Repairs & maintenance
- −$2,287
- − Management
- −$2,287
- − Depreciation
- −$7,134
- Taxable loss
- −$1,765
- Est. tax savings @ 24.0%
- +$424
- After-tax cash flow
- $2,668/yr
For passive investors: Depreciation is non-cash, so a rental often shows a tax loss while cash-flowing — sheltering income. Rental losses are passive: they offset passive income freely, and up to $25,000/yr can offset ordinary (W-2) income if you actively participate and your MAGI is under $100k (phasing out to $0 by $150k); unused losses carry forward. On sale, claimed depreciation is recaptured at up to 25%, and gains may owe capital-gains tax (a 1031 exchange can defer both). Figures are a year-1 estimate at your 24.0% rate — not tax advice; consult a CPA.
Condition & rehab AI · 6 photos
This single-family home in Conroe, TX is in good condition with a good condition score of 80. It has a good roof, exterior, flooring, and interior walls/paint. The home is ready for a fresh coat of paint and landscaping improvements to further enhance its curb appeal and value.
Value-add opportunities
- Both Painting exterior and interior walls — Fresh paint can enhance curb appeal and interior aesthetics
- Both Landscaping improvements — Enhanced landscaping can boost curb appeal and attract potential buyers
- Both Add smart home features — Modern technology can increase both resale and rental value
Renovation cost estimate screening
Value-add ROI direction
- Both Painting exterior and interior walls — Fresh paint can enhance curb appeal and interior aesthetics ↑
- Both Landscaping improvements — Enhanced landscaping can boost curb appeal and attract potential buyers ↑
- Both Add smart home features — Modern technology can increase both resale and rental value ↑
ⓘ Cost ranges are severity-bucket heuristics (US national rule-of-thumb). Get contractor quotes + a written scope before underwriting a rehab budget.
Schools (NCES district)
- District
- Willis ISD
- NCES district ID
- 4845900
- Math proficiency
- 33% ▼ -15.00%
- Reading proficiency
- 40% ▼ -2.00%
- Median HH income
- $57,828
- Composite
- 32.32/100
- National rank
- #5746
- State rank
- #458 of 826 in TX
Livability — Conroe
- Score
- 74/100
- State rank
- #169
- US rank
- #4447
Category grades
Schools grade is shown separately in the Schools card above.
Census & demographics
- Census place
- Conroe, TX
- County
- Montgomery County · 663,713 people
- City population
- 38,421
- Metro
- Houston-The Woodlands-Sugar Land, TX
- Population (ZIP)
- 17,629
- Household income
- $71,143
- Rent vs Own
- Severe rent burden
- 402.0
Population outlook (Montgomery County) Hauer SSP2
- Today (2025)
- 713,896 people
- By 2030
- 805,263 · +12.8%
- By 2040
- 992,708 · +39.1%
- By 2050
- 1,179,590 · +65.2%
- By 2075
- 1,628,084 · +128.1%
- By 2100
- 1,937,880 · +171.5%
Race, ethnicity, and origin ACS 2023
- Neighborhood character
- Diverse neighborhood (Simpson 0.55)
- Race & ethnicity
- White 58% Hispanic / Latino 32% Two or more races 14% Black 7% Native American 1%
- Hispanic origin (detail)
- Mexican 27%
- Common ancestry
- Romanian 2% Slovak 2% Serbian 1%
- Foreign-born
- 12% · Canada
- Languages at home
- 80% English-only · Spanish 19%
Political lean MEDSL · Montgomery
- 2024 margin
- Solid R (+45.5) · D 26.8% · R 72.3%
- 2008→2024 swing
- +7.2pp toward D · 2008: -52.7pp · 2024: -45.5pp
- All cycles
- 2024: R+45.5 2020: R+43.8 2016: R+51.4 2012: R+60.7 2008: R+52.7
Not yet ingested
- Civics
- —
Market trends
- HPI YoY
- ▼ -8.25%
- Current HPI
- 261.9673
- Rent YoY
- ▲ 0.98%
- Metro
- Houston-The Woodlands-Sugar Land, TX
- State GDP YoY
- ▲ 3.95%
- F500 in state
- 110
Industry mix (Fortune 500 HQ in TX)
| Industry | F500 HQs | Revenue |
|---|---|---|
| Energy | 16 | $1,198B |
|
||
| Technology | 5 | $198B |
|
||
| Engineering / Construction | 4 | $72B |
|
||
| Energy Services | 3 | $60B |
|
||
| Utilities | 3 | $41B |
|
||
| Healthcare | 2 | $330B |
|
||
Price history
-8.1% since first listed6 events — show timeline
- 2026-03-27 Price Changed $225,990 Zillow
- 2026-03-03 Price Changed $222,990 Zillow
- 2026-01-29 Price Changed $219,990 Zillow
- 2025-04-03 Price Changed $247,990 Zillow
- 2024-09-18 Price Changed $246,990 Zillow
- 2024-08-01 Listed $245,990 Zillow
Cash-flow waterfall
monthlySold comps — $/sqft
last 12 mo · ≤1 miLoading sold comps…