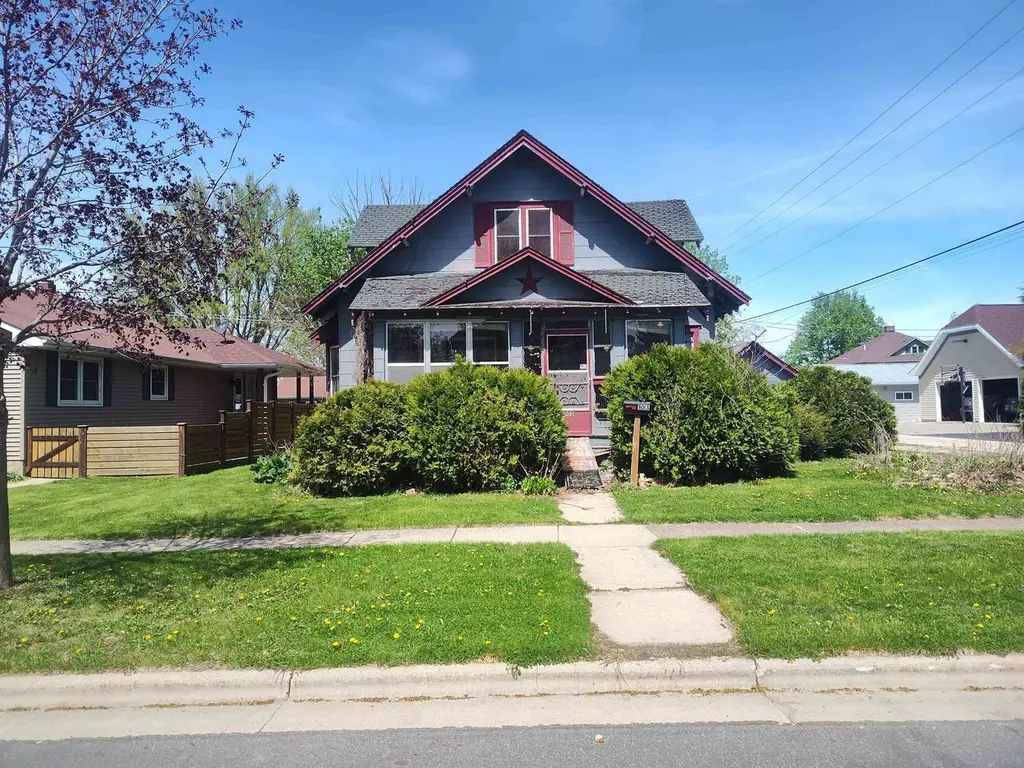
103 Mary St St · Boscobel, WI
Flood risk 6/10 · Moderate
- FEMA flood zone
- X (unshaded)
- Chance of flooding over 30 yrs
- 0.72%
- Est. flood insurance / yr
- $473 – $860
Fire risk 3/10 · Minor
- Est. fire insurance / yr
- $636 – $1,182
Heat risk 3/10 · Minor
- Hot days now (above 100°F)
- 7 days/yr
- Hot days in 30 yrs
- 16 days/yr
Wind risk 2/10 · Minimal
- Chance of severe wind over 30 yrs
- —
Air-quality risk 2/10 · Minimal
- Unhealthy air days now
- 0 days/yr
- Unhealthy air days in 30 yrs
- 1 days/yr
Risk factors via First Street. Map © Google.
Why this score? — see what drove the C+ grade
The composite is a weighted blend of 9 inputs, each scored 0–100. Each bar is that input's sub-score; the figure is the points it added to the 100-point composite (weight × sub-score).
- Cash flow +26.4/30.0
- DSCR +9.0/10.0
- 1% rule +8.6/10.0
- ARV discount +7.5/15.0
- Livability +3.7/5.0
- Rent growth +2.5/5.0
- Condition / age +2.5/5.0
- Schools +2.3/10.0
- Appreciation +0.0/10.0
$70,000
🖨 Deal sheet (PDF) 📄 Offer letter ✓ Due diligence
Listing remarks
Bring your vision to this 3 bedroom, 1.5 bath home situated on a generously sized lot. This property is in need of significant repairs and updates but offers a great opportunity for investors, flippers, or buyers looking to build sweat equity. The spacious lot provides plenty of room for outdoor living, expansion, or future improvements. Property is being sold as-is. Unlock the potential and make it your own.
Key facts
- Generously sized lot
- Outdoor living
- 7,405 sq ft lot
Tags
Property features AI
Finance
- Other: Includes refrigerator, stove, washer, dryer, dishwasher, and window A/C unit; Seller's personal property excluded
Exterior
- Parking: Detached 1-car garage
- Utilities: Municipal water; Municipal sewer; Natural gas
- Home design: 1.5-story single-family home; Estimated finished above-grade area approximately 1,538; Property is in a residential zone
- Construction: Year built: other / see remarks
- Exterior features: Deck; Sidewalks
Interior
- Kitchen: Range/oven; Refrigerator; Dishwasher
- Bedrooms: Master bedroom on the main level (10 x 19); Second bedroom on the upper level (9 x 12); Third bedroom on the upper level (9 x 11)
- Bathrooms: One full bathroom; One half bathroom; At least one tub; No master bathroom
- Heating & cooling: Forced air heating (natural gas); Window A/C unit
- Interior features: Full basement; Deck
- Laundry & utility: Washer; Dryer
Neighborhood map
What this means for you Summary
Snapshot
- This is a 3-bed/1.5-bath single-family listed at $70k.
Deal economics
- At list price, monthly cash flow is $184 ($2k/yr) — positive.
- The deal already cash-flows at list — no discount required.
- Meets the 1% rule at list price ($953 rent vs $70k).
- Recommended offer: $68k (3.0% below list) — sets the bar for market timing.
Location & tenants
- Location reads 73/100 on livability (#197 in WI) — a middle-class / working-renter tenant base. Strengths: cost of living A+, housing A+, health & safety A+; Watch: employment D+, amenities F, commute F.
- Boscobel Area School District (town): math 28% / reading 26% proficiency, ranked #301 of 342 in WI (top 88%) — low school quality limits family demand, transient renter base, plan for 1-2y turnover.
- Zoned schools: Boscobel Elementary (math 32% / reading 27%, grade F, #705 of 1,041 statewide, top 71%, 338 students, 60% FRL); Boscobel Junior High (math 27% / reading 27%, grade F, #299 of 383 statewide, top 80%, 152 students, 55% FRL); Boscobel High (math 24% / reading 24%, grade F, #287 of 483 statewide, top 71%, 213 students, 52% FRL).
- Market conditions: 35 active listings in the ZIP; 120 units permitted in Grant County in 2024 (0 in 5+ unit buildings).
Forward outlook
- Local home prices are declining (-3.0%/yr); year-one equity from $484 of loan paydown is wiped out by about $2k of value loss. Plan a longer hold.
- Grant County population projected at +10% by 2050 — modest demand growth; plan on rents tracking national, not racing it.
- At projected returns (-3.0% appreciation + 3.0% rent growth), your $20k cash investment doubles in ~10 years — after that, you're playing with house money.
Negotiation context
- It's been on market 57 days — a 3% lower offer ($68k) is reasonable based on typical stale-listing flexibility.
Risks & watch-outs
- Watch-outs: property tax is 3.0% of price.
- Climate carrying-cost: major flood risk — expect insurance premiums to compound above CPI over the hold.
Questions for the listing agent
- It's been on market 57 days. Have you received any prior offers? Is the seller open to a 3% concession, seller financing, or rate buy-down credit?
- Property tax is high relative to price — has the assessment been appealed recently, and will the sale trigger a re-assessment?
- Is there a deadline driving the sale (1031 exchange, divorce, estate, relocation)? That informs how much negotiation room exists.
- Schools are F-rated, which usually means shorter tenancies and higher turnover. Who's the typical renter profile here, and what's been the actual vacancy rate?
- What's the average days-on-market for RENTAL listings here right now (not sales)? A rising rental-DOM trend means longer vacancies and softer asking-rent achievability than the comps imply.
- What's the recent tenant-quality profile in this submarket — average credit score on applications, eviction rate, late-payment / NSF rate, and stable-employment percentage? A property-management company in the area should have these aggregated.
- How much new for-sale + rental construction is in the pipeline within 1–3 miles? Heavy new supply typically softens prices + rents 12–24 months out; constrained supply supports both.
Investment metrics
- 1% rule
- 1.36% ✓
- Cap rate
- 9.44%
- Cash-on-cash
- 11.25%
- DSCR
- 1.50
- GRM
- 6.1
CMA / ARV
- ARV (median comp)
- $146,600
- List price
- $70,000
- Delta
- -52.25%
- Verdict
- UNDERPRICED
- Comps
- 20 within 1.0 mi
Show comp detail 10 sales within ~0.75 mi
| Address | Dist | Beds/Ba | Sqft | Sold | Price | $/sf | Match |
|---|---|---|---|---|---|---|---|
| 101 Parker St | 0.06mi | 3/0.5 | 1,512 (-2%) | 2mo | $155,000 | $103 | 88 |
| 209 Adams St | 0.19mi | 3/2.0 | 1,650 (+7%) | 6mo | $182,500 | $111 | 72 |
| 1410 Wisconsin Ave | 0.11mi | 4/1.5 (+1) | 1,690 (+10%) | 5mo | $85,000 | $50 | 69 |
| 308 Pearl St | 0.20mi | 3/2.0 | 1,325 (-14%) | 9mo | $212,000 | $160 | 58 |
| 204 W Dubay St | 0.48mi | 3/2.0 | 1,542 (+0%) | 22mo | $225,000 | $146 | 57 |
| 114 Circle Dr | 0.39mi | 3/2.0 | 1,441 (-6%) | 21mo | $200,000 | $139 | 52 |
| 511 Superior St | 0.54mi | 4/2.0 (+1) | 1,400 (-9%) | 2mo | $250,000 | $179 | 51 |
| 104 W Kansas St | 0.41mi | 3/2.0 | 1,432 (-7%) | 22mo | $184,750 | $129 | 49 |
| 206 W North St | 0.60mi | 3/2.5 | 1,680 (+9%) | 6mo | $175,000 | $104 | 47 |
| 208 W Prairie Street St | 0.54mi | 3/1.0 | 1,366 (-11%) | 12mo | $185,000 | $135 | 44 |
Match score weights: distance 35% · size 25% · config 20% · recency 20%. Top-matched comps best support the ARV.
Projected returns pro-forma
-3.0% appreciation · 3.0% rent growth · sell at horizon
- IRR
- 0.6%
- Equity multiple
- 1.02×
- Total profit
- $425
- Equity at exit
- $10,437
- IRR
- 10.3%
- Equity multiple
- 1.80×
- Total profit
- $15,709
- Equity at exit
- $6,052
Cash invested: $19,600 (down + closing). Projections, not guarantees.
Landlord ↔ Tenant lean methodology
- Overall (STATE)
- 73 Landlord-Friendly
- State Wisconsin
- 73 Landlord-Friendly · R+2
- County
- — inherits STATE
- City
- — inherits STATE
ZIP-level market 53805
- Home prices YoY
- -13.7%
- Active inventory
- 35
- Price-to-rent
- 6.1×
Monthly cashflow live
- Estimated rent
- $953 medium interval (Pro) →
- Mortgage (P&I)
- −$367
- Tax from tax record
- −$173 /mo · $2,078/yr
- Insurance
- −$29
- HOA
- −$0
- Vacancy / Maint / Mgmt
- −$200
- Net cashflow
- $184
Break-even live
Sensitivity live
| Price | -10% $223 | -5% $204 | +0% $184 | +5% $164 | +10% $144 |
|---|---|---|---|---|---|
| Rent | -10% $108 | -5% $146 | +0% $184 | +5% $221 | +10% $259 |
| Rate | -1.0pp $219 | -0.5pp $202 | base $184 | +0.5pp $166 | +1.0pp $147 |
UW: 25.0% down · 7.5% · 30yr · 1.5% tax · 5.0% vac · 8.0% maint · 8.0% mgmt
Financing live
Cash to close
- Down payment
- $17,500
- Closing costs
- $2,100
- Reserves months
- —
- Total cash needed
- —
Loan-product check · same deal, 3 products live
Conventional
25% down · 7.5% · 30yr
- Down + closing
- —
- Monthly P&I
- —
- Monthly cashflow
- —
- DSCR
- —
- Eligible?
- —
Personal DTI + credit; lowest rate.
DSCR
20% down · 8.5% · 30yr
- Down + closing
- —
- Monthly P&I
- —
- Monthly cashflow
- —
- DSCR
- —
- Eligible?
- —
No personal income docs; deal must DSCR.
Hard money
10% down · 12.0% · 12mo
- Down + closing
- —
- Monthly P&I
- —
- Monthly cashflow
- —
- DSCR
- —
- Eligible?
- —
Short-term bridge; refi at stabilization.
Listing history 18 events
-
2026-06-21days on market $70,000 Active 57 DOM
-
2026-06-21days on market $70,000 Active 56 DOM
-
2026-06-18days on market $70,000 Active 54 DOM
-
2026-06-17days on market $70,000 Active 53 DOM
-
2026-06-16days on market $70,000 Active 52 DOM
-
2026-06-15days on market $70,000 Active 51 DOM
-
2026-06-15days on market $70,000 Active 50 DOM
-
2026-06-13days on market $70,000 Active 49 DOM
-
2026-06-12days on market $70,000 Active 48 DOM
-
2026-06-09days on market $70,000 Active 45 DOM
-
2026-06-08days on market $70,000 Active 44 DOM
-
2026-06-08days on market $70,000 Active 43 DOM
-
2026-06-05days on market $70,000 Active 41 DOM
-
2026-06-03days on market $70,000 Active 39 DOM
-
2026-06-02days on market $70,000 Active 38 DOM
-
2026-06-01days on market $70,000 Active 37 DOM
-
2026-05-31days on market $70,000 Active 36 DOM
-
2026-04-25$70,000 Active 412-char remark
ⓘ Source: listings_history table (triggers on properties + properties_extension) + one-shot
backfill from property_details.listing_events for pre-trigger history.
Tax reassessment forecast WI · Partial reset (capped growth)
- Current annual tax
- $2,078 · $173/mo
- Projected year-2 tax
- $2,078 · $173/mo
- Expected delta
- $0/yr ($0/mo · 0.0%)
ⓘ Screening estimate from a state-policy table — verify with the county assessor before closing.
Climate risk First Street
- Flood 6/10 Major FEMA zone X (unshaded) · 72% chance over 30 yrs
- Wildfire 3/10 Moderate
- Heat 3/10 Moderate 7 d/yr ≥100°F today · 16 d/yr by 30 yrs out
- Wind 2/10 Low
- Air quality 2/10 Low 0 unhealthy d/yr today · 1 by 30 yrs out
Nearby sold comps map
Loading sold comps map…
Walkable amenities ~0.75 mi
Loading nearby amenities…
Taxation est. · year 1
- Rental income
- $11,440
- − Mortgage interest
- −$3,921
- − Property taxes
- −$2,078
- − Insurance
- −$350
- − Repairs & maintenance
- −$915
- − Management
- −$915
- − Depreciation
- −$2,036
- Taxable income
- $1,224
- Est. tax owed @ 24.0%
- −$294
- After-tax cash flow
- $1,911/yr
For passive investors: Depreciation is non-cash, so a rental often shows a tax loss while cash-flowing — sheltering income. Rental losses are passive: they offset passive income freely, and up to $25,000/yr can offset ordinary (W-2) income if you actively participate and your MAGI is under $100k (phasing out to $0 by $150k); unused losses carry forward. On sale, claimed depreciation is recaptured at up to 25%, and gains may owe capital-gains tax (a 1031 exchange can defer both). Figures are a year-1 estimate at your 24.0% rate — not tax advice; consult a CPA.
Schools (NCES district)
- District
- Boscobel Area School District
- NCES district ID
- 5501500
- Math proficiency
- 28% ▼ -9.00%
- Reading proficiency
- 26% ▼ -6.00%
- Median HH income
- $43,366
- Composite
- 23.1/100
- National rank
- #7964
- State rank
- #301 of 342 in WI
Livability — Boscobel
- Score
- 73/100
- State rank
- #197
- US rank
- #5189
Category grades
Schools grade is shown separately in the Schools card above.
Census & demographics
- Census place
- Boscobel, WI
- City population
- 5,569
- Population (ZIP)
- 5,569
Population outlook (Grant County) Hauer SSP2
- Today (2025)
- 53,982 people
- By 2030
- 55,104 · +2.1%
- By 2040
- 57,353 · +6.2%
- By 2050
- 59,315 · +9.9%
- By 2075
- 65,496 · +21.3%
- By 2100
- 66,508 · +23.2%
Race, ethnicity, and origin ACS 2023
- Neighborhood character
- Predominantly White (91%)
- Race & ethnicity
- White 91% Black 5% Hispanic / Latino 2% Two or more races 1%
- Common ancestry
- Portuguese 8% Lithuanian 2% Iranian 2%
- Foreign-born
- 0% · Canada
- Languages at home
- 96% English-only · German/W. Germanic 2% Spanish 1%
Political lean MEDSL · Grant
- 2024 margin
- R (+18.2) · D 40.2% · R 58.4% · Other 1.3%
- 2008→2024 swing
- -42.0pp toward R · 2008: 23.9pp · 2024: -18.2pp
- All cycles
- 2024: R+18.2 2020: R+12.3 2016: R+9.6 2012: D+13.7 2008: D+23.9
Not yet ingested
- Civics
- —
Market trends
- HPI YoY
- ▼ -33.55%
- Current HPI
- 212.1709
- Rent YoY
- —
- Metro
- —
- State GDP YoY
- ▲ 2.10%
- F500 in state
- 20
Industry mix (Fortune 500 HQ in WI)
| Industry | F500 HQs | Revenue |
|---|---|---|
| Industrial Machinery | 4 | $23B |
|
||
| Industrial Technology | 2 | $36B |
|
||
| Insurance | 1 | $36B |
|
||
| Professional Services | 1 | $19B |
|
||
| Utilities | 1 | $9B |
|
||
| Consumer Goods | 1 | $3B |
|
||
Price history
1 event — show timeline
- 2026-04-25 Listed $70,000 SCWMLS
Property tax history
+4.4%/yrLatest (2025): $2,078 · -2.8% YoY. Source: county tax records.
Cash-flow waterfall
monthlySold comps — $/sqft
last 12 mo · ≤1 miLoading sold comps…