 Multi-family
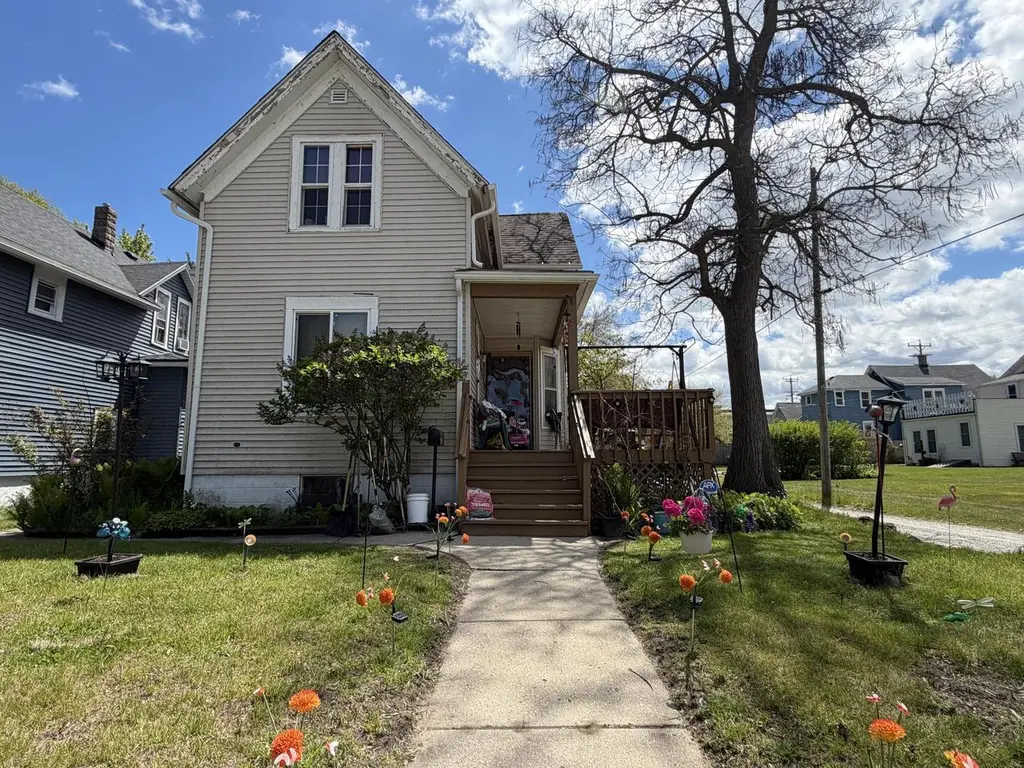
1315 67th Pl · Kenosha, WI
Flood risk 6/10 · Moderate
- FEMA flood zone
- X (unshaded)
- Chance of flooding over 30 yrs
- 0.75%
- Est. flood insurance / yr
- $473 – $860
Fire risk 1/10 · Minimal
- Est. fire insurance / yr
- $636 – $1,182
Heat risk 2/10 · Minimal
- Hot days now (above 96°F)
- 7 days/yr
- Hot days in 30 yrs
- 14 days/yr
Wind risk 2/10 · Minimal
- Chance of severe wind over 30 yrs
- —
Air-quality risk 3/10 · Minor
- Unhealthy air days now
- 2 days/yr
- Unhealthy air days in 30 yrs
- 3 days/yr
Risk factors via First Street. Map © Google.
Why this score? — see what drove the B+ grade
The composite is a weighted blend of 9 inputs, each scored 0–100. Each bar is that input's sub-score; the figure is the points it added to the 100-point composite (weight × sub-score).
- Cash flow +30.0/30.0
- ARV discount +15.0/15.0
- 1% rule +10.0/10.0
- DSCR +10.0/10.0
- Livability +4.2/5.0
- Rent growth +2.5/5.0
- Schools +2.5/10.0
- Condition / age +2.5/5.0
- Appreciation +0.0/10.0
$119,900
🖨 Deal sheet (PDF) 📄 Offer letter ✓ Due diligence
Multi-family units
County records classify this as Multi-Family (2-4 Unit). Listing-text estimate: 1 unit. estimate disagrees with records
Listing remarks MLS
4 bedroom, 2 bathroom home located on dead end and off alley. This property was previously used as a duplex and offers strong potential for the right buyer or investor. The home does need work, but the layout provides flexibility and value-add opportunity. Conveniently located less than 5 minutes from Downtown Kenosha, local parks, shopping, restaurants, and Lake Michigan. Great opportunity to bring this property back to life.
Key facts
- 5,227 sq ft lot
- Parking
- Built 1907
Property features AI
Finance
- Financial info: Total taxes listed (see listing for amount and year)
Exterior
- Parking: 1 parking space
- Utilities: Municipal water; Municipal sewer
- Home design: Single-family home; 2-story building
- Construction: Information source lists year built from assessor/public record
- Exterior features: Vinyl exterior; Lot size approximately 0.12 acres; Acreage less than 1/2 acre; Zoning: M1
Interior
- Kitchen: Kitchen on upper level (11 x 11)
- Bedrooms: Master bedroom on upper level (11 x 13); Second bedroom on upper level (11 x 11)
- Bathrooms: Two full bathrooms; Shower over tub
- Heating & cooling: Forced air heating; Natural gas heat
- Interior features: Full basement; Living room on upper level (13 x 15)
Neighborhood map
What this means for you Summary
Snapshot
- This is a 4-bed/1.0-bath multifamily listed at $120k.
Deal economics
- At list price, monthly cash flow is $733 ($9k/yr) — positive.
- The deal already cash-flows at list — no discount required.
- Meets the 1% rule at list price ($2k rent vs $120k).
- Cap rate 13.6% vs local median 3.8% in Kenosha — top-decile yield for the area; either an underpriced asset or a hidden risk that comps aren't pricing in. Stress-test before assuming the spread holds.
Location & tenants
- Location reads 84/100 on livability (#31 in WI, #680 nationally) — a professional / high-income tenant draw. Strengths: commute A+, cost of living A+, housing A+; Watch: employment C-.
- Kenosha School District (suburban): math 26% / reading 31% proficiency, ranked #287 of 342 in WI (top 84%) — low school quality limits family demand, transient renter base, plan for 1-2y turnover.
- Zoned schools: Brass Community School (math 2% / reading 2%, grade F, #1,024 of 1,041 statewide, top 100%, 328 students, 94% FRL); Lincoln Middle (math 8% / reading 13%, grade F, #370 of 383 statewide, top 97%, 449 students, 82% FRL); Tremper High (math 13% / reading 25%, grade F, #395 of 483 statewide, top 82%, 1,540 students, 45% FRL) — zoned schools average 74% FRL vs 45% district-wide (29 pts higher); higher-poverty schools than district average — tighter screening recommended.
- Zoned-school proficiency averages 11% at this address vs 28% district-wide (-18 pts) — the specific schools serving this property underperform the Kenosha School District average; the district grade overstates school quality for this exact location.
- Market conditions: 34 active listings in the ZIP; 6 comparable units currently listed for rent nearby; rentals at typical pace (median 20d on market — plan ~3-4 weeks tenant-placement turnaround); 259 units permitted in Kenosha County in 2024 (8 in 5+ unit buildings).
- This rent runs 35% of the median local income ($68k/yr) — at the standard rent-burdened threshold; future hikes will face affordability resistance.
Forward outlook
- Local home prices are declining (-3.0%/yr); year-one equity from $829 of loan paydown is wiped out by about $4k of value loss. Plan a longer hold.
- At projected returns (-3.0% appreciation + 3.0% rent growth), your $34k cash investment doubles in ~5 years — after that, you're playing with house money.
Negotiation context
- Only 1 days on market — expect competitive offers; lowballing is unlikely to land.
- 2 sale attempts with the ask held roughly flat each time — persistent listings suggest the price (not the market) is what's stuck; bring a comps-based counter.
- Current owner paid $62k; list at $120k implies a 93% gain — meaningful room to come down on a strong offer.
Risks & watch-outs
- Watch-outs: built in 1907 — expect roof / HVAC / electrical / plumbing capex.
- Climate carrying-cost: major flood risk — expect insurance premiums to compound above CPI over the hold.
Questions for the listing agent
- Built in 1907 — when were the roof, HVAC, electrical panel, plumbing, and water heater last replaced?
- Is there a deadline driving the sale (1031 exchange, divorce, estate, relocation)? That informs how much negotiation room exists.
- Schools are D-rated, which usually means shorter tenancies and higher turnover. Who's the typical renter profile here, and what's been the actual vacancy rate?
- What's the average days-on-market for RENTAL listings here right now (not sales)? A rising rental-DOM trend means longer vacancies and softer asking-rent achievability than the comps imply.
- What's the recent tenant-quality profile in this submarket — average credit score on applications, eviction rate, late-payment / NSF rate, and stable-employment percentage? A property-management company in the area should have these aggregated.
- How much new apartment / multifamily construction is in the pipeline within 1–3 miles? Heavy new supply (>2% of stock underway) typically softens rents 12–24 months out; light construction supports rent growth.
Investment metrics
- 1% rule
- 1.68% ✓
- Cap rate
- 13.63%
- Cash-on-cash
- 26.19%
- DSCR
- 2.17
- GRM
- 5.0
CMA / ARV
- ARV (on-the-fly)
- $215,327
- Comps found
- 12
Show comp detail 12 sales within ~0.75 mi
| Address | Dist | Beds/Ba | Sqft | Sold | Price | $/sf | Match |
|---|---|---|---|---|---|---|---|
| 7005 13th Ave #7007 | 0.19mi | 3/2.0 (-1) | 1,583 (-2%) | 13mo | $225,000 | $142 | 68 |
| 904 72nd St | 0.33mi | 3/2.0 (-1) | 1,612 (-0%) | 13mo | $229,900 | $143 | 64 |
| 6914 22nd Ave | 0.51mi | 3/2.0 (-1) | 1,603 (-1%) | 4mo | $171,777 | $107 | 62 |
| 6545 5th Ave | 0.51mi | 3/2.0 (-1) | 1,679 (+4%) | 1mo | $260,000 | $155 | 60 |
| 2218 66th St | 0.55mi | 4/2.0 | 1,630 (+1%) | 15mo | $186,000 | $114 | 57 |
| 6826 22nd Ave | 0.50mi | 4/2.0 | 1,760 (+9%) | 2mo | $270,000 | $153 | 56 |
| 1610 76th St | 0.56mi | 4/2.0 | 1,532 (-5%) | 9mo | $250,000 | $163 | 54 |
| 6603 23rd Ave | 0.55mi | 4/2.0 | 1,729 (+7%) | 7mo | $220,000 | $127 | 53 |
| 6827 25th Ave | 0.66mi | 4/2.0 | 1,764 (+9%) | 9mo | $226,500 | $128 | 43 |
| 6628 25th Ave | 0.69mi | 3/2.0 (-1) | 1,713 (+6%) | 13mo | $227,000 | $133 | 38 |
| 1205 58th St | 0.69mi | 4/2.0 | 1,856 (+15%) | 3mo | $212,000 | $114 | 37 |
| 5904 18th Ave | 0.69mi | 4/2.0 | 1,771 (+9%) | 13mo | $203,000 | $115 | 37 |
Match score weights: distance 35% · size 25% · config 20% · recency 20%. Top-matched comps best support the ARV.
Projected returns pro-forma
-3.0% appreciation · 3.0% rent growth · sell at horizon
- IRR
- 20.0%
- Equity multiple
- 1.81×
- Total profit
- $27,286
- Equity at exit
- $17,877
- IRR
- 28.2%
- Equity multiple
- 3.50×
- Total profit
- $84,051
- Equity at exit
- $10,367
Cash invested: $33,572 (down + closing). Projections, not guarantees.
Landlord ↔ Tenant lean methodology
- Overall (STATE)
- 73 Landlord-Friendly
- State Wisconsin
- 73 Landlord-Friendly · R+2
- County
- — inherits STATE
- City
- — inherits STATE
ZIP-level market 53143
- Active inventory
- 34
- Price-to-rent
- 5.0×
Monthly cashflow live
- Estimated rent
- $2,016 high interval (Pro) →
- Mortgage (P&I)
- −$629
- Tax from tax record
- −$181 /mo · $2,178/yr
- Insurance
- −$50
- HOA
- −$0
- Vacancy / Maint / Mgmt
- −$423
- Net cashflow
- $733
Break-even live
Sensitivity live
| Price | -10% $801 | -5% $767 | +0% $733 | +5% $699 | +10% $665 |
|---|---|---|---|---|---|
| Rent | -10% $573 | -5% $653 | +0% $733 | +5% $812 | +10% $892 |
| Rate | -1.0pp $793 | -0.5pp $763 | base $733 | +0.5pp $702 | +1.0pp $670 |
UW: 25.0% down · 7.5% · 30yr · 1.5% tax · 5.0% vac · 8.0% maint · 8.0% mgmt
Financing live
Cash to close
- Down payment
- $29,975
- Closing costs
- $3,597
- Reserves months
- —
- Total cash needed
- —
Loan-product check · same deal, 3 products live
Conventional
25% down · 7.5% · 30yr
- Down + closing
- —
- Monthly P&I
- —
- Monthly cashflow
- —
- DSCR
- —
- Eligible?
- —
Personal DTI + credit; lowest rate.
DSCR
20% down · 8.5% · 30yr
- Down + closing
- —
- Monthly P&I
- —
- Monthly cashflow
- —
- DSCR
- —
- Eligible?
- —
No personal income docs; deal must DSCR.
Hard money
10% down · 12.0% · 12mo
- Down + closing
- —
- Monthly P&I
- —
- Monthly cashflow
- —
- DSCR
- —
- Eligible?
- —
Short-term bridge; refi at stabilization.
Rent comps 6 comps
| Address | Beds | Baths | Sqft | Rent | $/sqft | DOM | Units | Dist |
|---|---|---|---|---|---|---|---|---|
| 7719 15th Ave Kenosha, WI | 4.0 | 2.0 | 1898 | $2,599 | $1.37 | 20d | 1 | 0.64mi |
| 1809 60th St Kenosha, WI | 3.0 | 1.0 | 1100 | $1,500 | $1.36 | 45d | 1 | 0.65mi |
| 1819 58th St Kenosha, WI | 3.0 | 1.5 | 1065 | $1,795 | $1.69 | 0d | 1 | 0.74mi |
| 5807 20th Ave Unit 2 Kenosha, WI | 3.0 | 1.0 | 1064 | $2,400 | $2.26 | 20d | 1 | 0.77mi |
| 1510 57th St Unit 2 Kenosha, WI | 4.0 | 2.0 | 1700 | $1,800 | $1.06 | 45d | 1 | 0.77mi |
| 5432 23rd Ave Kenosha, WI | 4.0 | 2.0 | 1400 | $1,695 | $1.21 | 5d | 1 | 1.07mi |
Listing history 5 events
-
2026-05-15status Pending 430-char remark
Show marketing remark (430 chars)
4 bedroom, 2 bathroom home located on dead end and off alley. This property was previously used as a duplex and offers strong potential for the right buyer or investor. The home does need work, but the layout provides flexibility and value-add opportunity. Conveniently located less than 5 minutes from Downtown Kenosha, local parks, shopping, restaurants, and Lake Michigan. Great opportunity to bring this property back to life.
-
2026-05-15status Pending
Show marketing remark (430 chars)
4 bedroom, 2 bathroom home located on dead end and off alley. This property was previously used as a duplex and offers strong potential for the right buyer or investor. The home does need work, but the layout provides flexibility and value-add opportunity. Conveniently located less than 5 minutes from Downtown Kenosha, local parks, shopping, restaurants, and Lake Michigan. Great opportunity to bring this property back to life.
-
2026-05-14$119,900 Active 430-char remark
Show marketing remark (430 chars)
4 bedroom, 2 bathroom home located on dead end and off alley. This property was previously used as a duplex and offers strong potential for the right buyer or investor. The home does need work, but the layout provides flexibility and value-add opportunity. Conveniently located less than 5 minutes from Downtown Kenosha, local parks, shopping, restaurants, and Lake Michigan. Great opportunity to bring this property back to life.
-
2026-05-14$119,900 Active
Show marketing remark (430 chars)
4 bedroom, 2 bathroom home located on dead end and off alley. This property was previously used as a duplex and offers strong potential for the right buyer or investor. The home does need work, but the layout provides flexibility and value-add opportunity. Conveniently located less than 5 minutes from Downtown Kenosha, local parks, shopping, restaurants, and Lake Michigan. Great opportunity to bring this property back to life.
-
1998-08-01soldstatus $62,000
ⓘ Source: listings_history table (triggers on properties + properties_extension) + one-shot
backfill from property_details.listing_events for pre-trigger history.
Tax reassessment forecast WI · Partial reset (capped growth)
- Current annual tax
- $2,178 · $181/mo
- Projected year-2 tax
- $2,198 · $183/mo
- Expected delta
- +$20/yr (+$2/mo · 0.9%)
ⓘ Screening estimate from a state-policy table — verify with the county assessor before closing.
Climate risk First Street
- Flood 6/10 Major FEMA zone X (unshaded) · 75% chance over 30 yrs
- Wildfire 1/10 Low
- Heat 2/10 Low 7 d/yr ≥96°F today · 14 d/yr by 30 yrs out
- Wind 2/10 Low
- Air quality 3/10 Moderate 2 unhealthy d/yr today · 3 by 30 yrs out
Nearby sold comps map
Loading sold comps map…
Walkable amenities ~0.75 mi
Loading nearby amenities…
Taxation est. · year 1
- Rental income
- $24,196
- − Mortgage interest
- −$6,716
- − Property taxes
- −$2,178
- − Insurance
- −$600
- − Repairs & maintenance
- −$1,936
- − Management
- −$1,936
- − Depreciation
- −$3,488
- Taxable income
- $7,343
- Est. tax owed @ 24.0%
- −$1,762
- After-tax cash flow
- $7,030/yr
For passive investors: Depreciation is non-cash, so a rental often shows a tax loss while cash-flowing — sheltering income. Rental losses are passive: they offset passive income freely, and up to $25,000/yr can offset ordinary (W-2) income if you actively participate and your MAGI is under $100k (phasing out to $0 by $150k); unused losses carry forward. On sale, claimed depreciation is recaptured at up to 25%, and gains may owe capital-gains tax (a 1031 exchange can defer both). Figures are a year-1 estimate at your 24.0% rate — not tax advice; consult a CPA.
Schools (NCES district)
- District
- Kenosha School District
- NCES district ID
- 5507320
- Math proficiency
- 26% ▼ -9.00%
- Reading proficiency
- 31% ▼ -6.00%
- Median HH income
- $52,407
- Composite
- 25.17/100
- National rank
- #7516
- State rank
- #287 of 342 in WI
Livability — Kenosha
- Score
- 84/100
- State rank
- #31
- US rank
- #680
Category grades
Schools grade is shown separately in the Schools card above.
Census & demographics
- Census place
- Kenosha, WI
- County
- Kenosha County · 130,343 people
- City population
- 85,271
- Metro
- Chicago-Naperville-Elgin, IL-IN-WI
- Population (ZIP)
- 20,889
- Household income
- $68,343
- Rent vs Own
- Severe rent burden
- 813.0
Population outlook (Kenosha County) Hauer SSP2
- Today (2025)
- 174,032 people
- By 2030
- 174,923 · +0.5%
- By 2040
- 173,895 · -0.1%
- By 2050
- 170,102 · -2.3%
- By 2075
- 162,952 · -6.4%
- By 2100
- 154,781 · -11.1%
Race, ethnicity, and origin ACS 2023
- Neighborhood character
- Diverse neighborhood (Simpson 0.59)
- Race & ethnicity
- White 59% Hispanic / Latino 21% Two or more races 18% Black 11% Asian 1%
- Hispanic origin (detail)
- Mexican 16% Puerto Rican 2%
- Common ancestry
- Romanian 6% Portuguese 5% Lithuanian 2%
- Foreign-born
- 6% · Canada, China
- Languages at home
- 89% English-only · Spanish 10% Chinese 1%
Political lean MEDSL · Kenosha
- 2024 margin
- Lean R (+6.2) · D 46.2% · R 52.5% · Other 1.3%
- 2008→2024 swing
- -24.3pp toward R · 2008: 18.1pp · 2024: -6.2pp
- All cycles
- 2024: R+6.2 2020: R+3.1 2016: R+0.3 2012: D+12.3 2008: D+18.1
Not yet ingested
- Civics
- —
Market trends
- HPI YoY
- ▼ -220.75%
- Current HPI
- 229.2067
- Rent YoY
- —
- Metro
- Chicago-Naperville-Elgin, IL-IN-WI
- State GDP YoY
- ▲ 2.10%
- F500 in state
- 20
Industry mix (Fortune 500 HQ in WI)
| Industry | F500 HQs | Revenue |
|---|---|---|
| Industrial Machinery | 4 | $23B |
|
||
| Industrial Technology | 2 | $36B |
|
||
| Insurance | 1 | $36B |
|
||
| Professional Services | 1 | $19B |
|
||
| Utilities | 1 | $9B |
|
||
| Consumer Goods | 1 | $3B |
|
||
Price history
+93.4% since first listed5 events — show timeline
- 2026-05-15 Pending — METROMLS
- 2026-05-15 Pending — METROMLS
- 2026-05-14 Listed $119,900 METROMLS
- 2026-05-14 Listed $119,900 METROMLS
- 1998-08-01 Sold (Public Records) $62,000 Public Records
Property tax history
+2.5%/yrLatest (2025): $2,178 · +6.1% YoY. Source: county tax records.
Cash-flow waterfall
monthlySold comps — $/sqft
last 12 mo · ≤1 miLoading sold comps…