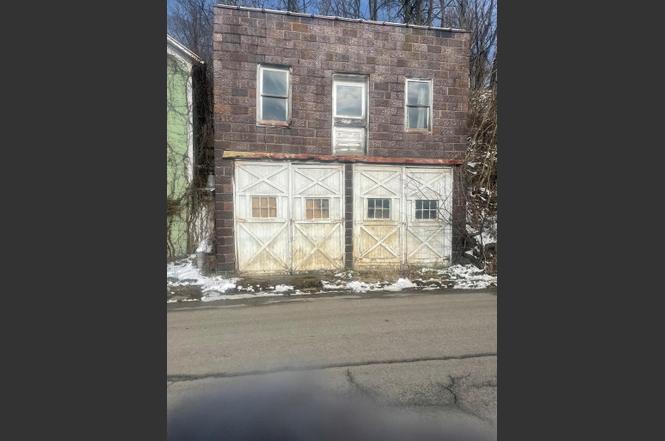
112 Pennsylvania Ave · Cameron, WV
Flood risk 9/10 · Severe
- FEMA flood zone
- X (unshaded)
- Chance of flooding over 30 yrs
- 0.99%
- Est. flood insurance / yr
- $507 – $1,088
Fire risk 1/10 · Minimal
- Est. fire insurance / yr
- $787 – $1,461
Heat risk 3/10 · Minor
- Hot days now (above 96°F)
- 7 days/yr
- Hot days in 30 yrs
- 20 days/yr
Wind risk 1/10 · Minimal
- Chance of severe wind over 30 yrs
- —
Air-quality risk 2/10 · Minimal
- Unhealthy air days now
- 0 days/yr
- Unhealthy air days in 30 yrs
- 1 days/yr
Risk factors via First Street. Map © Google.
Why this score? — see what drove the D+ grade
The composite is a weighted blend of 9 inputs, each scored 0–100. Each bar is that input's sub-score; the figure is the points it added to the 100-point composite (weight × sub-score).
- Cash flow +15.0/30.0
- ARV discount +7.5/15.0
- Appreciation +6.3/10.0
- 1% rule +5.0/10.0
- DSCR +5.0/10.0
- Livability +3.0/5.0
- Schools +2.7/10.0
- Rent growth +2.5/5.0
- Condition / age +2.5/5.0
$20,000
🖨 Deal sheet (PDF) 📄 Offer letter ✓ Due diligence
Listing remarks
House bis being sold AS IS. 24 hour notice for showings required Thank you combo lock
Key facts
- 8,712 sq ft lot
- 2 garage spots
- Built 1906
Property features AI
Exterior
- Parking: Detached 2-car garage
- Home design: Single-family residence (Traditional); 2 stories
- Exterior features: Porch; Shingle roof; Residential zoning
Interior
- Kitchen: Range; Refrigerator
- Bathrooms: 1 full bathroom; 1 half bathroom
- Heating & cooling: Natural gas heating
- Interior features: Range; Refrigerator; Gas water heater; Porch
- Laundry & utility: Gas water heater
Neighborhood map
What this means for you Summary
Snapshot
- This is a 4-bed/1.5-bath single-family listed at $20k.
Deal economics
- At list price, monthly cash flow is $916 ($11k/yr) — positive.
- The deal already cash-flows at list — no discount required.
- Meets the 1% rule at list price ($1k rent vs $20k).
- Recommended offer: $18k (12.0% below list) — sets the bar for market timing.
Location & tenants
- Location reads 59/100 on livability (#231 in WV) — a working-class tenant base; expect higher turnover. Strengths: cost of living A+, housing B; Watch: amenities F, commute F, employment F.
- Marshall County Schools (suburban): math 28% / reading 36% proficiency, ranked #21 of 55 in WV (top 38%) — families likely to look elsewhere, expect single-tenant / working-renter base with shorter leases.
- Zoned schools: Cameron Elementary School (math 27% / reading 32%, grade F, #225 of 377 statewide, top 68%, 232 students, 0% FRL); Cameron High School (math 17% / reading 27%, grade F, #97 of 110 statewide, top 90%, 312 students, 0% FRL) — zoned schools average 0% FRL vs 42% district-wide (42 pts lower); this property's tenant base skews higher-income than the district average.
- Market conditions: 10 active listings in the ZIP; 6 units permitted in Marshall County in 2024 (0 in 5+ unit buildings).
Forward outlook
- In year one you build about $671 of equity ($138 loan paydown + $533 appreciation (2.7% local appreciation)).
- Marshall County population projected at -19% by 2050 — secular population decline; favor cash flow + early exit over multi-decade hold.
- At projected returns (2.7% appreciation + 3.0% rent growth), your $6k cash investment doubles in ~1 year — after that, you're playing with house money.
Negotiation context
- It's been on market 191 days — a 12% lower offer ($18k) is reasonable based on typical stale-listing flexibility.
Risks & watch-outs
- Watch-outs: flood insurance adds $66/mo; built in 1906 — expect roof / HVAC / electrical / plumbing capex.
- Climate carrying-cost: severe flood risk — expect insurance premiums to compound above CPI over the hold.
Questions for the listing agent
- It's been on market 191 days. Have you received any prior offers? Is the seller open to a 12% concession, seller financing, or rate buy-down credit?
- Built in 1906 — when were the roof, HVAC, electrical panel, plumbing, and water heater last replaced?
- What's the actual annual flood-insurance premium (NFIP or private), and is the property in a SFHA with mandatory coverage?
- Why hasn't it sold? Are there any deal-killer items the seller is aware of (foundation, flood, title, zoning, code violations)?
- Is there a deadline driving the sale (1031 exchange, divorce, estate, relocation)? That informs how much negotiation room exists.
- Schools are F-rated, which usually means shorter tenancies and higher turnover. Who's the typical renter profile here, and what's been the actual vacancy rate?
- The area grade is low — what's the realistic commute time and amenity access for the typical tenant pool here? Any planned neighborhood developments (good or bad) we should know about?
- What's the average days-on-market for RENTAL listings here right now (not sales)? A rising rental-DOM trend means longer vacancies and softer asking-rent achievability than the comps imply.
- What's the recent tenant-quality profile in this submarket — average credit score on applications, eviction rate, late-payment / NSF rate, and stable-employment percentage? A property-management company in the area should have these aggregated.
- How much new for-sale + rental construction is in the pipeline within 1–3 miles? Heavy new supply typically softens prices + rents 12–24 months out; constrained supply supports both.
Investment metrics
- 1% rule
- 7.11% ✓
- Cap rate
- 65.25%
- Cash-on-cash
- 210.57%
- DSCR
- 10.37
- GRM
- 1.2
CMA / ARV
No comps found within radius.
Projected returns pro-forma
2.67% appreciation · 3.0% rent growth · sell at horizon
- IRR
- —
- Equity multiple
- 11.80×
- Total profit
- $60,476
- Equity at exit
- $8,620
- IRR
- —
- Equity multiple
- 24.94×
- Total profit
- $134,040
- Equity at exit
- $13,002
Cash invested: $5,600 (down + closing). Projections, not guarantees.
Landlord ↔ Tenant lean methodology
- Overall (STATE)
- 83 Strongly Landlord-Friendly
- State West Virginia
- 83 Strongly Landlord-Friendly · R+22
- County
- — inherits STATE
- City
- — inherits STATE
ZIP-level market 26033
- Home prices YoY
- 1.4%
- Active inventory
- 10
- Price-to-rent
- 1.2×
Monthly cashflow live
- Estimated rent
- $1,421 medium interval (Pro) →
- Mortgage (P&I)
- −$105
- Tax from tax record
- −$27 /mo · $321/yr
- Insurance
- −$8
- Flood insurance flood zone
- −$66 /mo · $798/yr
- HOA
- −$0
- Vacancy / Maint / Mgmt
- −$298
- Net cashflow
- $916
Break-even live
Sensitivity live
| Price | -10% $928 | -5% $922 | +0% $916 | +5% $911 | +10% $905 |
|---|---|---|---|---|---|
| Rent | -10% $804 | -5% $860 | +0% $916 | +5% $972 | +10% $1,028 |
| Rate | -1.0pp $926 | -0.5pp $921 | base $916 | +0.5pp $911 | +1.0pp $906 |
UW: 25.0% down · 7.5% · 30yr · 1.5% tax · 5.0% vac · 8.0% maint · 8.0% mgmt
Financing live
Cash to close
- Down payment
- $5,000
- Closing costs
- $600
- Reserves months
- —
- Total cash needed
- —
Loan-product check · same deal, 3 products live
Conventional
25% down · 7.5% · 30yr
- Down + closing
- —
- Monthly P&I
- —
- Monthly cashflow
- —
- DSCR
- —
- Eligible?
- —
Personal DTI + credit; lowest rate.
DSCR
20% down · 8.5% · 30yr
- Down + closing
- —
- Monthly P&I
- —
- Monthly cashflow
- —
- DSCR
- —
- Eligible?
- —
No personal income docs; deal must DSCR.
Hard money
10% down · 12.0% · 12mo
- Down + closing
- —
- Monthly P&I
- —
- Monthly cashflow
- —
- DSCR
- —
- Eligible?
- —
Short-term bridge; refi at stabilization.
Listing history 15 events
-
2026-06-19days on market $20,000 Active 191 DOM
-
2026-06-18days on market $20,000 Active 190 DOM
-
2026-06-17days on market $20,000 Active 189 DOM
-
2026-06-16days on market $20,000 Active 188 DOM
-
2026-06-15days on market $20,000 Active 187 DOM
-
2026-06-14days on market $20,000 Active 185 DOM
-
2026-06-12days on market $20,000 Active 184 DOM
-
2026-06-09days on market $20,000 Active 181 DOM
-
2026-06-08days on market $20,000 Active 180 DOM
-
2026-06-07days on market $20,000 Active 179 DOM
-
2026-06-02days on market $20,000 Active 174 DOM
-
2026-06-01days on market $20,000 Active 173 DOM
-
2026-05-31days on market $20,000 Active 172 DOM
-
2026-05-30days on market $20,000 Active 171 DOM
-
2025-12-10$20,000 Active
ⓘ Source: listings_history table (triggers on properties + properties_extension) + one-shot
backfill from property_details.listing_events for pre-trigger history.
Tax reassessment forecast WV · Resets to sale price
- Current annual tax
- $321 · $27/mo
- Projected year-2 tax
- $321 · $27/mo
- Expected delta
- $0/yr ($0/mo · 0.0%)
ⓘ Screening estimate from a state-policy table — verify with the county assessor before closing.
Climate risk First Street
- Flood 9/10 Extreme FEMA zone X (unshaded) · 99% chance over 30 yrs
- Wildfire 1/10 Low
- Heat 3/10 Moderate 7 d/yr ≥96°F today · 20 d/yr by 30 yrs out
- Wind 1/10 Low
- Air quality 2/10 Low 0 unhealthy d/yr today · 1 by 30 yrs out
Nearby sold comps map
Loading sold comps map…
Walkable amenities ~0.75 mi
Loading nearby amenities…
Taxation est. · year 1
- Rental income
- $17,052
- − Mortgage interest
- −$1,120
- − Property taxes
- −$321
- − Insurance
- −$897
- − Repairs & maintenance
- −$1,364
- − Management
- −$1,364
- − Depreciation
- −$582
- Taxable income
- $11,404
- Est. tax owed @ 24.0%
- −$2,737
- After-tax cash flow
- $8,258/yr
For passive investors: Depreciation is non-cash, so a rental often shows a tax loss while cash-flowing — sheltering income. Rental losses are passive: they offset passive income freely, and up to $25,000/yr can offset ordinary (W-2) income if you actively participate and your MAGI is under $100k (phasing out to $0 by $150k); unused losses carry forward. On sale, claimed depreciation is recaptured at up to 25%, and gains may owe capital-gains tax (a 1031 exchange can defer both). Figures are a year-1 estimate at your 24.0% rate — not tax advice; consult a CPA.
Schools (NCES district)
- District
- Marshall County Schools
- NCES district ID
- 5400750
- Math proficiency
- 28% ▼ -6.00%
- Reading proficiency
- 36% ▼ -4.00%
- Median HH income
- $40,289
- Composite
- 26.91/100
- National rank
- #7086
- State rank
- #21 of 55 in WV
Livability — Cameron
- Score
- 59/100
- State rank
- #231
- US rank
- #20294
Category grades
Schools grade is shown separately in the Schools card above.
Census & demographics
- Census place
- Cameron, WV
- City population
- 1,806
- Population (ZIP)
- 1,806
Population outlook (Marshall County) Hauer SSP2
- Today (2025)
- 30,387 people
- By 2030
- 29,242 · -3.8%
- By 2040
- 26,806 · -11.8%
- By 2050
- 24,627 · -19.0%
- By 2075
- 19,846 · -34.7%
- By 2100
- 15,169 · -50.1%
Race, ethnicity, and origin ACS 2023
- Neighborhood character
- Predominantly White (98%)
- Race & ethnicity
- White 98% Hispanic / Latino 2%
- Common ancestry
- Italian 2% Portuguese 2% Romanian 2%
Political lean MEDSL · Marshall
- 2024 margin
- Solid R (+50.0) · D 24.1% · R 74.1% · Other 1.8%
- 2008→2024 swing
- -37.5pp toward R · 2008: -12.6pp · 2024: -50.0pp
- All cycles
- 2024: R+50.0 2020: R+49.6 2016: R+51.0 2012: R+28.6 2008: R+12.6
Not yet ingested
- Civics
- —
Market trends
- HPI YoY
- ▲ 2.67%
- Current HPI
- 194.1628
- Rent YoY
- —
- Metro
- —
- State GDP YoY
- —
- F500 in state
- 0
Price history
1 event — show timeline
- 2025-12-10 Listed $20,000 WBOR
Property tax history
+2.6%/yrLatest (2025): $321 · +4.4% YoY. Source: county tax records.
Cash-flow waterfall
monthlySold comps — $/sqft
last 12 mo · ≤1 miLoading sold comps…