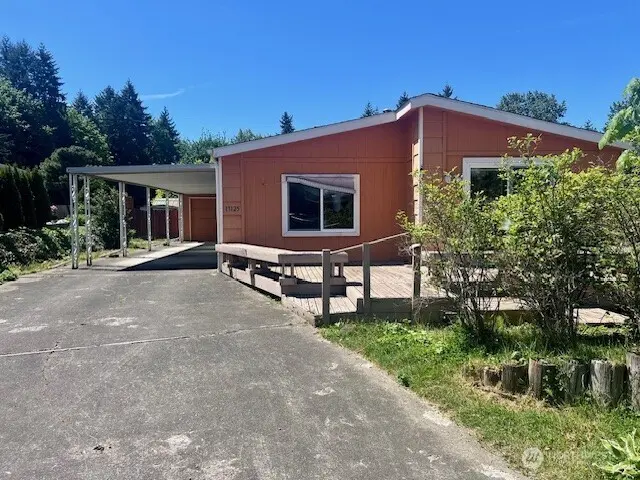
17125 Woodcrest Dr NE · Bothell, WA
Flood risk 1/10 · Minimal
- FEMA flood zone
- X (unshaded)
- Chance of flooding over 30 yrs
- 0.0%
- Est. flood insurance / yr
- $507 – $1,088
Fire risk 1/10 · Minimal
- Est. fire insurance / yr
- $604 – $1,122
Heat risk 3/10 · Minor
- Hot days now (above 86°F)
- 7 days/yr
- Hot days in 30 yrs
- 14 days/yr
Wind risk 1/10 · Minimal
- Chance of severe wind over 30 yrs
- —
Air-quality risk 6/10 · Moderate
- Unhealthy air days now
- 9 days/yr
- Unhealthy air days in 30 yrs
- 9 days/yr
Risk factors via First Street. Map © Google.
Why this score? — see what drove the D grade
The composite is a weighted blend of 9 inputs, each scored 0–100. Each bar is that input's sub-score; the figure is the points it added to the 100-point composite (weight × sub-score).
- ARV discount +15.0/15.0
- Schools +6.7/10.0
- Cash flow +6.5/30.0
- Livability +4.2/5.0
- Rent growth +2.6/5.0
- Condition / age +2.5/5.0
- 1% rule +2.2/10.0
- DSCR +0.8/10.0
- Appreciation +0.0/10.0
$430,000
🖨 Deal sheet (PDF) 📄 Offer letter ✓ Due diligence
Listing remarks
Located in a desirable 55+ community where you own the land, this 3 bedroom, 1.75 bathroom manufactured home offers 1,582 sqft of opportunity and potential. Property features a 1-car garage, 1-car carport, two storage sheds, greenhouse, and dedicated garden space perfect for those who enjoy gardening or outdoor hobbies. Spacious floor plan with great natural light and functional living spaces ready for your personal touches and updates. Convenient location close to shopping, dining, medical facilities, and freeway access. A rare chance to own land in a peaceful community setting with plenty of outdoor storage and workspace options.
Key facts
- Outdoor storage
- Workspace options
- Own the land
Tags
Property features AI
Finance
- Financial info: Accepts cash and rehab loan terms
- HOA & community: HOA with monthly fee of $183 covering common area maintenance and water; Age-restricted senior community with clubhouse and recorded CCRs
Exterior
- Parking: Attached garage; Attached carport; Covered parking for 3 vehicles
- Utilities: Electric energy source; Public water (City of Bothell); Sewer connected (City of Bothell); Power provided by PSE; Electric water heater
- Home design: Manufactured home (double wide); Single-story; Built or effectively updated in 1989
- Construction: Wood construction; Composition roof; Manufactured house structure
- Exterior features: Wood products exterior; Garden space; Paved lot
Interior
- Kitchen: Kitchen without eating space
- Bedrooms: 3 bedrooms (all on the main level); Primary bedroom (main level)
- Flooring: Engineered hardwood; Vinyl; Carpet
- Bathrooms: 1 full bathroom; 1 three-quarter bathroom; 2 showers; 1 bathtub; 2 main-level bathrooms
- Heating & cooling: Forced air heating; No central cooling
- Interior features: Dining room; Fireplace (wood-burning); Water heater
- Laundry & utility: Water heater located in a storage closet
Neighborhood map
What this means for you Summary
Snapshot
- This is a 3-bed/2.0-bath manufactured listed at $430k.
Deal economics
- At list price, monthly cash flow is $-717 ($-9k/yr) — negative.
- To cash-flow at today's rent, offer at most $326k (24.1% below list).
- To meet the 1% rule (rent ≥ 1% of price), the offer needs to be $309k (28.2% below list).
- Recommended offer: $309k (28.2% below list) — sets the bar for 1% rule.
- Cap rate 4.3% vs local median 1.5% in Bothell — top-decile yield for the area; either an underpriced asset or a hidden risk that comps aren't pricing in. Stress-test before assuming the spread holds.
Location & tenants
- Location reads 83/100 on livability (#53 in WA, #962 nationally) — a professional / high-income tenant draw. Strengths: commute A+, employment A+, health & safety A+; Watch: amenities C-, cost of living F.
- Northshore School District (suburban): math 69% / reading 78% proficiency, ranked #9 of 291 in WA (top 3%) — strong family-tenant draw, lease renewals of 3-5y typical; only 12% free/reduced lunch — higher-income household profile.
- Zoned schools: Woodmoor Elementary (644 students, 35% FRL); Inglemoor Hs (1,542 students, 20% FRL) — zoned schools average 28% FRL vs 12% district-wide (15 pts higher); higher-poverty schools than district average — tighter screening recommended.
- Market conditions: Rents flat; 182 active listings in the ZIP; 26 comparable units currently listed for rent nearby; rentals leasing fast (median 6d on market — plan ~1-2 weeks tenant-placement turnaround); high-income renter base; 10,555 units permitted in King County in 2024 (7,119 in 5+ unit buildings).
Forward outlook
- Local home prices are declining (-3.0%/yr); year-one equity from $3k of loan paydown is wiped out by about $13k of value loss. Plan a longer hold.
- King County population projected at +44% by 2050 — long-run rental-demand tailwind backs the buy-and-hold thesis.
Negotiation context
- Only 5 days on market — expect competitive offers; lowballing is unlikely to land.
Questions for the listing agent
- What do current leases actually rent for vs. the listed asking? Can we see a recent rent roll and the last 12 months of T-12 income?
- What does the HOA fee cover, when was the last increase, and are there any pending special assessments or reserve-fund shortfalls?
- Is there a deadline driving the sale (1031 exchange, divorce, estate, relocation)? That informs how much negotiation room exists.
- Schools are A-rated — typically a magnet for longer-tenancy family renters. What's the average tenant stay here, and is there a school-zone premium baked into asking?
- The area grade is low — what's the realistic commute time and amenity access for the typical tenant pool here? Any planned neighborhood developments (good or bad) we should know about?
- What's the average days-on-market for RENTAL listings here right now (not sales)? A rising rental-DOM trend means longer vacancies and softer asking-rent achievability than the comps imply.
- What's the recent tenant-quality profile in this submarket — average credit score on applications, eviction rate, late-payment / NSF rate, and stable-employment percentage? A property-management company in the area should have these aggregated.
- How much new for-sale + rental construction is in the pipeline within 1–3 miles? Heavy new supply typically softens prices + rents 12–24 months out; constrained supply supports both.
Investment metrics
- 1% rule
- 0.72% ✗
- Cap rate
- 4.29%
- Cash-on-cash
- -7.15%
- DSCR
- 0.68
- GRM
- 11.6
CMA / ARV
- ARV (median comp)
- $571,920
- List price
- $430,000
- Delta
- -24.81%
- Verdict
- UNDERPRICED
- Comps
- 4 within 1.0 mi
Show comp detail 5 sales within ~0.75 mi
| Address | Dist | Beds/Ba | Sqft | Sold | Price | $/sf | Match |
|---|---|---|---|---|---|---|---|
| 11330 E Riverside Dr #7 | 0.24mi | 3/2.0 | 1,536 (-3%) | 2mo | $120,000 | $78 | 82 |
| 17316 Woodcrest Dr NE | 0.09mi | 3/2.0 | 1,568 (-1%) | 18mo | $549,950 | $351 | 79 |
| 17224 Woodcrest Dr NE | 0.06mi | 3/2.0 | 1,440 (-9%) | 10mo | $614,000 | $426 | 74 |
| 17042 Woodcrest Dr NE | 0.12mi | 3/2.0 | 1,536 (-3%) | 24mo | $575,000 | $374 | 70 |
| 17343 Woodcrest Dr NE | 0.14mi | 3/2.0 | 1,440 (-9%) | 23mo | $565,000 | $392 | 59 |
Match score weights: distance 35% · size 25% · config 20% · recency 20%. Top-matched comps best support the ARV.
Projected returns pro-forma
-3.0% appreciation · 0.25% rent growth · sell at horizon
- IRR
- -32.0%
- Equity multiple
- -0.03×
- Total profit
- $-123,495
- Equity at exit
- $64,114
- IRR
- -57.6%
- Equity multiple
- -0.64×
- Total profit
- $-197,966
- Equity at exit
- $37,179
Cash invested: $120,400 (down + closing). Projections, not guarantees.
Landlord ↔ Tenant lean methodology
- Overall (STATE)
- 28 Tenant-Leaning
- State Washington
- 28 Tenant-Leaning · D+8
- County
- — inherits STATE
- City
- — inherits STATE
ZIP-level market 98011
- Rents YoY
- 0.2%
- Active inventory
- 182
- Price-to-rent
- 11.6×
Monthly cashflow live
- Estimated rent
- $3,086 high interval (Pro) →
- Mortgage (P&I)
- −$2,255
- Tax est. 1.5%
- −$538 /mo · $6,450/yr
- Insurance
- −$179
- HOA
- −$183
- Vacancy / Maint / Mgmt
- −$648
- Net cashflow
- $-717
Break-even live
Sensitivity live
| Price | -10% $-420 | -5% $-568 | +0% $-717 | +5% $-866 | +10% $-1,014 |
|---|---|---|---|---|---|
| Rent | -10% $-961 | -5% $-839 | +0% $-717 | +5% $-595 | +10% $-473 |
| Rate | -1.0pp $-500 | -0.5pp $-608 | base $-717 | +0.5pp $-828 | +1.0pp $-942 |
UW: 25.0% down · 7.5% · 30yr · 1.5% tax · 5.0% vac · 8.0% maint · 8.0% mgmt
Financing live
Cash to close
- Down payment
- $107,500
- Closing costs
- $12,900
- Reserves months
- —
- Total cash needed
- —
Loan-product check · same deal, 3 products live
Conventional
25% down · 7.5% · 30yr
- Down + closing
- —
- Monthly P&I
- —
- Monthly cashflow
- —
- DSCR
- —
- Eligible?
- —
Personal DTI + credit; lowest rate.
DSCR
20% down · 8.5% · 30yr
- Down + closing
- —
- Monthly P&I
- —
- Monthly cashflow
- —
- DSCR
- —
- Eligible?
- —
No personal income docs; deal must DSCR.
Hard money
10% down · 12.0% · 12mo
- Down + closing
- —
- Monthly P&I
- —
- Monthly cashflow
- —
- DSCR
- —
- Eligible?
- —
Short-term bridge; refi at stabilization.
Rent comps 26 comps
| Address | Beds | Baths | Sqft | Rent | $/sqft | DOM | Units | Dist |
|---|---|---|---|---|---|---|---|---|
| 16386 118th Ct NE Bothell, WA | 2.0 | 2.5 | 1129 | $2,700 | $2.39 | 44d | 1 | 0.37mi |
| 11895 NE 163rd Pl Unit 20-3 Bothell, WA | 2.0 | 2.5 | 1129 | $2,800 | $2.48 | 6d | 1 | 0.40mi |
| 16125 Juanita Woodinville Way NE #1714 Bothell, WA | 2.0 | 2.5 | 1173 | $2,800 | $2.39 | 25d | 1 | 0.43mi |
| 16125 Juanita Woodinville Way NE Bothell, WA | 1.0–2.0 | 1.0–2.5 | 921 | $2,800 | $3.04 | 44d | 4 | 0.43mi |
| 12109 Woodinville Dr Bothell, WA | 1.0–3.0 | 1.0–2.0 | 965 | $2,895 | $3.00 | 6d | 7 | 0.44mi |
| 15515 Juanita Woodinville Way NE Bothell, WA | 1.0–2.0 | 1.0–2.0 | 999 | $2,913 | $2.91 | 0d | 12 | 0.56mi |
| 18101 126th Ave NE Bothell, WA | 1.0–3.0 | 1.0–2.0 | 921 | $3,267 | $3.55 | 0d | 39 | 0.77mi |
| 17409 133rd Ave NE Woodinville, WA | 1.0–3.0 | 1.0–2.0 | 1178 | $4,399 | $3.73 | 0d | 26 | 1.02mi |
| 18414 104th Ave NE Bothell, WA | 1.0–2.0 | 1.0–2.0 | 957 | $2,999 | $3.13 | 0d | 10 | 1.04mi |
| 12207 NE 191st St Bothell, WA | 3.0 | 1.0–3.0 | 1339 | $4,715 | $3.52 | 0d | 1 | 1.04mi |
| 18120 102nd Ave NE Bothell, WA | 2.0 | 1.0–2.0 | 833 | $3,046 | $3.65 | 3d | 7 | 1.05mi |
| 19128 112th Ave NE Bothell, WA | 1.0–2.0 | 1.0–2.0 | 1031 | $3,105 | $3.01 | 0d | 15 | 1.10mi |
| 18420 102nd Ave NE Bothell, WA | 1.0–2.0 | 1.0–2.0 | 800 | $2,986 | $3.73 | 0d | 10 | 1.12mi |
| 17255 135th Ave NE Woodinville, WA | 2.0 | 1.0–2.0 | 842 | $3,704 | $4.40 | 0d | 28 | 1.14mi |
| 10324 NE 186th St Unit 1 Bothell, WA | 2.0 | 1.5 | 1108 | $2,300 | $2.08 | 44d | 1 | 1.15mi |
| 18141 Bothell Way NE Bothell, WA | 1.0–2.0 | 1.0–2.0 | 909 | $4,434 | $4.88 | 0d | 24 | 1.25mi |
| 10826 NE 148th Ln Unit H102 Bothell, WA | 3.0 | 2.0 | 1084 | $2,795 | $2.58 | 44d | 1 | 1.27mi |
| 10104 NE 189th St Bothell, WA | 3.0 | 2.5 | 2200 | $3,800 | $1.73 | 5d | 1 | 1.33mi |
| 9924 NE 185th St Bothell, WA | 1.0–3.0 | 1.0–2.0 | 1194 | $3,940 | $3.30 | 3d | 7 | 1.35mi |
| 12917 NE 195th St Bothell, WA | 2.0 | 2.0 | 1150 | $3,000 | $2.61 | 44d | 1 | 1.35mi |
| 12601 NE 197th St Bothell, WA | 3.0 | 2.0 | 1720 | $3,700 | $2.15 | 44d | 1 | 1.35mi |
| 12424 NE 145th St Unit C 25 Kirkland, WA | 3.0 | 1.5 | 1052 | $2,650 | $2.52 | 44d | 1 | 1.37mi |
| 9525 NE 180th St Unit 303 Bothell, WA | 2.0 | 2.0 | 1080 | $2,375 | $2.20 | 6d | 1 | 1.40mi |
| 19604 129th Ave NE Bothell, WA | 3.0 | 2.0 | 1440 | $3,400 | $2.36 | 13d | 1 | 1.40mi |
| 12030 NE 144th St Kirkland, WA | 3.0 | 2.0 | 1679 | $3,500 | $2.08 | 44d | 1 | 1.43mi |
| 9505 NE 180th St Unit 102 Bothell, WA | 2.0 | 2.0 | 1070 | $2,595 | $2.43 | 12d | 1 | 1.45mi |
HOA detail
- Monthly dues
- $183 · $2,196/yr
Listing history 2 events
-
2026-05-18status Pending
-
2026-05-12$430,000 Active
ⓘ Source: listings_history table (triggers on properties + properties_extension) + one-shot
backfill from property_details.listing_events for pre-trigger history.
Climate risk First Street
- Flood 1/10 Low FEMA zone X (unshaded) · 0% chance over 30 yrs
- Wildfire 1/10 Low
- Heat 3/10 Moderate 7 d/yr ≥86°F today · 14 d/yr by 30 yrs out
- Wind 1/10 Low
- Air quality 6/10 Major 9 unhealthy d/yr today · 9 by 30 yrs out
Nearby sold comps map
Loading sold comps map…
Walkable amenities ~0.75 mi
Loading nearby amenities…
Taxation est. · year 1
- Rental income
- $37,027
- − Mortgage interest
- −$24,087
- − Property taxes
- −$6,450
- − Insurance
- −$2,150
- − Repairs & maintenance
- −$2,962
- − Management
- −$2,962
- − HOA
- −$2,196
- − Depreciation
- −$12,509
- Taxable loss
- −$16,289
- Est. tax savings @ 24.0%
- +$3,909
- After-tax cash flow
- $-4,695/yr
For passive investors: Depreciation is non-cash, so a rental often shows a tax loss while cash-flowing — sheltering income. Rental losses are passive: they offset passive income freely, and up to $25,000/yr can offset ordinary (W-2) income if you actively participate and your MAGI is under $100k (phasing out to $0 by $150k); unused losses carry forward. On sale, claimed depreciation is recaptured at up to 25%, and gains may owe capital-gains tax (a 1031 exchange can defer both). Figures are a year-1 estimate at your 24.0% rate — not tax advice; consult a CPA.
Schools (NCES district)
- District
- Northshore School District
- NCES district ID
- 5305910
- Math proficiency
- 69% ▼ -3.00%
- Reading proficiency
- 78% ▼ -1.00%
- Median HH income
- $92,951
- Composite
- 67.41/100
- National rank
- #826
- State rank
- #9 of 291 in WA
Livability — Bothell
- Score
- 83/100
- State rank
- #53
- US rank
- #962
Category grades
Schools grade is shown separately in the Schools card above.
Census & demographics
- Census place
- Bothell, WA
- County
- King County · 2,251,916 people
- City population
- 141,635
- Metro
- Seattle-Tacoma-Bellevue, WA
- Population (ZIP)
- 28,963
- Household income
- $131,667
- Rent vs Own
- Severe rent burden
- 1156.0
Population outlook (King County) Hauer SSP2
- Today (2025)
- 2,576,485 people
- By 2030
- 2,803,316 · +8.8%
- By 2040
- 3,255,921 · +26.4%
- By 2050
- 3,706,444 · +43.9%
- By 2075
- 4,746,063 · +84.2%
- By 2100
- 5,407,730 · +109.9%
Race, ethnicity, and origin ACS 2023
- Neighborhood character
- Diverse neighborhood (Simpson 0.55)
- Race & ethnicity
- White 64% Asian 17% Two or more races 11% Hispanic / Latino 10%
- Hispanic origin (detail)
- Mexican 6%
- Common ancestry
- Portuguese 5% Italian 3% Romanian 3%
- Foreign-born
- 21% · Canada, China, Vietnam
- Languages at home
- 72% English-only · Spanish 7% Other Indo-European 6% Chinese 5%
Political lean MEDSL · King
- 2024 margin
- Solid D (+51.7) · D 74.2% · R 22.5% · Other 3.4%
- 2008→2024 swing
- +9.6pp toward D · 2008: 42.1pp · 2024: 51.7pp
- All cycles
- 2024: D+51.7 2020: D+52.7 2016: D+50.4 2012: D+39.9 2008: D+42.1
Not yet ingested
- Civics
- —
Market trends
- HPI YoY
- ▼ -779.77%
- Current HPI
- 400.5642
- Rent YoY
- ▲ 0.25%
- Metro
- Seattle-Tacoma-Bellevue, WA
- State GDP YoY
- ▲ 4.65%
- F500 in state
- 22
Industry mix (Fortune 500 HQ in WA)
| Industry | F500 HQs | Revenue |
|---|---|---|
| Retail | 2 | $269B |
|
||
| Technology / Retail | 1 | $638B |
|
||
| Technology | 1 | $245B |
|
||
| Telecommunications | 1 | $38B |
|
||
| Food / Beverage | 1 | $36B |
|
||
| Automotive / Trucks | 1 | $34B |
|
||
Price history
2 events — show timeline
- 2026-05-18 Pending — NWMLS as Distributed by MLS Grid
- 2026-05-12 Listed $430,000 NWMLS as Distributed by MLS Grid
Property tax history
-15.9%/yrLatest (2025): $372 · -4.8% YoY. Source: county tax records.
Cash-flow waterfall
monthlySold comps — $/sqft
last 12 mo · ≤1 miLoading sold comps…