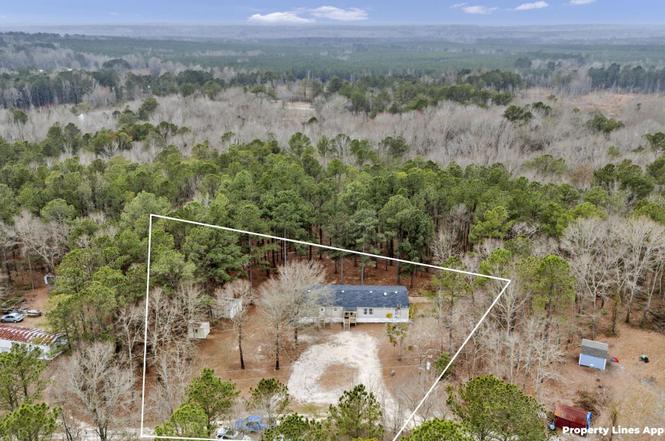
47 Belvis Rd · Elgin, SC
Flood risk 1/10 · Minimal
- FEMA flood zone
- X (unshaded)
- Chance of flooding over 30 yrs
- 0.0%
- Est. flood insurance / yr
- $507 – $1,088
Fire risk 5/10 · Moderate
- Est. fire insurance / yr
- $783 – $1,453
Heat risk 6/10 · Moderate
- Hot days now (above 107°F)
- 7 days/yr
- Hot days in 30 yrs
- 16 days/yr
Wind risk 6/10 · Moderate
- Chance of severe wind over 30 yrs
- 59.0%
Air-quality risk 2/10 · Minimal
- Unhealthy air days now
- 1 days/yr
- Unhealthy air days in 30 yrs
- 1 days/yr
Risk factors via First Street. Map © Google.
Why this score? — see what drove the C grade
The composite is a weighted blend of 9 inputs, each scored 0–100. Each bar is that input's sub-score; the figure is the points it added to the 100-point composite (weight × sub-score).
- Cash flow +25.5/30.0
- DSCR +8.5/10.0
- ARV discount +7.5/15.0
- 1% rule +5.6/10.0
- Schools +3.8/10.0
- Rent growth +3.2/5.0
- Livability +2.8/5.0
- Condition / age +2.5/5.0
- Appreciation +0.0/10.0
$210,000
🖨 Deal sheet 📄 Offer letter ✓ Due diligence
Listing remarks
Enjoy peaceful country living on 1.1 acres with no HOA. Enjoy ample parking for multiple vehicles, and bring your livestock — this property offers the freedom and space to fit your lifestyle. This open and spacious home features 5 bedrooms, 2 bathrooms, the 5th space can be used as an additional bedroom or home office. Another great feature is the split floor plan, with the primary bedroom located on one side of the home and the remaining bedrooms on the opposite side, offering added privacy. The property offers an open kitchen, two large living areas, and a separate laundry room located just off the kitchen with convenient outdoor access. Out back, enjoy a fully fenced and private ba
Key facts
- Split floor plan
- No hoa
- Open kitchen
Tags
Property features AI
Finance
- Other: Approximately 1.1-acre lot; Dirt road access
Exterior
- Utilities: Well water; Septic sewer
- Home design: Single-story home
- Construction: Vinyl exterior; Crawlspace foundation
- Exterior features: Deck; Shed; Rear chain-link fencing
Interior
- Kitchen: Island; Painted cabinets; Dishwasher; Disposal; Refrigerator; Countertop microwave; Free-standing range
- Bedrooms: Master bedroom on main level with double vanity, garden tub, private bath and walk-in closet; Three additional main-level bedrooms with private closets (carpeted)
- Flooring: Carpet in bedrooms, living room, and formal living room
- Bathrooms: Two full bathrooms
- Heating & cooling: Central heating; Central air conditioning
- Interior features: Ceiling fans in master and formal living areas; Painted kitchen cabinets; Kitchen island; Heated laundry space; Carpeted living and formal living areas
- Laundry & utility: Laundry on main level in heated space
Neighborhood map
What this means for you Summary
Snapshot
- This is a 5-bed/2.0-bath manufactured listed at $210k.
Deal economics
- At list price, monthly cash flow is $491 ($6k/yr) — positive.
- The deal already cash-flows at list — no discount required.
- Meets the 1% rule at list price ($2k rent vs $210k).
- Recommended offer: $197k (6.0% below list) — sets the bar for market timing.
- Cap rate 9.1% vs local median 4.2% in Elgin — top-decile yield for the area; either an underpriced asset or a hidden risk that comps aren't pricing in. Stress-test before assuming the spread holds.
Location & tenants
- Location reads 55/100 on livability (#302 in SC) — a working-class tenant base; expect higher turnover. Strengths: cost of living A+, housing A+; Watch: crime F, amenities F, commute F.
- Kershaw 01 (rural): math 38% / reading 51% proficiency, ranked #25 of 80 in SC (top 31%) — families likely to look elsewhere, expect single-tenant / working-renter base with shorter leases.
- Zoned schools: Wateree Elementary (math 51% / reading 51%, grade C-, #158 of 597 statewide, top 27%, 732 students, 72% FRL); Lugoff-Elgin High (math 65% / reading 89%, grade A-, #28 of 196 statewide, top 16%, 1,744 students, 62% FRL) — zoned schools average 67% FRL vs 49% district-wide (18 pts higher); higher-poverty schools than district average — tighter screening recommended.
- Zoned-school proficiency averages 64% at this address vs 44% district-wide (+20 pts) — the actual schools serving this property are materially stronger than the Kershaw 01 average implies; a family-tenant draw the district grade alone would hide.
- Market conditions: Rents rising (+2.7%/yr); 334 active listings in the ZIP; solid renter incomes; 491 units permitted in Kershaw County in 2024 (0 in 5+ unit buildings).
- This rent runs 31% of the median local income ($87k/yr) — at the standard rent-burdened threshold; future hikes will face affordability resistance.
Forward outlook
- Local home prices are declining (-3.0%/yr); year-one equity from $1k of loan paydown is wiped out by about $6k of value loss. Plan a longer hold.
- Kershaw County population projected at +8% by 2050 — modest demand growth; plan on rents tracking national, not racing it.
Negotiation context
- It's been on market 77 days — a 6% lower offer ($197k) is reasonable based on typical stale-listing flexibility.
- 5 sale attempts since 3y ago with the ask held roughly flat each time — persistent listings suggest the price (not the market) is what's stuck; bring a comps-based counter.
Risks & watch-outs
- Climate carrying-cost: major wind risk, 59% chance of damaging wind over 30y; moderate wildfire risk; extreme-heat days projected 7→16/yr by 2055 (HVAC capex compounding) — expect insurance premiums to compound above CPI over the hold.
Questions for the listing agent
- It's been on market 77 days. Have you received any prior offers? Is the seller open to a 6% concession, seller financing, or rate buy-down credit?
- Why hasn't it sold? Are there any deal-killer items the seller is aware of (foundation, flood, title, zoning, code violations)?
- Is there a deadline driving the sale (1031 exchange, divorce, estate, relocation)? That informs how much negotiation room exists.
- Schools are D-rated, which usually means shorter tenancies and higher turnover. Who's the typical renter profile here, and what's been the actual vacancy rate?
- Crime grade is F in this area — have there been break-ins, vandalism, or insurance claims at this property in the last 3 years? What carrier currently insures it and at what premium?
- What's the average days-on-market for RENTAL listings here right now (not sales)? A rising rental-DOM trend means longer vacancies and softer asking-rent achievability than the comps imply.
- What's the recent tenant-quality profile in this submarket — average credit score on applications, eviction rate, late-payment / NSF rate, and stable-employment percentage? A property-management company in the area should have these aggregated.
- How much new for-sale + rental construction is in the pipeline within 1–3 miles? Heavy new supply typically softens prices + rents 12–24 months out; constrained supply supports both.
Investment metrics
- 1% rule
- 1.06% ✓
- Cap rate
- 9.10%
- Cash-on-cash
- 10.03%
- DSCR
- 1.45
- GRM
- 7.8
CMA / ARV
No comps found within radius.
Projected returns pro-forma
-3.0% appreciation · 2.7% rent growth · sell at horizon
- IRR
- -1.6%
- Equity multiple
- 0.94×
- Total profit
- $-3,480
- Equity at exit
- $31,312
- IRR
- 7.8%
- Equity multiple
- 1.58×
- Total profit
- $34,218
- Equity at exit
- $18,157
Cash invested: $58,800 (down + closing). Projections, not guarantees.
Landlord ↔ Tenant lean methodology
- Overall (STATE)
- 90 Strongly Landlord-Friendly
- State South Carolina
- 90 Strongly Landlord-Friendly · R+6
- County
- — inherits STATE
- City
- — inherits STATE
ZIP-level market 29045
- Home prices YoY
- -17.9%
- Rents YoY
- 2.7%
- Active inventory
- 334
- Price-to-rent
- 7.8×
Monthly cashflow live
- Estimated rent
- $2,231 medium interval (Pro) →
- Mortgage (P&I)
- −$1,101
- Tax from tax record
- −$82 /mo · $987/yr
- Insurance
- −$88
- HOA
- −$0
- Vacancy / Maint / Mgmt
- −$468
- Net cashflow
- $491
Break-even live
UW: 25.0% down · 7.5% · 30yr · 1.5% tax · 5.0% vac · 8.0% maint · 8.0% mgmt
Financing live
Cash to close
- Down payment
- $52,500
- Closing costs
- $6,300
- Reserves months
- —
- Total cash needed
- —
Loan-product check · same deal, 3 products live
Conventional
25% down · 7.5% · 30yr
- Down + closing
- —
- Monthly P&I
- —
- Monthly cashflow
- —
- DSCR
- —
- Eligible?
- —
Personal DTI + credit; lowest rate.
DSCR
20% down · 8.5% · 30yr
- Down + closing
- —
- Monthly P&I
- —
- Monthly cashflow
- —
- DSCR
- —
- Eligible?
- —
No personal income docs; deal must DSCR.
Hard money
10% down · 12.0% · 12mo
- Down + closing
- —
- Monthly P&I
- —
- Monthly cashflow
- —
- DSCR
- —
- Eligible?
- —
Short-term bridge; refi at stabilization.
Listing history 15 events
-
2026-05-21status Pending
-
2026-05-11historical Active - Contingent
-
2026-04-08price $210,000
-
2026-03-04$215,000 Active
-
2024-04-10status Pending
-
2024-03-26historical Active - Contingent
-
2024-02-08price $160,000
-
2024-02-07status Active
-
2024-02-01historical
-
2024-01-06price $165,000
-
2023-11-10status Active
-
2023-10-26historical Active - Contingent
-
2023-09-29status Active
-
2023-09-28historical Active - Contingent
-
2023-08-15$175,000 Active
ⓘ Source: listings_history table (triggers on properties + properties_extension) + one-shot
backfill from property_details.listing_events for pre-trigger history.
Tax reassessment forecast SC · Resets to sale price
- Current annual tax
- $987 · $82/mo
- Projected year-2 tax
- $1,197 · $100/mo
- Expected delta
- +$210/yr (+$18/mo · 21.3%)
ⓘ Screening estimate from a state-policy table — verify with the county assessor before closing.
Climate risk First Street
- Flood 1/10 Low FEMA zone X (unshaded) · 0% chance over 30 yrs
- Wildfire 5/10 Major
- Heat 6/10 Major 7 d/yr ≥107°F today · 16 d/yr by 30 yrs out
- Wind 6/10 Major 59% chance of damaging wind over 30 yrs
- Air quality 2/10 Low 1 unhealthy d/yr today · 1 by 30 yrs out
Nearby sold comps map
Loading sold comps map…
Walkable amenities ~0.75 mi
Loading nearby amenities…
Taxation est. · year 1
- Rental income
- $26,771
- − Mortgage interest
- −$11,763
- − Property taxes
- −$987
- − Insurance
- −$1,050
- − Repairs & maintenance
- −$2,142
- − Management
- −$2,142
- − Depreciation
- −$6,109
- Taxable income
- $2,578
- Est. tax owed @ 24.0%
- −$619
- After-tax cash flow
- $5,278/yr
For passive investors: Depreciation is non-cash, so a rental often shows a tax loss while cash-flowing — sheltering income. Rental losses are passive: they offset passive income freely, and up to $25,000/yr can offset ordinary (W-2) income if you actively participate and your MAGI is under $100k (phasing out to $0 by $150k); unused losses carry forward. On sale, claimed depreciation is recaptured at up to 25%, and gains may owe capital-gains tax (a 1031 exchange can defer both). Figures are a year-1 estimate at your 24.0% rate — not tax advice; consult a CPA.
Schools (NCES district)
- District
- Kershaw 01
- NCES district ID
- 4502550
- Math proficiency
- 38% ▼ -7.00%
- Reading proficiency
- 51% ▲ 6.00%
- Median HH income
- $44,585
- Composite
- 37.66/100
- National rank
- #4371
- State rank
- #25 of 80 in SC
Livability — Elgin
- Score
- 55/100
- State rank
- #302
- US rank
- #23258
Category grades
Schools grade is shown separately in the Schools card above.
Census & demographics
- County
- Kershaw County · 47,655 people
- City population
- 31,372
- Metro
- Columbia, SC
- Population (ZIP)
- 31,372
- Household income
- $87,366
- Rent vs Own
- Severe rent burden
- 204.0
Population outlook (Kershaw County) Hauer SSP2
- Today (2025)
- 67,683 people
- By 2030
- 69,374 · +2.5%
- By 2040
- 71,936 · +6.3%
- By 2050
- 73,292 · +8.3%
- By 2075
- 75,762 · +11.9%
- By 2100
- 72,620 · +7.3%
Race, ethnicity, and origin ACS 2023
- Neighborhood character
- Diverse neighborhood (Simpson 0.62)
- Race & ethnicity
- White 53% Black 31% Hispanic / Latino 9% Two or more races 5% Asian 3%
- Hispanic origin (detail)
- Mexican 5% Puerto Rican 2%
- Common ancestry
- Serbian 1% Slovak 1% Lithuanian 1%
- Foreign-born
- 7% · Canada, South Korea
- Languages at home
- 90% English-only · Spanish 6% Other Indo-European 1% Korean 1%
Political lean MEDSL · Kershaw
- 2024 margin
- Strong R (+28.2) · D 35.3% · R 63.5% · Other 1.2%
- 2008→2024 swing
- -9.5pp toward R · 2008: -18.7pp · 2024: -28.2pp
- All cycles
- 2024: R+28.2 2020: R+23.1 2016: R+24.8 2012: R+18.6 2008: R+18.7
Not yet ingested
- Civics
- —
Market trends
- HPI YoY
- ▼ -45.60%
- Current HPI
- 209.2469
- Rent YoY
- ▲ 2.70%
- Metro
- Columbia, SC
- State GDP YoY
- ▲ 4.51%
- F500 in state
- 2
Industry mix (Fortune 500 HQ in SC)
| Industry | F500 HQs | Revenue |
|---|---|---|
| Packaging | 1 | $7B |
|
||
Price history
+20.0% since first listed15 events — show timeline
- 2026-05-21 Pending — Consolidated MLS
- 2026-05-11 Contingent — Consolidated MLS
- 2026-04-08 Price Changed $210,000 Consolidated MLS
- 2026-03-04 Listed $215,000 Consolidated MLS
- 2024-04-10 Pending — Consolidated MLS
- 2024-03-26 Contingent — Consolidated MLS
- 2024-02-08 Price Changed $160,000 Consolidated MLS
- 2024-02-07 Relisted — Consolidated MLS
- 2024-02-01 Delisted — Consolidated MLS
- 2024-01-06 Price Changed $165,000 Consolidated MLS
- 2023-11-10 Relisted — Consolidated MLS
- 2023-10-26 Contingent — Consolidated MLS
- 2023-09-29 Relisted — Consolidated MLS
- 2023-09-28 Contingent — Consolidated MLS
- 2023-08-15 Listed $175,000 Consolidated MLS
Property tax history
+19.8%/yrLatest (2025): $987 · +113.0% YoY. Source: county tax records.
Cash-flow waterfall
monthlySold comps — $/sqft
last 12 mo · ≤1 miLoading sold comps…