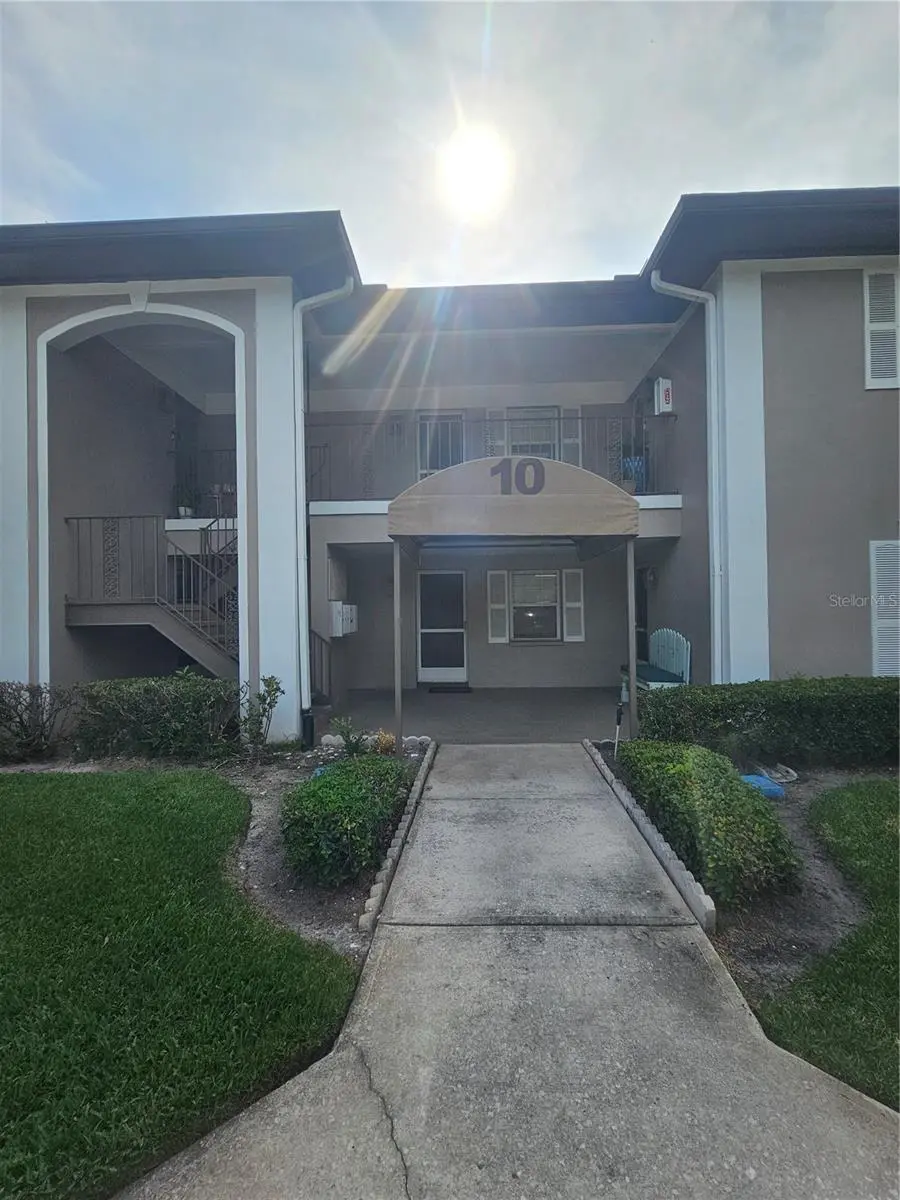
5265 E Bay Dr #1013 · Largo, FL
Flood risk 4/10 · Minor
- FEMA flood zone
- X (unshaded)
- Chance of flooding over 30 yrs
- 0.23%
- Est. flood insurance / yr
- $507 – $1,088
Fire risk 1/10 · Minimal
- Est. fire insurance / yr
- $947 – $1,759
Heat risk 10/10 · Severe
- Hot days now (above 107°F)
- 7 days/yr
- Hot days in 30 yrs
- 23 days/yr
Wind risk 10/10 · Severe
- Chance of severe wind over 30 yrs
- 99.0%
Air-quality risk 3/10 · Minor
- Unhealthy air days now
- 3 days/yr
- Unhealthy air days in 30 yrs
- 3 days/yr
Risk factors via First Street. Map © Google.
Why this score? — see what drove the C- grade
The composite is a weighted blend of 9 inputs, each scored 0–100. Each bar is that input's sub-score; the figure is the points it added to the 100-point composite (weight × sub-score).
- Cash flow +16.2/30.0
- 1% rule +9.4/10.0
- ARV discount +7.5/15.0
- DSCR +5.0/10.0
- Schools +4.3/10.0
- Livability +4.1/5.0
- Condition / age +2.5/5.0
- Rent growth +1.2/5.0
- Appreciation +0.0/10.0
$120,000
🖨 Deal sheet 📄 Offer letter ✓ Due diligence
Listing remarks
Welcome to this ground-floor residence in the well-maintained Bay Oaks Condo community. Nestled in Building 10, located in a NO-flood zone, this unit offers privacy and peace of mind in a quiet setting. Less than 2 years old AC unit/water heater. This unit features a bright, open floor layout with wood-look tile throughout the main living areas. The generously sized bedroom includes a walk-in closet, and the effective bathroom tile and vanity. A washer and dryer are included, and there is plenty of storage throughout the unit. Enhancing the home is a windowed, screened-in solarium—ideal for year-round use and easily accessible from both the living room and bedroom. Additional highligh
Key facts
- No-flood zone
- Walk-in closet
- Wood-look tile
Tags
Property features AI
Finance
- Other: Unit is furnished; Living area 620 square feet; Building number 10
- Financial info: Total monthly fees $470; Total annual fees $5,640; Lease restrictions apply
- HOA & community: HOA managed by Westcoast Property Management; Monthly condo fee $470; Association approval required; HOA fee includes cable TV, internet, pool, escrow reserves, structure & grounds maintenance, sewer, trash and water; Pets allowed (cats and dogs), max pet weight 35 lbs; Buyer approval required for community
Exterior
- Parking: Covered parking; Ground-level parking; Guest parking available; Reserved parking; 1-car carport
- Utilities: Public water; Public sewer; Electricity connected; Water connected; Sewer connected
- Home design: Residential condominium; Single-story unit (floor 1); Faces east
- Construction: Block and concrete construction; Shingle roof; Built on slab foundation
- Exterior features: Asphalt road; Other exterior features
Interior
- Kitchen: Dishwasher; Microwave; Range; Refrigerator
- Bedrooms: 1 bedroom
- Flooring: Tile; Slab foundation
- Bathrooms: 1 full bathroom
- Heating & cooling: Central heating; Central air
- Interior features: Ceiling fans
- Laundry & utility: Washer; Dryer; Laundry closet; Outside laundry access
Neighborhood map
What this means for you Summary
Snapshot
- This is a 1-bed/1.0-bath condo listed at $120k.
Deal economics
- At list price, monthly cash flow is $64 ($763/yr) — positive.
- The deal already cash-flows at list — no discount required.
- Meets the 1% rule at list price ($2k rent vs $120k).
- Recommended offer: $116k (3.0% below list) — sets the bar for market timing.
- Cap rate 6.9% vs local median 4.2% in Largo — top-decile yield for the area; either an underpriced asset or a hidden risk that comps aren't pricing in. Stress-test before assuming the spread holds.
Location & tenants
- Location reads 82/100 on livability (#82 in FL, #1,240 nationally) — a professional / high-income tenant draw. Strengths: commute A+, cost of living A+, housing A+; Watch: employment D+, amenities F.
- Pinellas (suburban): math 51% / reading 51% proficiency, ranked #31 of 73 in FL (top 42%) — acceptable for families but not a draw, mixed tenant base, ~2y average lease.
- Market conditions: Rents falling (-5.2%/yr); 261 active listings in the ZIP; 13 comparable units currently listed for rent nearby; rentals leasing fast (median 8d on market — plan ~1-2 weeks tenant-placement turnaround); 2,676 units permitted in Pinellas County in 2024 (1,422 in 5+ unit buildings).
- This rent runs 31% of the median local income ($67k/yr) — at the standard rent-burdened threshold; future hikes will face affordability resistance.
Forward outlook
- Local home prices are declining (-3.0%/yr); year-one equity from $830 of loan paydown is wiped out by about $4k of value loss. Plan a longer hold.
- Pinellas County population projected at +14% by 2050 — modest demand growth; plan on rents tracking national, not racing it.
Negotiation context
- It's been on market 39 days — a 3% lower offer ($116k) is reasonable based on typical stale-listing flexibility.
- Current owner paid $55k; list at $120k implies a 118% gain — meaningful room to come down on a strong offer.
Risks & watch-outs
- Watch-outs: HOA is 27% of rent.
- Climate carrying-cost: severe wind risk, 99% chance of damaging wind over 30y; extreme-heat days projected 7→23/yr by 2055 (HVAC capex compounding) — expect insurance premiums to compound above CPI over the hold.
Questions for the listing agent
- It's been on market 39 days. Have you received any prior offers? Is the seller open to a 3% concession, seller financing, or rate buy-down credit?
- What does the HOA fee cover, when was the last increase, and are there any pending special assessments or reserve-fund shortfalls?
- Any open or pending special assessments — roof, HVAC, plumbing, elevator, façade? What's the per-unit balance and payoff schedule, and is the seller paying it off at close or rolling it to the buyer?
- Is there a deadline driving the sale (1031 exchange, divorce, estate, relocation)? That informs how much negotiation room exists.
- What's the average days-on-market for RENTAL listings here right now (not sales)? A rising rental-DOM trend means longer vacancies and softer asking-rent achievability than the comps imply.
- What's the recent tenant-quality profile in this submarket — average credit score on applications, eviction rate, late-payment / NSF rate, and stable-employment percentage? A property-management company in the area should have these aggregated.
- How much new apartment / multifamily construction is in the pipeline within 1–3 miles? Heavy new supply (>2% of stock underway) typically softens rents 12–24 months out; light construction supports rent growth.
Investment metrics
- 1% rule
- 1.44% ✓
- Cap rate
- 6.93%
- Cash-on-cash
- 2.27%
- DSCR
- 1.10
- GRM
- 5.8
CMA / ARV
No comps found within radius.
Projected returns pro-forma
-3.0% appreciation · 0.0% rent growth · sell at horizon
- IRR
- -17.7%
- Equity multiple
- 0.40×
- Total profit
- $-20,136
- Equity at exit
- $17,892
- IRR
- -22.9%
- Equity multiple
- 0.09×
- Total profit
- $-30,579
- Equity at exit
- $10,375
Cash invested: $33,600 (down + closing). Projections, not guarantees.
Landlord ↔ Tenant lean methodology
- Overall (STATE)
- 87 Strongly Landlord-Friendly
- State Florida
- 87 Strongly Landlord-Friendly · R+3
- County
- — inherits STATE
- City
- — inherits STATE
ZIP-level market 33764
- Rents YoY
- -5.2%
- Active inventory
- 261
- Price-to-rent
- 5.8×
Monthly cashflow live
- Estimated rent
- $1,725 high interval (Pro) →
- Mortgage (P&I)
- −$629
- Tax est. 1.5%
- −$150 /mo · $1,800/yr
- Insurance
- −$50
- HOA
- −$470
- Vacancy / Maint / Mgmt
- −$362
- Net cashflow
- $64
Break-even live
UW: 25.0% down · 7.5% · 30yr · 1.5% tax · 5.0% vac · 8.0% maint · 8.0% mgmt
Financing live
Cash to close
- Down payment
- $30,000
- Closing costs
- $3,600
- Reserves months
- —
- Total cash needed
- —
Loan-product check · same deal, 3 products live
Conventional
25% down · 7.5% · 30yr
- Down + closing
- —
- Monthly P&I
- —
- Monthly cashflow
- —
- DSCR
- —
- Eligible?
- —
Personal DTI + credit; lowest rate.
DSCR
20% down · 8.5% · 30yr
- Down + closing
- —
- Monthly P&I
- —
- Monthly cashflow
- —
- DSCR
- —
- Eligible?
- —
No personal income docs; deal must DSCR.
Hard money
10% down · 12.0% · 12mo
- Down + closing
- —
- Monthly P&I
- —
- Monthly cashflow
- —
- DSCR
- —
- Eligible?
- —
Short-term bridge; refi at stabilization.
Rent comps 13 comps
| Address | Beds | Baths | Sqft | Rent | $/sqft | DOM | Units | Dist |
|---|---|---|---|---|---|---|---|---|
| 16485 US Highway 19 N Clearwater, FL | 3.0 | 1.0–2.0 | 984 | $2,442 | $2.48 | 1d | 249 | 0.57mi |
| 16485 US Highway 19 N Clearwater, FL | 3.0 | 1.0–2.0 | 984 | $2,571 | $2.61 | 17d | 100 | 0.57mi |
| 4300 E Bay Dr Unit 228 Clearwater, FL | 1.0 | 1.0 | 520 | $1,399 | $2.69 | 24d | 1 | 0.63mi |
| 4215 E Bay Dr Clearwater, FL | 1.0 | 1.0 | 575 | $1,775 | $3.09 | 17d | 3 | 0.64mi |
| 4215 E Bay Dr Clearwater, FL | 1.0 | 1.0 | 535 | $2,300 | $4.30 | 7d | 4 | 0.64mi |
| 2770 Roosevelt Blvd Clearwater, FL | 1.0–2.0 | 1.0 | 795 | $1,374 | $1.73 | 14d | 10 | 0.68mi |
| 500 Belcher Rd S #18 Largo, FL | 1.0 | 1.0 | 637 | $1,500 | $2.35 | 3d | 1 | 0.93mi |
| 2166 Bradford St #125 Clearwater, FL | 1.0 | 1.0 | 480 | $1,250 | $2.60 | 4d | 1 | 0.99mi |
| 2166 Bradford St Clearwater, FL | 1.0 | 1.0 | 480 | $1,250 | $2.60 | 24d | 1 | 0.99mi |
| 2554 Oak Trl S Clearwater, FL | 1.0–2.0 | 1.0–2.0 | 862 | $1,415 | $1.64 | 2d | 14 | 1.01mi |
| 13500 Rodgers Ave Largo, FL | 1.0 | 1.0 | 700 | $1,474 | $2.11 | 1d | 5 | 1.30mi |
| 305 Glades Cir Largo, FL | 1.0–3.0 | 1.0–1.5 | 875 | $1,241 | $1.42 | 1d | 34 | 1.31mi |
| 15950 Bay Vista Dr Unit 207 Clearwater, FL | 1.0 | 1.0 | 565 | $1,700 | $3.01 | 7d | 1 | 1.38mi |
HOA detail condo
- Monthly dues
- $470 · $5,640/yr
- Likely covers
- water
- Assessments
- None detected in remarks — confirm with the listing agent.
Listing history 18 events
-
2026-06-18days on market $120,000 Active 39 DOM
-
2026-06-17days on market $120,000 Active 38 DOM
-
2026-06-16days on market $120,000 Active 37 DOM
-
2026-06-15days on market $120,000 Active 36 DOM
-
2026-06-13pricedays on market $120,000 Active 34 DOM
-
2026-06-09days on market $126,000 Active 30 DOM
-
2026-06-08days on market $126,000 Active 29 DOM
-
2026-06-07days on market $126,000 Active 28 DOM
-
2026-06-04days on market $126,000 Active 25 DOM
-
2026-06-03days on market $126,000 Active 24 DOM
-
2026-06-01days on market $126,000 Active 22 DOM
-
2026-05-31days on market $126,000 Active 21 DOM
-
2026-05-10$129,500 Active
-
2004-01-12soldstatus $55,000
-
1997-04-29soldstatus $28,500
-
1989-11-13soldstatus $36,500
-
1983-05-01soldstatus $39,000
-
1982-03-01soldstatus $33,000
ⓘ Source: listings_history table (triggers on properties + properties_extension) + one-shot
backfill from property_details.listing_events for pre-trigger history.
Climate risk First Street
- Flood 4/10 Moderate FEMA zone X (unshaded) · 23% chance over 30 yrs
- Wildfire 1/10 Low
- Heat 10/10 Extreme 7 d/yr ≥107°F today · 23 d/yr by 30 yrs out
- Wind 10/10 Extreme 99% chance of damaging wind over 30 yrs
- Air quality 3/10 Moderate 3 unhealthy d/yr today · 3 by 30 yrs out
Nearby sold comps map
Loading sold comps map…
Walkable amenities ~0.75 mi
Loading nearby amenities…
Taxation est. · year 1
- Rental income
- $20,702
- − Mortgage interest
- −$6,722
- − Property taxes
- −$1,800
- − Insurance
- −$600
- − Repairs & maintenance
- −$1,656
- − Management
- −$1,656
- − HOA
- −$5,640
- − Depreciation
- −$3,491
- Taxable loss
- −$863
- Est. tax savings @ 24.0%
- +$207
- After-tax cash flow
- $970/yr
For passive investors: Depreciation is non-cash, so a rental often shows a tax loss while cash-flowing — sheltering income. Rental losses are passive: they offset passive income freely, and up to $25,000/yr can offset ordinary (W-2) income if you actively participate and your MAGI is under $100k (phasing out to $0 by $150k); unused losses carry forward. On sale, claimed depreciation is recaptured at up to 25%, and gains may owe capital-gains tax (a 1031 exchange can defer both). Figures are a year-1 estimate at your 24.0% rate — not tax advice; consult a CPA.
Schools (NCES district)
- District
- Pinellas
- NCES district ID
- 1201560
- Math proficiency
- 51% ▼ -5.00%
- Reading proficiency
- 51% ▼ -3.00%
- Median HH income
- $46,270
- Composite
- 43.27/100
- National rank
- #3046
- State rank
- #31 of 73 in FL
Livability — Largo
- Score
- 82/100
- State rank
- #82
- US rank
- #1240
Category grades
Schools grade is shown separately in the Schools card above.
Census & demographics
- Census place
- Largo, FL
- County
- Pinellas County · 939,478 people
- City population
- 106,311
- Metro
- Tampa-St. Petersburg-Clearwater, FL
- Population (ZIP)
- 27,311
- Household income
- $67,256
- Rent vs Own
- Severe rent burden
- 1118.0
Population outlook (Pinellas County) Hauer SSP2
- Today (2025)
- 1,027,532 people
- By 2030
- 1,063,586 · +3.5%
- By 2040
- 1,125,020 · +9.5%
- By 2050
- 1,168,637 · +13.7%
- By 2075
- 1,265,188 · +23.1%
- By 2100
- 1,260,357 · +22.7%
Race, ethnicity, and origin ACS 2023
- Neighborhood character
- Predominantly White (76%)
- Race & ethnicity
- White 76% Hispanic / Latino 13% Two or more races 8% Asian 4% Black 2%
- Hispanic origin (detail)
- Mexican 2% Puerto Rican 3% Cuban 2%
- Common ancestry
- Romanian 4% Lithuanian 3% German 2%
- Foreign-born
- 14% · Canada, Jamaica, Vietnam
- Languages at home
- 80% English-only · Spanish 10% Russian/Polish/Slavic 4% Other Indo-European 2%
Political lean MEDSL · Pinellas
- 2024 margin
- Lean R (+5.2) · D 46.9% · R 52.1%
- 2008→2024 swing
- -13.5pp toward R · 2008: 8.3pp · 2024: -5.2pp
- All cycles
- 2024: R+5.2 2020: D+0.2 2016: R+1.1 2012: D+5.6 2008: D+8.3
Not yet ingested
- Civics
- —
Market trends
- HPI YoY
- ▼ -350.08%
- Current HPI
- 315.4133
- Rent YoY
- ▼ -5.24%
- Metro
- Tampa-St. Petersburg-Clearwater, FL
- State GDP YoY
- ▲ 3.28%
- F500 in state
- 36
Industry mix (Fortune 500 HQ in FL)
| Industry | F500 HQs | Revenue |
|---|---|---|
| Industrial Technology | 2 | $29B |
|
||
| Insurance | 2 | $17B |
|
||
| Retail | 1 | $60B |
|
||
| Technology Distribution | 1 | $58B |
|
||
| Homebuilding | 1 | $35B |
|
||
| Technology Manufacturing | 1 | $35B |
|
||
Price history
+292.4% since first listed6 events — show timeline
- 2026-05-10 Listed $129,500 Stellar MLS as Distributed by MLS Grid
- 2004-01-12 Sold (Public Records) $55,000 Public Records
- 1997-04-29 Sold (Public Records) $28,500 Public Records
- 1989-11-13 Sold (Public Records) $36,500 Public Records
- 1983-05-01 Sold (Public Records) $39,000 Public Records
- 1982-03-01 Sold (Public Records) $33,000 Public Records
Property tax history
-9.7%/yrLatest (2025): $142 · +16.4% YoY. Source: county tax records.
Cash-flow waterfall
monthlySold comps — $/sqft
last 12 mo · ≤1 miLoading sold comps…