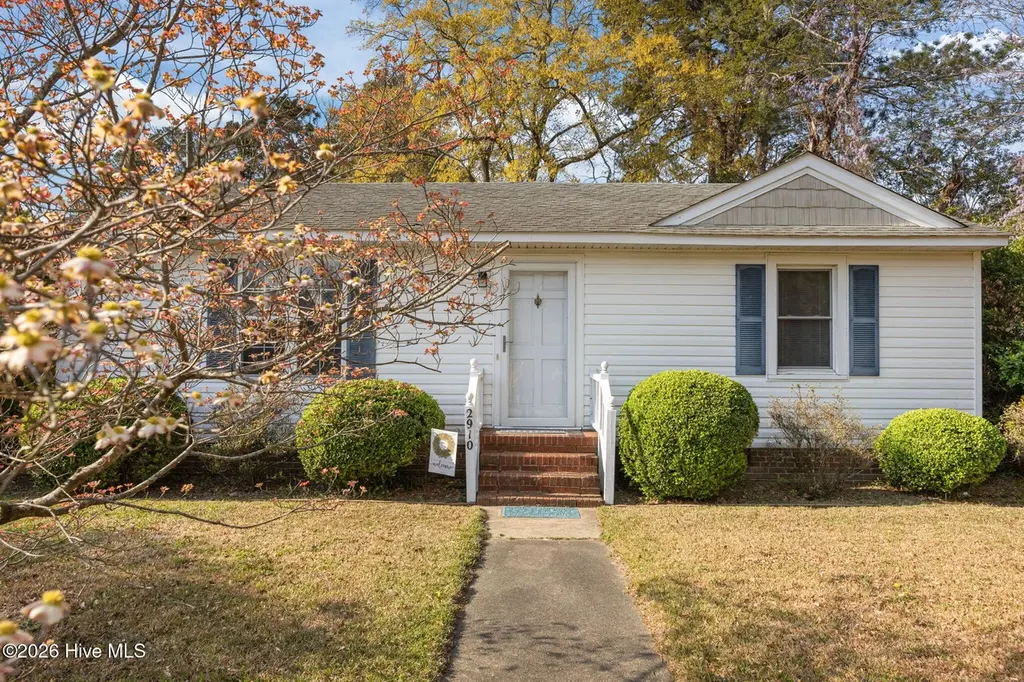
2910 Rose St · Greenville, NC
Flood risk 1/10 · Minimal
- FEMA flood zone
- X (unshaded)
- Chance of flooding over 30 yrs
- 0.0%
- Est. flood insurance / yr
- $507 – $1,088
Fire risk 1/10 · Minimal
- Est. fire insurance / yr
- $906 – $1,684
Heat risk 8/10 · Major
- Hot days now (above 107°F)
- 7 days/yr
- Hot days in 30 yrs
- 17 days/yr
Wind risk 8/10 · Major
- Chance of severe wind over 30 yrs
- 80.0%
Air-quality risk 3/10 · Minor
- Unhealthy air days now
- 2 days/yr
- Unhealthy air days in 30 yrs
- 3 days/yr
Risk factors via First Street. Map © Google.
Why this score? — see what drove the D+ grade
The composite is a weighted blend of 9 inputs, each scored 0–100. Each bar is that input's sub-score; the figure is the points it added to the 100-point composite (weight × sub-score).
- Cash flow +13.0/30.0
- ARV discount +12.2/15.0
- DSCR +3.9/10.0
- Livability +3.9/5.0
- Rent growth +3.8/5.0
- Schools +3.6/10.0
- 1% rule +3.1/10.0
- Condition / age +2.5/5.0
- Appreciation +0.0/10.0
$175,000
🖨 Deal sheet 📄 Offer letter ✓ Due diligence
Listing remarks
Welcome to 2910 Rose Street! Nestled in the heart of Greenville, this home offers a convenient location close to East Carolina University, the hospital, shopping, and restaurants. Featuring 3 bedrooms, 2 full bathrooms, and a cozy family room. The kitchen provides ample cabinet space along with a breakfast nook. Step outside to enjoy the spacious deck overlooking the fenced-in backyard, ideal for entertaining and pets. A detached one-car garage adds additional storage and convenience. Crawlspace repairs have been completed and new ductwork installed beneath the home. Call today for your private showing!
Key facts
- New ductwork
- Spacious deck
- Convenient location
Tags
Property features AI
Exterior
- Parking: Paved parking; 1 total parking space; 1-car garage
- Utilities: Public water; Sewer available; Water available
- Home design: Single-family residence; One-level / single-story; Entry level: 1
- Construction: Vinyl siding and frame construction
- Exterior features: Deck; Back yard fencing; Shingle roof; Storage structure; Public road is paved; Has a view
Interior
- Kitchen: Electric oven; Dishwasher; Microwave
- Bathrooms: 2 full bathrooms
- Heating & cooling: Central air conditioning; Electric heating; Heat pump; Natural gas heating
- Interior features: Ceiling fans; Window coverings; Crawl space basement
Neighborhood map
What this means for you Summary
Snapshot
- This is a 3-bed/1.0-bath single-family listed at $175k.
Deal economics
- At list price, monthly cash flow is $-9 ($-110/yr) — negative.
- To cash-flow at today's rent, offer at most $173k (0.9% below list).
- To meet the 1% rule (rent ≥ 1% of price), the offer needs to be $142k (18.7% below list).
- Recommended offer: $142k (18.7% below list) — sets the bar for 1% rule.
- Cap rate 6.2% vs local median 3.8% in Greenville — top-decile yield for the area; either an underpriced asset or a hidden risk that comps aren't pricing in. Stress-test before assuming the spread holds.
Location & tenants
- Location reads 77/100 on livability (#30 in NC, #2,977 nationally) — a middle-class / working-renter tenant base. Strengths: commute A+, cost of living A+, health & safety A+; Watch: crime F, employment F.
- Pitt County Schools (rural): math 41% / reading 44% proficiency, ranked #100 of 178 in NC (top 56%) — families likely to look elsewhere, expect single-tenant / working-renter base with shorter leases.
- Zoned schools: Eastern Elementary (math 48% / reading 50%, grade D, #459 of 1,410 statewide, top 33%, 768 students, 65% FRL); C M Eppes Middle (math 24% / reading 32%, grade F, #360 of 475 statewide, top 77%, 626 students, 99% FRL); Junius H Rose High (math 52% / reading 61%, grade C, #261 of 535 statewide, top 49%, 1,525 students, 50% FRL) — zoned schools average 71% FRL vs 56% district-wide (15 pts higher); higher-poverty schools than district average — tighter screening recommended.
- Market conditions: Rents rising fast (+5.3%/yr); 291 active listings in the ZIP; 17 comparable units currently listed for rent nearby; rentals at typical pace (median 21d on market — plan ~3-4 weeks tenant-placement turnaround); 1,300 units permitted in Pitt County in 2024 (204 in 5+ unit buildings).
Forward outlook
- Local home prices are declining (-3.0%/yr); year-one equity from $1k of loan paydown is wiped out by about $5k of value loss. Plan a longer hold.
- Pitt County population projected at +22% by 2050 — long-run rental-demand tailwind backs the buy-and-hold thesis.
Negotiation context
- Only 2 days on market — expect competitive offers; lowballing is unlikely to land.
- Current owner paid $134k; 31% above their basis — modest negotiation headroom, anchor on the comps not their cost.
Risks & watch-outs
- Watch-outs: built in 1955 — expect roof / HVAC / electrical / plumbing capex.
- Climate carrying-cost: severe wind risk, 80% chance of damaging wind over 30y; extreme-heat days projected 7→17/yr by 2055 (HVAC capex compounding) — expect insurance premiums to compound above CPI over the hold.
Questions for the listing agent
- What do current leases actually rent for vs. the listed asking? Can we see a recent rent roll and the last 12 months of T-12 income?
- Built in 1955 — when were the roof, HVAC, electrical panel, plumbing, and water heater last replaced?
- Is there a deadline driving the sale (1031 exchange, divorce, estate, relocation)? That informs how much negotiation room exists.
- Crime grade is F in this area — have there been break-ins, vandalism, or insurance claims at this property in the last 3 years? What carrier currently insures it and at what premium?
- The area grade is low — what's the realistic commute time and amenity access for the typical tenant pool here? Any planned neighborhood developments (good or bad) we should know about?
- What's the average days-on-market for RENTAL listings here right now (not sales)? A rising rental-DOM trend means longer vacancies and softer asking-rent achievability than the comps imply.
- What's the recent tenant-quality profile in this submarket — average credit score on applications, eviction rate, late-payment / NSF rate, and stable-employment percentage? A property-management company in the area should have these aggregated.
- How much new for-sale + rental construction is in the pipeline within 1–3 miles? Heavy new supply typically softens prices + rents 12–24 months out; constrained supply supports both.
Investment metrics
- 1% rule
- 0.81% ✗
- Cap rate
- 6.23%
- Cash-on-cash
- -0.22%
- DSCR
- 0.99
- GRM
- 10.2
CMA / ARV
- ARV (on-the-fly)
- $195,360
- Comps found
- 12
Show comp detail 12 sales within ~0.75 mi
| Address | Dist | Beds/Ba | Sqft | Sold | Price | $/sf | Match |
|---|---|---|---|---|---|---|---|
| 111 Alexander Cir | 0.17mi | 3/1.5 | 1,250 (-5%) | 0mo | $182,000 | $146 | 81 |
| 2804 Crockett Dr | 0.08mi | 3/2.0 | 1,350 (+2%) | 12mo | $176,250 | $131 | 79 |
| 103 John Ave | 0.18mi | 3/2.0 | 1,288 (-2%) | 6mo | $160,000 | $124 | 78 |
| 2304 Jefferson Dr | 0.25mi | 3/1.5 | 1,275 (-3%) | 9mo | $172,000 | $135 | 73 |
| 2815 Edwards St | 0.16mi | 3/2.0 | 1,393 (+6%) | 8mo | $163,500 | $117 | 73 |
| 2704 Tryon Dr | 0.13mi | 3/1.5 | 1,216 (-8%) | 10mo | $180,000 | $148 | 70 |
| 1310 Cotten Rd | 0.53mi | 3/1.0 | 1,364 (+3%) | 1mo | $208,000 | $152 | 69 |
| 109 John Ave | 0.17mi | 3/2.0 | 1,489 (+13%) | 4mo | $260,000 | $175 | 63 |
| 2603 Jackson Dr | 0.28mi | 3/2.0 | 1,150 (-13%) | 1mo | $195,000 | $170 | 61 |
| 110 Fletcher Pl | 0.51mi | 3/2.0 | 1,215 (-8%) | 1mo | $224,900 | $185 | 58 |
| 1306 Cotten Rd | 0.53mi | 3/1.0 | 1,153 (-13%) | 9mo | $183,475 | $159 | 47 |
| 1118 B Brownlea Dr | 0.67mi | 3/4.0 | 1,382 (+5%) | 12mo | $192,500 | $139 | 39 |
Match score weights: distance 35% · size 25% · config 20% · recency 20%. Top-matched comps best support the ARV.
Projected returns pro-forma
-3.0% appreciation · 5.28% rent growth · sell at horizon
- IRR
- -14.3%
- Equity multiple
- 0.48×
- Total profit
- $-25,624
- Equity at exit
- $26,093
- IRR
- -2.4%
- Equity multiple
- 0.82×
- Total profit
- $-8,802
- Equity at exit
- $15,131
Cash invested: $49,000 (down + closing). Projections, not guarantees.
Landlord ↔ Tenant lean methodology
- Overall (STATE)
- 85 Strongly Landlord-Friendly
- State North Carolina
- 85 Strongly Landlord-Friendly · R+3
- County
- — inherits STATE
- City
- — inherits STATE
ZIP-level market 27858
- Rents YoY
- 5.3%
- Active inventory
- 291
- Price-to-rent
- 10.2×
Monthly cashflow live
- Estimated rent
- $1,424 high interval (Pro) →
- Mortgage (P&I)
- −$918
- Tax from tax record
- −$143 /mo · $1,718/yr
- Insurance
- −$73
- HOA
- −$0
- Vacancy / Maint / Mgmt
- −$299
- Net cashflow
- $-9
Break-even live
UW: 25.0% down · 7.5% · 30yr · 1.5% tax · 5.0% vac · 8.0% maint · 8.0% mgmt
Financing live
Cash to close
- Down payment
- $43,750
- Closing costs
- $5,250
- Reserves months
- —
- Total cash needed
- —
Loan-product check · same deal, 3 products live
Conventional
25% down · 7.5% · 30yr
- Down + closing
- —
- Monthly P&I
- —
- Monthly cashflow
- —
- DSCR
- —
- Eligible?
- —
Personal DTI + credit; lowest rate.
DSCR
20% down · 8.5% · 30yr
- Down + closing
- —
- Monthly P&I
- —
- Monthly cashflow
- —
- DSCR
- —
- Eligible?
- —
No personal income docs; deal must DSCR.
Hard money
10% down · 12.0% · 12mo
- Down + closing
- —
- Monthly P&I
- —
- Monthly cashflow
- —
- DSCR
- —
- Eligible?
- —
Short-term bridge; refi at stabilization.
Rent comps 17 comps
| Address | Beds | Baths | Sqft | Rent | $/sqft | DOM | Units | Dist |
|---|---|---|---|---|---|---|---|---|
| 204 Eastbrook Dr Greenville, NC | 2.0 | 1.0–1.5 | 882 | $935 | $1.06 | 21d | 2 | 0.42mi |
| 3002 Kingston Cir Greenville, NC | 1.0–2.0 | 1.0–1.5 | 799 | $1,250 | $1.56 | 21d | 1 | 0.45mi |
| 2414 Slay Dr Greenville, NC | 3.0 | 1.0 | 1372 | $1,650 | $1.20 | 21d | 1 | 0.46mi |
| 2201 E 10th St Greenville, NC | 2.0 | 1.0 | 1000 | $875 | $0.88 | 21d | 1 | 0.56mi |
| 100 David Dr Unit E6 Greenville, NC | 3.0 | 2.5 | 1492 | $1,450 | $0.97 | 13d | 1 | 0.61mi |
| 1119 Brownlea Dr Greenville, NC | 3.0 | 3.0 | 1382 | $1,600 | $1.16 | 21d | 1 | 0.63mi |
| 2631 Cypress View Dr Greenville, NC | 3.0 | 3.0 | 1354 | $1,178 | $0.87 | 21d | 1 | 0.65mi |
| 334 Brownlea Dr Unit 6G Greenville, NC | 3.0 | 3.0 | 1205 | $1,095 | $0.91 | 13d | 1 | 0.87mi |
| 330 Brownlea Dr Unit 5F Greenville, NC | 3.0 | 3.0 | 1205 | $1,095 | $0.91 | 13d | 1 | 0.87mi |
| 2235 Locksley Woods Dr Unit E Greenville, NC | 3.0 | 2.0 | 1546 | $1,600 | $1.03 | 21d | 1 | 0.94mi |
| 2225 Locksley Woods Dr Unit C Greenville, NC | 2.0 | 2.0 | 1367 | $1,450 | $1.06 | 21d | 1 | 0.98mi |
| 205 Wyndham Cir Unit B Greenville, NC | 2.0 | 2.0 | 940 | $1,045 | $1.11 | 21d | 1 | 1.18mi |
| 3535 E 10th St Greenville, NC | 3.0–4.0 | 2.0–3.0 | 1280 | $1,350 | $1.05 | 13d | 1 | 1.20mi |
| 301 Maple St Greenville, NC | 3.0 | 2.0 | 1230 | $1,800 | $1.46 | 21d | 1 | 1.22mi |
| 114 N Meade St Unit B Greenville, NC | 3.0 | 1.5 | 931 | $1,350 | $1.45 | 21d | 1 | 1.37mi |
| 1798 Scarborough Rd Greenville, NC | 3.0 | 2.0 | 1208 | $1,800 | $1.49 | 21d | 1 | 1.40mi |
| 115 Stancill Dr Unit B Greenville, NC | 3.0 | 1.0 | 1090 | $1,500 | $1.38 | 21d | 1 | 1.42mi |
Listing history 3 events
-
2026-05-23status Pending
-
2026-05-20$175,000 Active
-
2007-05-01soldstatus $134,000
ⓘ Source: listings_history table (triggers on properties + properties_extension) + one-shot
backfill from property_details.listing_events for pre-trigger history.
Tax reassessment forecast NC · Resets to sale price
- Current annual tax
- $1,718 · $143/mo
- Projected year-2 tax
- $1,718 · $143/mo
- Expected delta
- $0/yr ($0/mo · 0.0%)
ⓘ Screening estimate from a state-policy table — verify with the county assessor before closing.
Climate risk First Street
- Flood 1/10 Low FEMA zone X (unshaded) · 0% chance over 30 yrs
- Wildfire 1/10 Low
- Heat 8/10 Severe 7 d/yr ≥107°F today · 17 d/yr by 30 yrs out
- Wind 8/10 Severe 80% chance of damaging wind over 30 yrs
- Air quality 3/10 Moderate 2 unhealthy d/yr today · 3 by 30 yrs out
Nearby sold comps map
Loading sold comps map…
Walkable amenities ~0.75 mi
Loading nearby amenities…
Taxation est. · year 1
- Rental income
- $17,083
- − Mortgage interest
- −$9,803
- − Property taxes
- −$1,718
- − Insurance
- −$875
- − Repairs & maintenance
- −$1,367
- − Management
- −$1,367
- − Depreciation
- −$5,091
- Taxable loss
- −$3,136
- Est. tax savings @ 24.0%
- +$753
- After-tax cash flow
- $643/yr
For passive investors: Depreciation is non-cash, so a rental often shows a tax loss while cash-flowing — sheltering income. Rental losses are passive: they offset passive income freely, and up to $25,000/yr can offset ordinary (W-2) income if you actively participate and your MAGI is under $100k (phasing out to $0 by $150k); unused losses carry forward. On sale, claimed depreciation is recaptured at up to 25%, and gains may owe capital-gains tax (a 1031 exchange can defer both). Figures are a year-1 estimate at your 24.0% rate — not tax advice; consult a CPA.
Schools (NCES district)
- District
- Pitt County Schools
- NCES district ID
- 3700012
- Math proficiency
- 41% ▬ 0.00%
- Reading proficiency
- 44% ▲ 2.00%
- Median HH income
- $40,631
- Composite
- 35.67/100
- National rank
- #4877
- State rank
- #100 of 178 in NC
Livability — Greenville
- Score
- 77/100
- State rank
- #30
- US rank
- #2977
Category grades
Schools grade is shown separately in the Schools card above.
Census & demographics
- Census place
- Greenville, NC
- County
- Pitt County · 142,592 people
- City population
- 115,121
- Metro
- Greenville, NC
- Population (ZIP)
- 58,774
- Household income
- $59,713
- Rent vs Own
- Severe rent burden
- 4499.0
Population outlook (Pitt County) Hauer SSP2
- Today (2025)
- 194,585 people
- By 2030
- 203,756 · +4.7%
- By 2040
- 220,807 · +13.5%
- By 2050
- 236,614 · +21.6%
- By 2075
- 275,940 · +41.8%
- By 2100
- 300,058 · +54.2%
Race, ethnicity, and origin ACS 2023
- Neighborhood character
- Predominantly White (67%)
- Race & ethnicity
- White 67% Black 20% Hispanic / Latino 6% Two or more races 5% Asian 2%
- Hispanic origin (detail)
- Mexican 4% Puerto Rican 1%
- Common ancestry
- Serbian 3% Italian 2% Slovak 2%
- Foreign-born
- 5% · Canada, South Korea
- Languages at home
- 93% English-only · Spanish 5% Other Asian/Pacific 1%
Political lean MEDSL · Pitt
- 2024 margin
- Lean D (+6.0) · D 52.5% · R 46.5% · Other 1.1%
- 2008→2024 swing
- -2.8pp toward R · 2008: 8.8pp · 2024: 6.0pp
- All cycles
- 2024: D+6.0 2020: D+9.4 2016: D+7.4 2012: D+6.7 2008: D+8.8
Not yet ingested
- Civics
- —
Market trends
- HPI YoY
- ▼ -217.60%
- Current HPI
- 175.2236
- Rent YoY
- ▲ 5.28%
- Metro
- Greenville, NC
- State GDP YoY
- ▲ 3.28%
- F500 in state
- 26
Industry mix (Fortune 500 HQ in NC)
| Industry | F500 HQs | Revenue |
|---|---|---|
| Financial Services | 2 | $213B |
|
||
| Retail | 2 | $95B |
|
||
| Industrial Conglomerate | 1 | $38B |
|
||
| Metals / Steel | 1 | $35B |
|
||
| Utilities | 1 | $30B |
|
||
| Industrial Machinery | 1 | $19B |
|
||
Price history
+30.6% since first listed3 events — show timeline
- 2026-05-23 Pending — Hive MLS
- 2026-05-20 Listed $175,000 Hive MLS
- 2007-05-01 Sold (Public Records) $134,000 Public Records
Property tax history
+3.1%/yrLatest (2025): $1,718 · +0.7% YoY. Source: county tax records.
Cash-flow waterfall
monthlySold comps — $/sqft
last 12 mo · ≤1 miLoading sold comps…