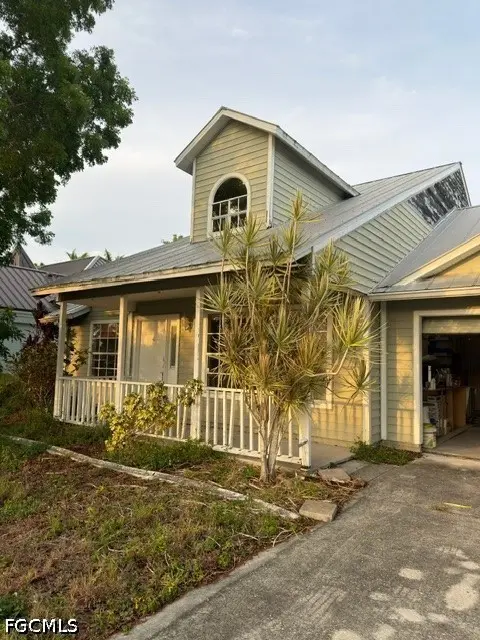
2121 SW 11th Ct · Cape Coral, FL
Flood risk 7/10 · Major
- FEMA flood zone
- X (shaded)
- Chance of flooding over 30 yrs
- 0.75%
- Est. flood insurance / yr
- $507 – $1,088
Fire risk 1/10 · Minimal
- Est. fire insurance / yr
- $947 – $1,759
Heat risk 10/10 · Severe
- Hot days now (above 107°F)
- 6 days/yr
- Hot days in 30 yrs
- 24 days/yr
Wind risk 10/10 · Severe
- Chance of severe wind over 30 yrs
- 99.0%
Air-quality risk 2/10 · Minimal
- Unhealthy air days now
- 1 days/yr
- Unhealthy air days in 30 yrs
- 1 days/yr
Risk factors via First Street. Map © Google.
Why this score? — see what drove the C- grade
The composite is a weighted blend of 9 inputs, each scored 0–100. Each bar is that input's sub-score; the figure is the points it added to the 100-point composite (weight × sub-score).
- Cash flow +16.2/30.0
- ARV discount +15.0/15.0
- 1% rule +5.3/10.0
- DSCR +5.0/10.0
- Schools +4.1/10.0
- Livability +3.9/5.0
- Condition / age +2.5/5.0
- Rent growth +0.4/5.0
- Appreciation +0.0/10.0
$230,000
🖨 Deal sheet (PDF) 📄 Offer letter ✓ Due diligence
Listing remarks MLS
Affordable ownership-built in 1991 with 1983 sq ft under air (per property appraiser), 3 bedrooms and 2 baths, and serviced by city water (no assessments per city of Cape Coral) and septic tank. Bank Owned, sold as-is, Special Addenda, and solid prequalification letter or proof of cash needed with all offers. Buyer to pay doc stamps on deed. This is NOT a short sale. .fast response seller. Don't miss it!
Key facts
- Screened pool area
- Metal roof
- 0.23 acre lot
Tags
Property features AI
Finance
- Other: Zoning: R1-D
- Financial info: Pets allowed
- HOA & community: No association fee
Exterior
- Parking: Attached 2-car garage; Driveway; Paved parking
- Utilities: Water assessment unpaid; Sewer assessment paid; Cable not available
- Home design: Two-story home; Faces southeast; Resale property
- Construction: Wood siding and wood frame construction; Metal roof
- Exterior features: Private in-ground pool with screen enclosure; Rectangular lot; Paved public road access; Northwest exposure; Lot dimensions approximately 80 x 125
Interior
- Bedrooms: Upper level primary
- Flooring: Tile flooring
- Bathrooms: 2 full bathrooms
- Interior features: Unfurnished; Upper level primary bedroom; Split bedrooms layout; Other rooms include a great room and additional other room
Neighborhood map
What this means for you Summary
Snapshot
- This is a 3-bed/2.0-bath single-family listed at $230k.
Deal economics
- At list price, monthly cash flow is $54 ($652/yr) — positive.
- The deal already cash-flows at list — no discount required.
- Meets the 1% rule at list price ($2k rent vs $230k).
- Cap rate 6.9% vs local median 3.1% in Cape Coral — top-decile yield for the area; either an underpriced asset or a hidden risk that comps aren't pricing in. Stress-test before assuming the spread holds.
Location & tenants
- Location reads 77/100 on livability (#208 in FL, #3,098 nationally) — a middle-class / working-renter tenant base. Strengths: housing A+, health & safety A+, amenities B+; Watch: commute F.
- Lee (suburban): math 47% / reading 50% proficiency, ranked #42 of 73 in FL (top 58%) — families likely to look elsewhere, expect single-tenant / working-renter base with shorter leases.
- Zoned schools: Gulf Elementary School (math 70% / reading 65%, grade B+, #435 of 2,144 statewide, top 21%, 1,231 students, 38% FRL); Challenger Middle School (math 59% / reading 56%, grade B, #157 of 571 statewide, top 28%, 1,124 students, 50% FRL); Ida S. Baker High School (math 44% / reading 47%, grade D-, #223 of 667 statewide, top 34%, 1,933 students, 39% FRL) — zoned schools average 42% FRL vs 57% district-wide (15 pts lower); this property's tenant base skews higher-income than the district average.
- Market conditions: Rents falling (-8.6%/yr); 691 active listings in the ZIP; 40 comparable units currently listed for rent nearby; rentals at typical pace (median 26d on market — plan ~3-4 weeks tenant-placement turnaround); solid renter incomes; 15,411 units permitted in Lee County in 2024 (4,686 in 5+ unit buildings).
- This rent runs 34% of the median local income ($84k/yr) — at the standard rent-burdened threshold; future hikes will face affordability resistance.
Forward outlook
- Local home prices are declining (-3.0%/yr); year-one equity from $2k of loan paydown is wiped out by about $7k of value loss. Plan a longer hold.
- Lee County population projected at +44% by 2050 — long-run rental-demand tailwind backs the buy-and-hold thesis.
Negotiation context
- Only 1 days on market — expect competitive offers; lowballing is unlikely to land.
- 5 sale attempts since 2y ago with the ask held roughly flat each time — persistent listings suggest the price (not the market) is what's stuck; bring a comps-based counter.
Risks & watch-outs
- Watch-outs: flood insurance adds $66/mo.
- Climate carrying-cost: major flood risk; severe wind risk, 99% chance of damaging wind over 30y; extreme-heat days projected 6→24/yr by 2055 (HVAC capex compounding) — expect insurance premiums to compound above CPI over the hold.
Questions for the listing agent
- What's the actual annual flood-insurance premium (NFIP or private), and is the property in a SFHA with mandatory coverage?
- Is there a deadline driving the sale (1031 exchange, divorce, estate, relocation)? That informs how much negotiation room exists.
- Schools are B-rated — typically a magnet for longer-tenancy family renters. What's the average tenant stay here, and is there a school-zone premium baked into asking?
- What's the average days-on-market for RENTAL listings here right now (not sales)? A rising rental-DOM trend means longer vacancies and softer asking-rent achievability than the comps imply.
- What's the recent tenant-quality profile in this submarket — average credit score on applications, eviction rate, late-payment / NSF rate, and stable-employment percentage? A property-management company in the area should have these aggregated.
- How much new for-sale + rental construction is in the pipeline within 1–3 miles? Heavy new supply typically softens prices + rents 12–24 months out; constrained supply supports both.
Investment metrics
- 1% rule
- 1.03% ✓
- Cap rate
- 6.92%
- Cash-on-cash
- 2.25%
- DSCR
- 1.10
- GRM
- 8.1
CMA / ARV
- ARV (on-the-fly)
- $447,554
- Comps found
- 12
Show comp detail 12 sales within ~0.75 mi
| Address | Dist | Beds/Ba | Sqft | Sold | Price | $/sf | Match |
|---|---|---|---|---|---|---|---|
| 1204 SW 19th Ln | 0.27mi | 3/2.0 | 2,017 (-2%) | 10mo | $440,000 | $218 | 76 |
| 1213 SW 24th St | 0.31mi | 3/3.0 | 2,121 (+3%) | 3mo | $625,000 | $295 | 73 |
| 2218 SW 15th Ave | 0.41mi | 4/3.0 (+1) | 2,028 (-1%) | 1mo | $575,000 | $284 | 69 |
| 1121 SW 25th St | 0.42mi | 4/2.0 (+1) | 1,980 (-4%) | 1mo | $335,000 | $169 | 69 |
| 1309 SW 18th St | 0.55mi | 3/2.0 | 1,876 (-9%) | 1mo | $300,000 | $160 | 59 |
| 629 SW 22nd St | 0.63mi | 3/2.0 | 1,872 (-9%) | 1mo | $395,000 | $211 | 55 |
| 2721 SW 11th Ct | 0.74mi | 4/3.0 (+1) | 2,020 (-2%) | 0mo | $395,000 | $196 | 54 |
| 2228 SW 12th Ave | 0.20mi | 4/2.0 (+1) | 1,798 (-12%) | 14mo | $525,000 | $292 | 53 |
| 2236 SW 11th Ct | 0.21mi | 3/2.5 | 1,823 (-11%) | 22mo | $499,900 | $274 | 51 |
| 860 SW 18th Ter | 0.48mi | 3/2.0 | 1,799 (-12%) | 12mo | $325,000 | $181 | 47 |
| 832 SW 23rd St | 0.42mi | 3/2.0 | 1,747 (-15%) | 13mo | $385,000 | $220 | 45 |
| 1625 SW 10th Ave | 0.66mi | 4/2.0 (+1) | 1,834 (-11%) | 14mo | $390,000 | $213 | 35 |
Match score weights: distance 35% · size 25% · config 20% · recency 20%. Top-matched comps best support the ARV.
Projected returns pro-forma
-3.0% appreciation · 0.0% rent growth · sell at horizon
- IRR
- -18.5%
- Equity multiple
- 0.37×
- Total profit
- $-40,587
- Equity at exit
- $34,294
- IRR
- -19.8%
- Equity multiple
- 0.11×
- Total profit
- $-57,044
- Equity at exit
- $19,886
Cash invested: $64,400 (down + closing). Projections, not guarantees.
Landlord ↔ Tenant lean methodology
- Overall (STATE)
- 87 Strongly Landlord-Friendly
- State Florida
- 87 Strongly Landlord-Friendly · R+3
- County
- — inherits STATE
- City
- — inherits STATE
ZIP-level market 33991
- Home prices YoY
- -27.8%
- Rents YoY
- -8.6%
- Active inventory
- 691
- Price-to-rent
- 8.1×
Monthly cashflow live
- Estimated rent
- $2,373 high interval (Pro) →
- Mortgage (P&I)
- −$1,206
- Tax from tax record
- −$452 /mo · $5,424/yr
- Insurance
- −$96
- Flood insurance flood zone
- −$66 /mo · $798/yr
- HOA
- −$0
- Vacancy / Maint / Mgmt
- −$498
- Net cashflow
- $54
Break-even live
Sensitivity live
| Price | -10% $185 | -5% $119 | +0% $54 | +5% $-11 | +10% $-76 |
|---|---|---|---|---|---|
| Rent | -10% $-133 | -5% $-39 | +0% $54 | +5% $148 | +10% $242 |
| Rate | -1.0pp $170 | -0.5pp $113 | base $54 | +0.5pp $-5 | +1.0pp $-66 |
UW: 25.0% down · 7.5% · 30yr · 1.5% tax · 5.0% vac · 8.0% maint · 8.0% mgmt
Financing live
Cash to close
- Down payment
- $57,500
- Closing costs
- $6,900
- Reserves months
- —
- Total cash needed
- —
Loan-product check · same deal, 3 products live
Conventional
25% down · 7.5% · 30yr
- Down + closing
- —
- Monthly P&I
- —
- Monthly cashflow
- —
- DSCR
- —
- Eligible?
- —
Personal DTI + credit; lowest rate.
DSCR
20% down · 8.5% · 30yr
- Down + closing
- —
- Monthly P&I
- —
- Monthly cashflow
- —
- DSCR
- —
- Eligible?
- —
No personal income docs; deal must DSCR.
Hard money
10% down · 12.0% · 12mo
- Down + closing
- —
- Monthly P&I
- —
- Monthly cashflow
- —
- DSCR
- —
- Eligible?
- —
Short-term bridge; refi at stabilization.
Rent comps 40 comps
| Address | Beds | Baths | Sqft | Rent | $/sqft | DOM | Units | Dist |
|---|---|---|---|---|---|---|---|---|
| 902 SW 21st Ln Cape Coral, FL | 3.0 | 2.0 | 1656 | $1,795 | $1.08 | 13d | 1 | 0.28mi |
| 1408 SW 23rd St Cape Coral, FL | 3.0 | 2.5 | 1901 | $3,500 | $1.84 | 16d | 1 | 0.36mi |
| 916 SW 24th St Cape Coral, FL | 4.0 | 2.0 | 2260 | $2,749 | $1.22 | 25d | 1 | 0.39mi |
| 2112 SW 8th Pl Cape Coral, FL | 3.0 | 2.0 | 1580 | $2,100 | $1.33 | 25d | 1 | 0.43mi |
| 1713 SW 10th Pl Cape Coral, FL | 3.0 | 2.0 | 1704 | $1,850 | $1.09 | 25d | 1 | 0.58mi |
| 1710 SW 10th Pl Cape Coral, FL | 3.0 | 2.0 | 1993 | $1,999 | $1.00 | 16d | 1 | 0.59mi |
| 2705 SW 11th Pl Cape Coral, FL | 3.0 | 2.0 | 1557 | $6,500 | $4.17 | 25d | 1 | 0.66mi |
| 626 SW 22nd Ter Cape Coral, FL | 3.0 | 2.0 | 1629 | $1,725 | $1.06 | 5d | 1 | 0.67mi |
| 614 SW 22nd Ter Cape Coral, FL | 3.0 | 2.0 | 2017 | $1,881 | $0.93 | 25d | 1 | 0.71mi |
| 1206 SW Trafalgar Pkwy Cape Coral, FL | 3.0 | 2.0 | 1522 | $2,150 | $1.41 | 25d | 1 | 0.72mi |
| 1228 Trafalgar Pkwy Unit 1228 Cape Coral, FL | 3.0 | 2.0 | 1623 | $1,500 | $0.92 | 25d | 1 | 0.74mi |
| 2613 SW 15th Ave Cape Coral, FL | 3.0 | 2.0 | 1849 | $2,375 | $1.28 | 5d | 1 | 0.74mi |
| 2613 SW 15th Ave Cape Coral, FL | 3.0 | 2.0 | 1849 | $2,375 | $1.28 | 17d | 1 | 0.74mi |
| 625 SW 25th Ter Cape Coral, FL | 3.0 | 2.0 | 1756 | $2,296 | $1.31 | 5d | 1 | 0.77mi |
| 1627 SW 25th Ln Cape Coral, FL | 4.0 | 2.0 | 1828 | $1,861 | $1.02 | 5d | 1 | 0.78mi |
| 1405 SW Trafalgar Pkwy Cape Coral, FL | 4.0 | 2.5 | 2100 | $2,395 | $1.14 | 5d | 1 | 0.81mi |
| 1325 SW 28th St Cape Coral, FL | 3.0 | 2.5 | 1527 | $2,500 | $1.64 | 25d | 1 | 0.82mi |
| 1815 SW 22nd St Cape Coral, FL | 4.0 | 2.0 | 1845 | $4,095 | $2.22 | 25d | 1 | 0.85mi |
| 1817 SW 22nd Ln Cape Coral, FL | 4.0 | 3.0 | 3000 | $3,100 | $1.03 | 23d | 1 | 0.86mi |
| 1622 SW 16th Ct Cape Coral, FL | 3.0 | 2.0 | 1789 | $2,200 | $1.23 | 25d | 1 | 0.89mi |
| 2227 SW 5th Ave Cape Coral, FL | 3.0 | 2.0 | 1485 | $2,000 | $1.35 | 5d | 1 | 0.90mi |
| 1704 SW 17th Ave Cape Coral, FL | 3.0 | 3.0 | 2140 | $8,000 | $3.74 | 25d | 1 | 0.91mi |
| 1203 SW 29th St Cape Coral, FL | 4.0 | 2.0 | 1829 | $2,326 | $1.27 | 5d | 1 | 0.92mi |
| 604 SW 26th St Cape Coral, FL | 3.0 | 2.0 | 1684 | $1,950 | $1.16 | 17d | 1 | 0.92mi |
| 604 SW 26th St Cape Coral, FL | 3.0 | 2.0 | 1684 | $2,199 | $1.31 | 25d | 1 | 0.92mi |
| 1510 SW 8th Pl Cape Coral, FL | 3.0 | 2.0 | 1524 | $2,400 | $1.57 | 3d | 1 | 0.94mi |
| 2305 SW 19th Pl Cape Coral, FL | 3.0 | 2.0 | 1521 | $4,975 | $3.27 | 25d | 1 | 0.95mi |
| 1409 SW 11th Pl Cape Coral, FL | 4.0 | 2.0 | 1499 | $1,790 | $1.19 | 23d | 1 | 0.96mi |
| 627 SW 27th Ter Cape Coral, FL | 3.0 | 2.0 | 1756 | $2,015 | $1.15 | 3d | 1 | 0.96mi |
| 1825 SW 25th St Cape Coral, FL | 3.0 | 2.0 | 1785 | $1,950 | $1.09 | 5d | 1 | 0.97mi |
| 1137 SW 29th Ter Cape Coral, FL | 4.0 | 3.0 | 1850 | $3,100 | $1.68 | 3d | 1 | 0.97mi |
| 1428 SW 29th St Cape Coral, FL | 3.0 | 2.0 | 1455 | $1,750 | $1.20 | 25d | 1 | 1.02mi |
| 1923 SW 26th St Cape Coral, FL | 4.0 | 2.0 | 2167 | $8,500 | $3.92 | 25d | 1 | 1.11mi |
| 1919 SW 26th Ter Cape Coral, FL | 4.0 | 3.0 | 2668 | $4,000 | $1.50 | 25d | 1 | 1.12mi |
| 2937 SW 8th Pl Cape Coral, FL | 3.0 | 2.0 | 1706 | $3,550 | $2.08 | 25d | 1 | 1.13mi |
| 3011 SW 14th Ct Cape Coral, FL | 3.0 | 2.0 | 1455 | $1,825 | $1.25 | 25d | 1 | 1.14mi |
| 2054 Willow Branch Dr Cape Coral, FL | 3.0 | 2.5 | 2523 | $2,850 | $1.13 | 25d | 1 | 1.15mi |
| 2723 SW 5th Ave Cape Coral, FL | 3.0 | 3.0 | 2226 | $3,750 | $1.68 | 25d | 1 | 1.17mi |
| 1828 SW 3rd Pl Cape Coral, FL | 3.0 | 2.0 | 1806 | $1,911 | $1.06 | 5d | 1 | 1.17mi |
| 1218 SW 9th Ct Cape Coral, FL | 3.0 | 2.0 | 1476 | $2,850 | $1.93 | 3d | 1 | 1.21mi |
Listing history 21 events
-
2026-05-19status Pending
-
2026-05-18$230,000 Active
-
2024-08-07soldstatus $244,500
-
2024-06-13historical
-
2024-06-01price $265,000
-
2024-06-01status Active
-
2024-05-31historical
-
2024-05-20price $285,000
-
2024-05-16status Active
-
2024-05-15status Pending
-
2024-05-14price $295,000
-
2024-05-13status Active
-
2024-05-13historical
-
2024-05-02$305,000 Active
-
2013-09-17price $89,000 407-char remark
Show marketing remark (407 chars)
Affordable ownership-built in 1991 with 1983 sq ft under air (per property appraiser), 3 bedrooms and 2 baths, and serviced by city water (no assessments per city of Cape Coral) and septic tank. Bank Owned, sold as-is, Special Addenda, and solid prequalification letter or proof of cash needed with all offers. Buyer to pay doc stamps on deed. This is NOT a short sale. .fast response seller. Don't miss it!
-
2009-04-08soldstatus $92,500 407-char remark
Show marketing remark (407 chars)
Affordable ownership-built in 1991 with 1983 sq ft under air (per property appraiser), 3 bedrooms and 2 baths, and serviced by city water (no assessments per city of Cape Coral) and septic tank. Bank Owned, sold as-is, Special Addenda, and solid prequalification letter or proof of cash needed with all offers. Buyer to pay doc stamps on deed. This is NOT a short sale. .fast response seller. Don't miss it!
-
2006-05-18soldstatus $305,000
-
2006-02-02soldstatus $275,000
-
2001-10-05soldstatus $128,000
-
2000-10-13soldstatus $83,000
-
1996-05-17soldstatus $102,000
ⓘ Source: listings_history table (triggers on properties + properties_extension) + one-shot
backfill from property_details.listing_events for pre-trigger history.
Tax reassessment forecast FL · Resets to sale price
- Current annual tax
- $5,424 · $452/mo
- Projected year-2 tax
- $5,424 · $452/mo
- Expected delta
- $0/yr ($0/mo · 0.0%)
ⓘ Screening estimate from a state-policy table — verify with the county assessor before closing.
Climate risk First Street
- Flood 7/10 Severe FEMA zone X (shaded) · 75% chance over 30 yrs
- Wildfire 1/10 Low
- Heat 10/10 Extreme 6 d/yr ≥107°F today · 24 d/yr by 30 yrs out
- Wind 10/10 Extreme 99% chance of damaging wind over 30 yrs
- Air quality 2/10 Low 1 unhealthy d/yr today · 1 by 30 yrs out
Nearby sold comps map
Loading sold comps map…
Walkable amenities ~0.75 mi
Loading nearby amenities…
Taxation est. · year 1
- Rental income
- $28,478
- − Mortgage interest
- −$12,884
- − Property taxes
- −$5,424
- − Insurance
- −$1,948
- − Repairs & maintenance
- −$2,278
- − Management
- −$2,278
- − Depreciation
- −$6,691
- Taxable loss
- −$3,025
- Est. tax savings @ 24.0%
- +$726
- After-tax cash flow
- $1,378/yr
For passive investors: Depreciation is non-cash, so a rental often shows a tax loss while cash-flowing — sheltering income. Rental losses are passive: they offset passive income freely, and up to $25,000/yr can offset ordinary (W-2) income if you actively participate and your MAGI is under $100k (phasing out to $0 by $150k); unused losses carry forward. On sale, claimed depreciation is recaptured at up to 25%, and gains may owe capital-gains tax (a 1031 exchange can defer both). Figures are a year-1 estimate at your 24.0% rate — not tax advice; consult a CPA.
Schools (NCES district)
- District
- Lee
- NCES district ID
- 1201080
- Math proficiency
- 47% ▼ -11.00%
- Reading proficiency
- 50% ▼ -4.00%
- Median HH income
- $49,518
- Composite
- 41.49/100
- National rank
- #3458
- State rank
- #42 of 73 in FL
Livability — Cape Coral
- Score
- 77/100
- State rank
- #208
- US rank
- #3098
Category grades
Schools grade is shown separately in the Schools card above.
Census & demographics
- Census place
- Cape Coral, FL
- County
- Lee County · 788,662 people
- City population
- 217,388
- Metro
- Cape Coral-Fort Myers, FL
- Population (ZIP)
- 27,725
- Household income
- $84,470
- Rent vs Own
- Severe rent burden
- 760.0
Population outlook (Lee County) Hauer SSP2
- Today (2025)
- 871,946 people
- By 2030
- 955,468 · +9.6%
- By 2040
- 1,113,587 · +27.7%
- By 2050
- 1,256,891 · +44.1%
- By 2075
- 1,560,270 · +78.9%
- By 2100
- 1,726,848 · +98.0%
Race, ethnicity, and origin ACS 2023
- Neighborhood character
- Predominantly White (71%)
- Race & ethnicity
- White 71% Hispanic / Latino 20% Two or more races 14% Black 3% Asian 1%
- Hispanic origin (detail)
- Mexican 1% Puerto Rican 6% Cuban 6%
- Common ancestry
- Romanian 5% Lithuanian 3% Italian 3%
- Foreign-born
- 13% · Canada, Jamaica
- Languages at home
- 81% English-only · Spanish 15% Russian/Polish/Slavic 1% Tagalog/Filipino 1%
Political lean MEDSL · Lee
- 2024 margin
- Strong R (+28.4) · D 35.5% · R 63.9%
- 2008→2024 swing
- -18.0pp toward R · 2008: -10.4pp · 2024: -28.4pp
- All cycles
- 2024: R+28.4 2020: R+19.2 2016: R+20.4 2012: R+16.6 2008: R+10.4
Not yet ingested
- Civics
- —
Market trends
- HPI YoY
- ▼ -108.25%
- Current HPI
- 281.0735
- Rent YoY
- ▼ -8.55%
- Metro
- Cape Coral-Fort Myers, FL
- State GDP YoY
- ▲ 3.28%
- F500 in state
- 36
Industry mix (Fortune 500 HQ in FL)
| Industry | F500 HQs | Revenue |
|---|---|---|
| Industrial Technology | 2 | $29B |
|
||
| Insurance | 2 | $17B |
|
||
| Retail | 1 | $60B |
|
||
| Technology Distribution | 1 | $58B |
|
||
| Homebuilding | 1 | $35B |
|
||
| Technology Manufacturing | 1 | $35B |
|
||
Price history
+125.5% since first listed21 events — show timeline
- 2026-05-19 Pending — FORTMLS
- 2026-05-18 Listed $230,000 FORTMLS
- 2024-08-07 Sold (Public Records) $244,500 Public Records
- 2024-06-13 Listing Removed — NAPLESMLS
- 2024-06-01 Price Changed $265,000 NAPLESMLS
- 2024-06-01 Relisted — NAPLESMLS
- 2024-05-31 Listing Removed — NAPLESMLS
- 2024-05-20 Price Changed $285,000 NAPLESMLS
- 2024-05-16 Relisted — NAPLESMLS
- 2024-05-15 Pending — NAPLESMLS
- 2024-05-14 Price Changed $295,000 NAPLESMLS
- 2024-05-13 Relisted — NAPLESMLS
- 2024-05-13 Listing Removed — NAPLESMLS
- 2024-05-02 Listed $305,000 NAPLESMLS
- 2013-09-17 Price Changed $89,000 FORTMLS
- 2009-04-08 Sold (MLS) $92,500 FORTMLS
- 2006-05-18 Sold (Public Records) $305,000 Public Records
- 2006-02-02 Sold (Public Records) $275,000 Public Records
- 2001-10-05 Sold (Public Records) $128,000 Public Records
- 2000-10-13 Sold (Public Records) $83,000 Public Records
- 1996-05-17 Sold (Public Records) $102,000 Public Records
Property tax history
+5.3%/yrLatest (2025): $5,424 · +71.6% YoY. Source: county tax records.
Cash-flow waterfall
monthlySold comps — $/sqft
last 12 mo · ≤1 miLoading sold comps…