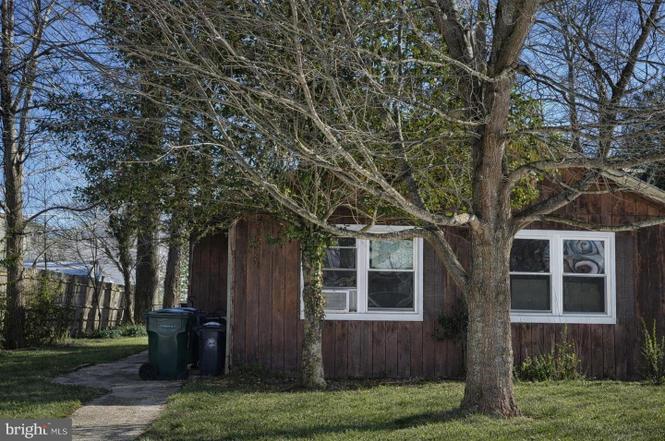
330 Falcon Dr · Little Egg Harbor, NJ
Flood risk 1/10 · Minimal
- FEMA flood zone
- X (unshaded)
- Chance of flooding over 30 yrs
- 0.0%
- Est. flood insurance / yr
- $507 – $1,088
Fire risk 3/10 · Minor
- Est. fire insurance / yr
- $526 – $976
Heat risk 8/10 · Major
- Hot days now (above 99°F)
- 7 days/yr
- Hot days in 30 yrs
- 15 days/yr
Wind risk 8/10 · Major
- Chance of severe wind over 30 yrs
- 80.0%
Air-quality risk 3/10 · Minor
- Unhealthy air days now
- 2 days/yr
- Unhealthy air days in 30 yrs
- 3 days/yr
Risk factors via First Street. Map © Google.
Why this score? — see what drove the B grade
The composite is a weighted blend of 9 inputs, each scored 0–100. Each bar is that input's sub-score; the figure is the points it added to the 100-point composite (weight × sub-score).
- Cash flow +29.5/30.0
- ARV discount +15.0/15.0
- DSCR +10.0/10.0
- 1% rule +8.4/10.0
- Schools +2.7/10.0
- Rent growth +2.5/5.0
- Livability +2.5/5.0
- Condition / age +2.5/5.0
- Appreciation +0.0/10.0
$200,000
🖨 Deal sheet (PDF) 📄 Offer letter ✓ Due diligence
Listing remarks MLS
Welcome to 330 Falcon Drive, this 3 bedroom 1 bath home is ready for you to come in and remodel it to make it H O M E .... Windows were replaced in the last few years as was the roof, solar is about $50 a month and helps with the electric. Close to regional shopping, beaches, and marinas. Jersey Shore home up for grabs. Make an appointment today. Being sold as is, Buyer to get transfer of title CO. A project for someone willing to do a full rehab.
Key facts
- Close to marinas
- Windows replaced
- Roof replaced
Tags
Property features AI
Finance
- Other: Not located in a federal flood zone; No horses allowed; Above-grade finished area reported by assessor; Total of 5 rooms; No basement
- Financial info: Fee simple ownership; Property assessed values provided (financial details excluded per instructions)
- HOA & community: No HOA information provided
Exterior
- Parking: Driveway parking for two vehicles; Two total garage/parking spaces
- Security: No security features provided
- Utilities: Public water; Public sewer; Electric hot water; Municipal trash service
- Home design: Detached structure; Not winterized
- Construction: Wood siding, stick-built construction; Shingle roof; Crawl space foundation; Built year per assessor (year built source: Assessor)
- Exterior features: Level lot; Lot dimensions approximately 50 x 100
Interior
- Kitchen: No kitchen appliance details provided
- Bedrooms: Three bedrooms on the main level
- Flooring: Vinyl flooring
- Bathrooms: One full bathroom on the main level
- Heating & cooling: Electric baseboard heating; Window air conditioning units (electric)
- Interior features: Has a free-standing wood fireplace; Major rehab needed
- Laundry & utility: No laundry details provided
Neighborhood map
What this means for you Summary
Snapshot
- This is a 3-bed/1.0-bath single-family listed at $200k.
Deal economics
- At list price, monthly cash flow is $718 ($9k/yr) — positive.
- The deal already cash-flows at list — no discount required.
- Meets the 1% rule at list price ($3k rent vs $200k).
- Recommended offer: $197k (1.5% below list) — sets the bar for market timing.
Location & tenants
- Location reads: area grade B — affects rentability + tenant quality, not the cash-flow math above.
- Pinelands Regional School District (rural): math 14% / reading 46% proficiency, ranked #344 of 472 in NJ (top 73%) — families likely to look elsewhere, expect single-tenant / working-renter base with shorter leases.
- Market conditions: 297 active listings in the ZIP; 2 comparable units currently listed for rent nearby; solid renter incomes; 4,434 units permitted in Ocean County in 2024 (868 in 5+ unit buildings).
- This rent runs 35% of the median local income ($92k/yr) — at the standard rent-burdened threshold; future hikes will face affordability resistance.
Forward outlook
- Local home prices are declining (-3.0%/yr); year-one equity from $1k of loan paydown is wiped out by about $6k of value loss. Plan a longer hold.
- Ocean County population projected to shrink 8% by 2050 — rents likely to lag national; underwrite the cash flow, not the appreciation.
- At projected returns (-3.0% appreciation + 3.0% rent growth), your $56k cash investment doubles in ~8 years — after that, you're playing with house money.
Negotiation context
- It's been on market 28 days — a 2% lower offer ($197k) is reasonable based on typical stale-listing flexibility.
- 3 sale attempts with the ask held roughly flat each time — persistent listings suggest the price (not the market) is what's stuck; bring a comps-based counter.
- Current owner paid $49k; list at $200k implies a 309% gain — meaningful room to come down on a strong offer.
Risks & watch-outs
- Climate carrying-cost: severe wind risk, 80% chance of damaging wind over 30y; extreme-heat days projected 7→15/yr by 2055 (HVAC capex compounding) — expect insurance premiums to compound above CPI over the hold.
Questions for the listing agent
- Is there a deadline driving the sale (1031 exchange, divorce, estate, relocation)? That informs how much negotiation room exists.
- What's the average days-on-market for RENTAL listings here right now (not sales)? A rising rental-DOM trend means longer vacancies and softer asking-rent achievability than the comps imply.
- What's the recent tenant-quality profile in this submarket — average credit score on applications, eviction rate, late-payment / NSF rate, and stable-employment percentage? A property-management company in the area should have these aggregated.
- How much new for-sale + rental construction is in the pipeline within 1–3 miles? Heavy new supply typically softens prices + rents 12–24 months out; constrained supply supports both.
Investment metrics
- 1% rule
- 1.34% ✓
- Cap rate
- 10.60%
- Cash-on-cash
- 15.38%
- DSCR
- 1.68
- GRM
- 6.2
CMA / ARV
- ARV (on-the-fly)
- $299,268
- Comps found
- 12
Show comp detail 12 sales within ~0.75 mi
| Address | Dist | Beds/Ba | Sqft | Sold | Price | $/sf | Match |
|---|---|---|---|---|---|---|---|
| 330 Falcon Dr | 0.00mi | 3/1.0 | 978 (0%) | 0mo | $170,000 | $174 | 100 |
| 118 Lake Deerbrook Dr | 0.30mi | 3/1.0 | 1,040 (+6%) | 2mo | $335,000 | $322 | 74 |
| 18 Lake Huron Dr | 0.47mi | 3/1.0 | 1,000 (+2%) | 1mo | $430,000 | $430 | 73 |
| 425 National Union Blvd | 0.29mi | 3/1.0 | 1,056 (+8%) | 1mo | $338,000 | $320 | 73 |
| 215 Lexington Dr | 0.38mi | 2/1.0 (-1) | 944 (-4%) | 2mo | $145,000 | $154 | 70 |
| 233 Yorktowne Dr | 0.45mi | 2/2.0 (-1) | 986 (+1%) | 3mo | $249,900 | $253 | 67 |
| 203 Lake Placid Dr | 0.19mi | 2/1.0 (-1) | 864 (-12%) | 2mo | $324,900 | $376 | 65 |
| 26 W Mullica Rd | 0.74mi | 3/2.0 | 986 (+1%) | 2mo | $302,000 | $306 | 59 |
| 21 S Dayton Dr | 0.71mi | 2/1.0 (-1) | 912 (-7%) | 0mo | $425,000 | $466 | 50 |
| 106 Lantern Pl | 0.62mi | 2/2.0 (-1) | 1,056 (+8%) | 1mo | $245,000 | $232 | 48 |
| 114 Mohican Ln | 0.67mi | 2/2.0 (-1) | 1,056 (+8%) | 0mo | $285,000 | $270 | 46 |
| 123 Mohican Ln | 0.65mi | 2/2.0 (-1) | 1,056 (+8%) | 3mo | $160,000 | $152 | 45 |
Match score weights: distance 35% · size 25% · config 20% · recency 20%. Top-matched comps best support the ARV.
Projected returns pro-forma
-3.0% appreciation · 3.0% rent growth · sell at horizon
- IRR
- 6.1%
- Equity multiple
- 1.24×
- Total profit
- $13,349
- Equity at exit
- $29,821
- IRR
- 15.5%
- Equity multiple
- 2.26×
- Total profit
- $70,679
- Equity at exit
- $17,292
Cash invested: $56,000 (down + closing). Projections, not guarantees.
Landlord ↔ Tenant lean methodology
- Overall (STATE)
- 21 Tenant-Leaning
- State New Jersey
- 21 Tenant-Leaning · D+6
- County
- — inherits STATE
- City
- — inherits STATE
ZIP-level market 08087
- Active inventory
- 297
- Price-to-rent
- 6.2×
Monthly cashflow live
- Estimated rent
- $2,675 medium interval (Pro) →
- Mortgage (P&I)
- −$1,049
- Tax from tax record
- −$263 /mo · $3,156/yr
- Insurance
- −$83
- HOA
- −$0
- Vacancy / Maint / Mgmt
- −$562
- Net cashflow
- $718
Break-even live
Sensitivity live
| Price | -10% $831 | -5% $774 | +0% $718 | +5% $661 | +10% $604 |
|---|---|---|---|---|---|
| Rent | -10% $506 | -5% $612 | +0% $718 | +5% $823 | +10% $929 |
| Rate | -1.0pp $818 | -0.5pp $769 | base $718 | +0.5pp $666 | +1.0pp $613 |
UW: 25.0% down · 7.5% · 30yr · 1.5% tax · 5.0% vac · 8.0% maint · 8.0% mgmt
Financing live
Cash to close
- Down payment
- $50,000
- Closing costs
- $6,000
- Reserves months
- —
- Total cash needed
- —
Loan-product check · same deal, 3 products live
Conventional
25% down · 7.5% · 30yr
- Down + closing
- —
- Monthly P&I
- —
- Monthly cashflow
- —
- DSCR
- —
- Eligible?
- —
Personal DTI + credit; lowest rate.
DSCR
20% down · 8.5% · 30yr
- Down + closing
- —
- Monthly P&I
- —
- Monthly cashflow
- —
- DSCR
- —
- Eligible?
- —
No personal income docs; deal must DSCR.
Hard money
10% down · 12.0% · 12mo
- Down + closing
- —
- Monthly P&I
- —
- Monthly cashflow
- —
- DSCR
- —
- Eligible?
- —
Short-term bridge; refi at stabilization.
Rent comps 2 comps
| Address | Beds | Baths | Sqft | Rent | $/sqft | DOM | Units | Dist |
|---|---|---|---|---|---|---|---|---|
| 32 Pin Oak Ln Little Egg Harbor Twp, NJ | 3.0 | 1.5 | 1000 | $2,550 | $2.55 | 0d | 1 | 0.48mi |
| 12 Timberline Dr Little Egg Harbor Twp, NJ | 2.0 | 1.5 | 943 | $2,250 | $2.39 | 25d | 1 | 0.99mi |
Listing history 12 events
-
2026-06-17remarks 453-char remark
-
2026-06-17days on market $200,000 Pending 28 DOM
-
2026-05-18status Pending 453-char remark
Show marketing remark (453 chars)
Welcome to 330 Falcon Drive, this 3 bedroom 1 bath home is ready for you to come in and remodel it to make it H O M E .... Windows were replaced in the last few years as was the roof, solar is about $50 a month and helps with the electric. Close to regional shopping, beaches, and marinas. Jersey Shore home up for grabs. Make an appointment today. Being sold as is, Buyer to get transfer of title CO. A project for someone willing to do a full rehab.
-
2026-05-12status Pending
-
2026-05-03historical Active Under Contract
-
2026-04-21status Active
-
2026-04-20$200,000 Active 453-char remark
Show marketing remark (453 chars)
Welcome to 330 Falcon Drive, this 3 bedroom 1 bath home is ready for you to come in and remodel it to make it H O M E .... Windows were replaced in the last few years as was the roof, solar is about $50 a month and helps with the electric. Close to regional shopping, beaches, and marinas. Jersey Shore home up for grabs. Make an appointment today. Being sold as is, Buyer to get transfer of title CO. A project for someone willing to do a full rehab.
-
2026-02-27historical Active Under Contract
-
2026-01-30$200,000 Active
-
1999-03-18soldstatus $48,950
-
1988-12-08soldstatus $92,500
-
1988-09-12soldstatus $78,000
ⓘ Source: listings_history table (triggers on properties + properties_extension) + one-shot
backfill from property_details.listing_events for pre-trigger history.
Tax reassessment forecast NJ · Partial reset (capped growth)
- Current annual tax
- $3,156 · $263/mo
- Projected year-2 tax
- $4,068 · $339/mo
- Expected delta
- +$912/yr (+$76/mo · 28.9%)
ⓘ Screening estimate from a state-policy table — verify with the county assessor before closing.
Climate risk First Street
- Flood 1/10 Low FEMA zone X (unshaded) · 0% chance over 30 yrs
- Wildfire 3/10 Moderate
- Heat 8/10 Severe 7 d/yr ≥99°F today · 15 d/yr by 30 yrs out
- Wind 8/10 Severe 80% chance of damaging wind over 30 yrs
- Air quality 3/10 Moderate 2 unhealthy d/yr today · 3 by 30 yrs out
Nearby sold comps map
Loading sold comps map…
Walkable amenities ~0.75 mi
Loading nearby amenities…
Taxation est. · year 1
- Rental income
- $32,094
- − Mortgage interest
- −$11,203
- − Property taxes
- −$3,156
- − Insurance
- −$1,000
- − Repairs & maintenance
- −$2,568
- − Management
- −$2,568
- − Depreciation
- −$5,818
- Taxable income
- $5,781
- Est. tax owed @ 24.0%
- −$1,388
- After-tax cash flow
- $7,225/yr
For passive investors: Depreciation is non-cash, so a rental often shows a tax loss while cash-flowing — sheltering income. Rental losses are passive: they offset passive income freely, and up to $25,000/yr can offset ordinary (W-2) income if you actively participate and your MAGI is under $100k (phasing out to $0 by $150k); unused losses carry forward. On sale, claimed depreciation is recaptured at up to 25%, and gains may owe capital-gains tax (a 1031 exchange can defer both). Figures are a year-1 estimate at your 24.0% rate — not tax advice; consult a CPA.
Schools (NCES district)
- District
- Pinelands Regional School District
- NCES district ID
- 3413000
- Math proficiency
- 14% ▼ -20.00%
- Reading proficiency
- 46% ▼ -7.00%
- Median HH income
- $59,396
- Composite
- 26.97/100
- National rank
- #7075
- State rank
- #344 of 472 in NJ
Livability — Little Egg Harbor
No livability data for this city. (Only ~50 U.S. cities are tracked.)
Census & demographics
- Census place
- Mystic Island, NJ
- County
- Ocean County · 439,426 people
- Metro
- New York-Newark-Jersey City, NY-NJ-PA
- Population (ZIP)
- 25,342
- Household income
- $91,677
- Rent vs Own
- Severe rent burden
- 519.0
Population outlook (Ocean County) Hauer SSP2
- Today (2025)
- 586,991 people
- By 2030
- 581,403 · -1.0%
- By 2040
- 564,913 · -3.8%
- By 2050
- 538,149 · -8.3%
- By 2075
- 468,845 · -20.1%
- By 2100
- 350,297 · -40.3%
Race, ethnicity, and origin ACS 2023
- Neighborhood character
- Predominantly White (86%)
- Race & ethnicity
- White 86% Hispanic / Latino 6% Two or more races 6% Black 3% Asian 1%
- Hispanic origin (detail)
- Mexican 1% Puerto Rican 2%
- Common ancestry
- Romanian 6% Slovak 2% Portuguese 2%
- Foreign-born
- 3% · Canada
- Languages at home
- 95% English-only · Spanish 2% Other Indo-European 1% German/W. Germanic 1%
Political lean MEDSL · Ocean
- 2024 margin
- Solid R (+36.0) · D 31.4% · R 67.4% · Other 1.2%
- 2008→2024 swing
- -17.6pp toward R · 2008: -18.4pp · 2024: -36.0pp
- All cycles
- 2024: R+36.0 2020: R+28.7 2016: R+34.0 2012: R+17.7 2008: R+18.4
Not yet ingested
- Civics
- —
Market trends
- HPI YoY
- ▼ -243.86%
- Current HPI
- 340.4378
- Rent YoY
- —
- Metro
- New York-Newark-Jersey City, NY-NJ-PA
- State GDP YoY
- ▲ 2.05%
- F500 in state
- 34
Industry mix (Fortune 500 HQ in NJ)
| Industry | F500 HQs | Revenue |
|---|---|---|
| Consumer Goods | 3 | $31B |
|
||
| Pharmaceuticals | 2 | $153B |
|
||
| Technology | 2 | $21B |
|
||
| Insurance | 2 | $20B |
|
||
| Healthcare | 2 | $19B |
|
||
| Financial Services | 1 | $70B |
|
||
Price history
+156.4% since first listed10 events — show timeline
- 2026-05-18 Pending — MOMLS
- 2026-05-12 Pending — BRIGHT MLS
- 2026-05-03 Contingent — BRIGHT MLS
- 2026-04-21 Relisted — BRIGHT MLS
- 2026-04-20 Listed $200,000 MOMLS
- 2026-02-27 Contingent — BRIGHT MLS
- 2026-01-30 Listed $200,000 BRIGHT MLS
- 1999-03-18 Sold (Public Records) $48,950 Public Records
- 1988-12-08 Sold (Public Records) $92,500 Public Records
- 1988-09-12 Sold (Public Records) $78,000 Public Records
Property tax history
+1.4%/yrLatest (2025): $3,156 · +10.8% YoY. Source: county tax records.
Cash-flow waterfall
monthlySold comps — $/sqft
last 12 mo · ≤1 miLoading sold comps…