 8-Plex
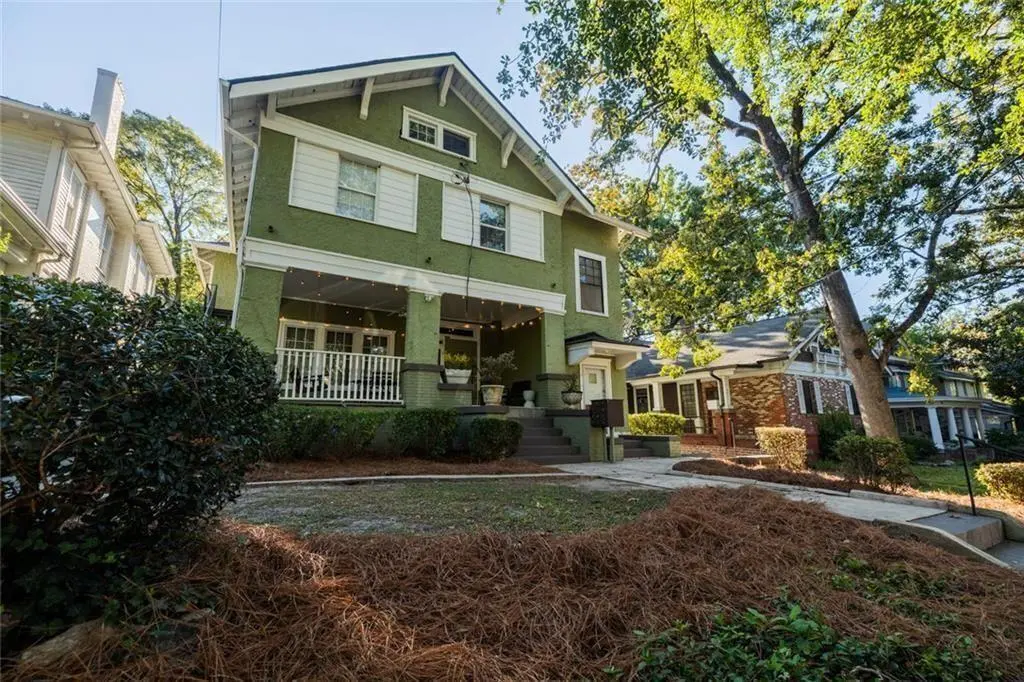
887 Myrtle St NE · Atlanta, GA
Flood risk 1/10 · Minimal
- FEMA flood zone
- X (unshaded)
- Chance of flooding over 30 yrs
- 0.0%
- Est. flood insurance / yr
- $507 – $1,088
Fire risk 1/10 · Minimal
- Est. fire insurance / yr
- $963 – $1,789
Heat risk 6/10 · Moderate
- Hot days now (above 104°F)
- 7 days/yr
- Hot days in 30 yrs
- 18 days/yr
Wind risk 5/10 · Moderate
- Chance of severe wind over 30 yrs
- 25.0%
Air-quality risk 4/10 · Minor
- Unhealthy air days now
- 5 days/yr
- Unhealthy air days in 30 yrs
- 7 days/yr
Risk factors via First Street. Map © Google.
Why this score? — see what drove the C+ grade
The composite is a weighted blend of 9 inputs, each scored 0–100. Each bar is that input's sub-score; the figure is the points it added to the 100-point composite (weight × sub-score).
- Cash flow +27.1/30.0
- DSCR +9.4/10.0
- 1% rule +7.3/10.0
- Livability +4.2/5.0
- ARV discount +3.8/15.0
- Rent growth +3.3/5.0
- Schools +2.7/10.0
- Condition / age +2.5/5.0
- Appreciation +0.0/10.0
$1,650,000
🖨 Deal sheet (PDF) 📄 Offer letter ✓ Due diligence
Multi-family units
County records classify this as Multi-Family (5+ Unit). Listing-text estimate: 8 units. confirmed
5+ unit building — per-unit beds/baths from public records are typically unavailable; the breakdown below (if shown) is an estimate from the listing text.
Listing remarks MLS
Exceptional opportunity to own a True Slice of Midtown. This 8 unit income producing property in the heart of Midtown offers enough Historic Charm to make any investor proud. New Electrical updates (fully separated meters) and a New Roof only sweeten the pot. The unit mix is broad, one 3/2 and two 2 bedroom units as well as several 1 bedrooms of various sizes. Professional management already in place so this one is just plug and play.
Key facts
- Historic charm
- New roof
- 7,884 sq ft lot
Tags
Neighborhood map
What this means for you Summary
Snapshot
- This is a 1×3bd/2ba + 2×2bd/1ba + 5×1bd/1ba units multifamily listed at $1.65M.
Deal economics
- At list price, monthly cash flow is $5k ($56k/yr) — positive. Per door: $581/mo.
- The deal already cash-flows at list — no discount required.
- Meets the 1% rule at list price ($20k rent vs $1.65M).
- Recommended offer: $1.45M (12.0% below list) — sets the bar for market timing.
Location & tenants
- Location reads 83/100 on livability (#6 in GA, #919 nationally) — a professional / high-income tenant draw. Strengths: amenities A+, commute A+, housing A+; Watch: cost of living C-.
- Atlanta Public Schools (urban): math 28% / reading 35% proficiency, ranked #80 of 174 in GA (top 46%) — families likely to look elsewhere, expect single-tenant / working-renter base with shorter leases; 71% free/reduced lunch — lower-income household profile, screen leases tightly.
- Zoned schools: Springdale Park Elementary School (math 72% / reading 75%, grade A, #37 of 1,228 statewide, top 3%, 742 students, 11% FRL); David T Howard Middle School (math 58% / reading 63%, grade B+, #39 of 470 statewide, top 8%, 1,119 students, 19% FRL); Midtown High School (math 22% / reading 34%, grade F, #151 of 424 statewide, top 36%, 1,602 students, 19% FRL) — zoned schools average 16% FRL vs 71% district-wide (55 pts lower); this property's tenant base skews higher-income than the district average.
- Zoned-school proficiency averages 54% at this address vs 32% district-wide (+23 pts) — the actual schools serving this property are materially stronger than the Atlanta Public Schools average implies; a family-tenant draw the district grade alone would hide.
- Market conditions: Rents rising (+3.1%/yr); 414 active listings in the ZIP; 40 comparable units currently listed for rent nearby; rentals at typical pace (median 24d on market — plan ~3-4 weeks tenant-placement turnaround); high-income renter base; 11,565 units permitted in Fulton County in 2024 (8,159 in 5+ unit buildings).
Forward outlook
- Local home prices are declining (-3.0%/yr); year-one equity from $11k of loan paydown is wiped out by about $50k of value loss. Plan a longer hold.
- Fulton County population projected at +38% by 2050 — long-run rental-demand tailwind backs the buy-and-hold thesis.
- At projected returns (-3.0% appreciation + 3.1% rent growth), your $462k cash investment doubles in ~10 years — after that, you're playing with house money.
Negotiation context
- It's been on market 143 days — a 12% lower offer ($1.45M) is reasonable based on typical stale-listing flexibility.
- 12 sale attempts since 8y ago; this cycle's ask has dropped $300k (15%) from the opening price — seller is motivated, your offer sets the floor, not the list.
- Current owner paid $1.07M; list at $1.65M implies a 53% gain — meaningful room to come down on a strong offer.
Risks & watch-outs
- Watch-outs: built in 1910 — expect roof / HVAC / electrical / plumbing capex.
- Climate carrying-cost: moderate wind risk, 25% chance of damaging wind over 30y; extreme-heat days projected 7→18/yr by 2055 (HVAC capex compounding) — expect insurance premiums to compound above CPI over the hold.
Questions for the listing agent
- It's been on market 143 days. Have you received any prior offers? Is the seller open to a 12% concession, seller financing, or rate buy-down credit?
- Can we see the unit-by-unit rent roll, current vacancy, and any below-market leases? What's the average tenancy length?
- What capital expenditures (roof, boiler, parking lot, exteriors) have been made in the last 5 years, and what's planned in the next 2?
- Built in 1910 — when were the roof, HVAC, electrical panel, plumbing, and water heater last replaced?
- Why hasn't it sold? Are there any deal-killer items the seller is aware of (foundation, flood, title, zoning, code violations)?
- Is there a deadline driving the sale (1031 exchange, divorce, estate, relocation)? That informs how much negotiation room exists.
- What's the average days-on-market for RENTAL listings here right now (not sales)? A rising rental-DOM trend means longer vacancies and softer asking-rent achievability than the comps imply.
- What's the recent tenant-quality profile in this submarket — average credit score on applications, eviction rate, late-payment / NSF rate, and stable-employment percentage? A property-management company in the area should have these aggregated.
- How much new apartment / multifamily construction is in the pipeline within 1–3 miles? Heavy new supply (>2% of stock underway) typically softens rents 12–24 months out; light construction supports rent growth.
Investment metrics
- 1% rule
- 1.23% ✓
- Cap rate
- 9.67%
- Cash-on-cash
- 12.07%
- DSCR
- 1.54
- GRM
- 6.8
CMA / ARV
- ARV (median comp)
- $1,525,778
- List price
- $1,650,000
- Delta
- 8.14%
- Verdict
- FAIR
- Comps
- 2 within 1.0 mi
Show comp detail 10 sales within ~0.75 mi
| Address | Dist | Beds/Ba | Sqft | Sold | Price | $/sf | Match |
|---|---|---|---|---|---|---|---|
| 323 4th St NE | 0.35mi | 2/1.0 | — | 2mo | $1,265,000 | — | 70 |
| 417 8th St NE | 0.34mi | 6/3.0 | — | 4mo | $755,000 | — | 68 |
| 837 Vedado Way NE | 0.47mi | 6/5.0 | — | 1mo | $1,001,000 | — | 64 |
| 704 Durant Pl NE | 0.38mi | 12/12.0 | — | 7mo | $2,175,000 | — | 64 |
| 896 Charles Allen Dr NE | 0.35mi | 5/4.0 | 4,313 | 12mo | $1,375,000 | $319 | 61 |
| 812 Monroe Dr NE | 0.53mi | 5/5.0 | — | 13mo | $865,000 | — | 52 |
| 600 Parkway Dr NE | 0.66mi | 23/16.0 | — | 6mo | $2,450,000 | — | 52 |
| 722 Lakeview Ave NE | 0.75mi | 6/4.0 | — | 18mo | $1,725,000 | — | 38 |
| 594 Parkway Dr NE | 0.66mi | 8/5.0 | — | 24mo | $887,000 | — | 37 |
| 673 Kennesaw Ave NE | 0.69mi | 3/3.0 | — | 23mo | $625,000 | — | 36 |
Match score weights: distance 35% · size 25% · config 20% · recency 20%. Top-matched comps best support the ARV.
Projected returns pro-forma
-3.0% appreciation · 3.09% rent growth · sell at horizon
- IRR
- 1.7%
- Equity multiple
- 1.07×
- Total profit
- $30,839
- Equity at exit
- $246,020
- IRR
- 11.4%
- Equity multiple
- 1.90×
- Total profit
- $416,897
- Equity at exit
- $142,662
Cash invested: $462,000 (down + closing). Projections, not guarantees.
Landlord ↔ Tenant lean methodology
- Overall (STATE)
- 90 Strongly Landlord-Friendly
- State Georgia
- 90 Strongly Landlord-Friendly · R+3
- County
- — inherits STATE
- City
- — inherits STATE
ZIP-level market 30309
- Rents YoY
- 3.1%
- Active inventory
- 414
- Price-to-rent
- 34.5×
Monthly cashflow live
- Estimated rent
- $20,318 high interval (Pro) →
- Mortgage (P&I)
- −$8,653
- Tax est. 1.5%
- −$2,062 /mo · $24,750/yr
- Insurance
- −$688
- HOA
- −$0
- Vacancy / Maint / Mgmt
- −$4,267
- Net cashflow
- $4,648
Break-even live
Sensitivity live
| Price | -10% $5,789 | -5% $5,219 | +0% $4,648 | +5% $4,078 | +10% $3,508 |
|---|---|---|---|---|---|
| Rent | -10% $3,043 | -5% $3,846 | +0% $4,648 | +5% $5,451 | +10% $6,254 |
| Rate | -1.0pp $5,479 | -0.5pp $5,068 | base $4,648 | +0.5pp $4,221 | +1.0pp $3,786 |
8-unit breakdown (identical units grouped — click to expand)
| Units | Beds | Baths | Est. rent |
|---|---|---|---|
| 1× unit | 3 | 2 | $3,980 |
| 2× units | 2 | 1 | $5,428 |
| #2 | 2 | 1 | $2,714 |
| #3 | 2 | 1 | $2,714 |
| 5× units | 1 | 1 | $10,910 |
| #4 | 1 | 1 | $2,182 |
| #5 | 1 | 1 | $2,182 |
| #6 | 1 | 1 | $2,182 |
| #7 | 1 | 1 | $2,182 |
| #8 | 1 | 1 | $2,182 |
| Total (8 units) | $20,318 | ||
UW: 25.0% down · 7.5% · 30yr · 1.5% tax · 5.0% vac · 8.0% maint · 8.0% mgmt
Financing live
Cash to close
- Down payment
- $412,500
- Closing costs
- $49,500
- Reserves months
- —
- Total cash needed
- —
Loan-product check · same deal, 3 products live
Conventional
25% down · 7.5% · 30yr
- Down + closing
- —
- Monthly P&I
- —
- Monthly cashflow
- —
- DSCR
- —
- Eligible?
- —
Personal DTI + credit; lowest rate.
DSCR
20% down · 8.5% · 30yr
- Down + closing
- —
- Monthly P&I
- —
- Monthly cashflow
- —
- DSCR
- —
- Eligible?
- —
No personal income docs; deal must DSCR.
Hard money
10% down · 12.0% · 12mo
- Down + closing
- —
- Monthly P&I
- —
- Monthly cashflow
- —
- DSCR
- —
- Eligible?
- —
Short-term bridge; refi at stabilization.
Rent comps 40 comps
| Address | Beds | Baths | Sqft | Rent | $/sqft | DOM | Units | Dist |
|---|---|---|---|---|---|---|---|---|
| 265 9th St NE Atlanta, GA | 1.0 | 1.0 | 750 | $1,545 | $2.06 | 26d | 1 | 0.09mi |
| 897 Argonne Ave NE Unit 4 Atlanta, GA | 1.0 | 1.0 | 4268 | $1,850 | $0.43 | 1d | 1 | 0.09mi |
| 893 Piedmont Ave NE #3 Atlanta, GA | 1.0 | 1.0 | 804 | $2,800 | $3.48 | 26d | 1 | 0.10mi |
| 893 Piedmont Ave NE #3 Atlanta, GA | 1.0 | 1.0 | — | $2,800 | — | 1d | 1 | 0.10mi |
| 834 Argonne Ave NE Atlanta, GA | 1.0 | 1.0 | 500 | $1,445 | $2.89 | 26d | 1 | 0.13mi |
| 286 9th St NE Unit 286-01 Atlanta, GA | 1.0 | 1.0 | 750 | $1,525 | $2.03 | 26d | 1 | 0.14mi |
| 286 9th St NE Unit 286-03 Atlanta, GA | 1.0 | 1.0 | 750 | $1,650 | $2.20 | 14d | 1 | 0.14mi |
| 292 9th St NE Atlanta, GA | 3.0 | 2.5 | 3397 | $30,000 | $8.83 | 20d | 1 | 0.14mi |
| 940 Piedmont Ave NE Atlanta, GA | 1.0 | 1.0 | 596 | $1,500 | $2.51 | 24d | 1 | 0.16mi |
| 830 Piedmont Ave NE Unit 1461658P Atlanta, GA | 1.0 | 1.0 | 721 | $3,612 | $5.01 | 7d | 1 | 0.19mi |
| 787 Myrtle St NE Unit 1 Atlanta, GA | 3.0 | 2.0 | 2300 | $6,500 | $2.83 | 26d | 1 | 0.20mi |
| 799 Argonne Ave NE Unit 318-3 Atlanta, GA | 1.0 | 1.0 | 900 | $1,695 | $1.88 | 17d | 1 | 0.20mi |
| 250 10th St NE Atlanta, GA | 2.0 | 1.0–2.0 | 892 | $2,985 | $3.34 | 0d | 15 | 0.21mi |
| 321 10th St NE Unit 3 Atlanta, GA | 2.0 | 2.0 | 1700 | $2,995 | $1.76 | 26d | 1 | 0.21mi |
| 955 Juniper St NE #3228 Atlanta, GA | 1.0 | 1.0 | 715 | $1,750 | $2.45 | 18d | 1 | 0.21mi |
| 804 Piedmont Ave NE Atlanta, GA | 2.0 | 2.5 | 1176 | $3,000 | $2.55 | 26d | 1 | 0.24mi |
| 888 Juniper St NE Atlanta, GA | 1.0–3.0 | 1.0–3.0 | 1439 | $4,168 | $2.90 | 1d | 24 | 0.26mi |
| 180 10th St NE Atlanta, GA | 2.0–3.0 | 2.0–3.0 | 1621 | $3,550 | $2.19 | 0d | 20 | 0.26mi |
| 100 6th St NE Atlanta, GA | 3.0 | 1.0–3.0 | 997 | $2,712 | $2.72 | 0d | 23 | 0.26mi |
| 378 9th St NE Unit 1 Atlanta, GA | 2.0 | 1.0 | 1000 | $2,395 | $2.40 | 26d | 1 | 0.27mi |
| 811 Juniper St NE Atlanta, GA | 1.0 | 1.0 | 811 | $1,994 | $2.46 | 0d | 10 | 0.27mi |
| 395 8th St NE Atlanta, GA | 3.0 | 2.5 | 1554 | $4,250 | $2.73 | 26d | 1 | 0.28mi |
| 903 Peachtree St NE Atlanta, GA | 3.0 | 1.0–2.5 | 945 | $3,218 | $3.41 | 0d | 50 | 0.28mi |
| 923 Peachtree St NE Atlanta, GA | 1.0 | 1.0 | 732 | $2,672 | $3.65 | 9d | 2 | 0.28mi |
| 923 Peachtree St NE Atlanta, GA | 1.0–2.0 | 1.0–2.0 | 900 | $3,100 | $3.44 | 0d | 2 | 0.28mi |
| 923 Peachtree St NE Atlanta, GA | 1.0 | 1.0 | 732 | $2,350 | $3.21 | 17d | 2 | 0.28mi |
| 1020 Piedmont Ave NE Atlanta, GA | 3.0 | 1.0–2.0 | 1005 | $3,285 | $3.27 | 1d | 23 | 0.28mi |
| 1045 Piedmont Ave NE Atlanta, GA | 1.0 | 1.0 | 698 | $1,995 | $2.86 | 5d | 3 | 0.28mi |
| 943 Peachtree St NE #1519 Atlanta, GA | 1.0 | 1.0 | 897 | $2,400 | $2.68 | 26d | 1 | 0.28mi |
| 855 Peachtree St NE #3007 Atlanta, GA | 2.0 | 2.5 | 1184 | $3,200 | $2.70 | 26d | 1 | 0.29mi |
| 855 Peachtree St NE #3007 Atlanta, GA | 2.0 | 3.0 | 1184 | $3,100 | $2.62 | 6d | 1 | 0.29mi |
| 855 Peachtree St NE #2607 Atlanta, GA | 2.0 | 2.5 | 1184 | $3,150 | $2.66 | 26d | 1 | 0.29mi |
| 855 Peachtree St NE #2413 Atlanta, GA | 2.0 | 2.0 | 1158 | $3,200 | $2.76 | 26d | 1 | 0.29mi |
| 855 Peachtree St NE #1511 Atlanta, GA | 2.0 | 1.0 | 838 | $2,300 | $2.74 | 26d | 1 | 0.29mi |
| 855 Peachtree St NE #1813 Atlanta, GA | 2.0 | 2.0 | 1204 | $2,850 | $2.37 | 26d | 1 | 0.29mi |
| 206 11th St NE #402 Atlanta, GA | 1.0 | 1.0 | 1239 | $3,000 | $2.42 | 26d | 1 | 0.31mi |
| 878 Peachtree St NE #415 Atlanta, GA | 1.0 | 1.0 | 603 | $1,750 | $2.90 | 26d | 1 | 0.31mi |
| 385 10th St NE Atlanta, GA | 1.0 | 1.0 | — | $1,900 | — | 26d | 1 | 0.31mi |
| 811 Peachtree St NE Atlanta, GA | 3.0 | 1.0–3.0 | 855 | $3,295 | $3.85 | 0d | 113 | 0.31mi |
| 420 7th St NE Unit 1541067P Atlanta, GA | 3.0 | 2.0 | — | $13,631 | — | 24d | 1 | 0.32mi |
Listing history 43 events
-
2026-06-21days on market $1,650,000 Active 143 DOM
-
2026-06-18days on market $1,650,000 Active 140 DOM
-
2026-06-17days on market $1,650,000 Active 139 DOM
-
2026-06-16days on market $1,650,000 Active 138 DOM
-
2026-06-15days on market $1,650,000 Active 137 DOM
-
2026-06-13days on market $1,650,000 Active 135 DOM
-
2026-06-13days on market $1,650,000 Active 134 DOM
-
2026-06-09days on market $1,650,000 Active 131 DOM
-
2026-06-08days on market $1,650,000 Active 130 DOM
-
2026-06-07days on market $1,650,000 Active 129 DOM
-
2026-06-04days on market $1,650,000 Active 126 DOM
-
2026-06-03days on market $1,650,000 Active 125 DOM
-
2026-06-02days on market $1,650,000 Active 124 DOM
-
2026-06-01days on market $1,650,000 Active 123 DOM
-
2026-05-31days on market $1,650,000 Active 122 DOM
-
2026-05-20price $1,650,000 442-char remark
Show marketing remark (442 chars)
Exceptional opportunity to own a True Slice of Midtown. This 8 unit income producing property in the heart of Midtown offers enough Historic Charm to make any investor proud. New Electrical updates (fully separated meters) and a New Roof only sweeten the pot. The unit mix is broad, one 3/2 and two 2 bedroom units as well as several 1 bedrooms of various sizes. Professional management already in place so this one is just plug and play.
-
2026-04-16status Back On Market 442-char remark
Show marketing remark (442 chars)
Exceptional opportunity to own a True Slice of Midtown. This 8 unit income producing property in the heart of Midtown offers enough Historic Charm to make any investor proud. New Electrical updates (fully separated meters) and a New Roof only sweeten the pot. The unit mix is broad, one 3/2 and two 2 bedroom units as well as several 1 bedrooms of various sizes. Professional management already in place so this one is just plug and play.
-
2026-04-15historical 442-char remark
Show marketing remark (442 chars)
Exceptional opportunity to own a True Slice of Midtown. This 8 unit income producing property in the heart of Midtown offers enough Historic Charm to make any investor proud. New Electrical updates (fully separated meters) and a New Roof only sweeten the pot. The unit mix is broad, one 3/2 and two 2 bedroom units as well as several 1 bedrooms of various sizes. Professional management already in place so this one is just plug and play.
-
2026-01-29$1,950,000 New 442-char remark
Show marketing remark (442 chars)
Exceptional opportunity to own a True Slice of Midtown. This 8 unit income producing property in the heart of Midtown offers enough Historic Charm to make any investor proud. New Electrical updates (fully separated meters) and a New Roof only sweeten the pot. The unit mix is broad, one 3/2 and two 2 bedroom units as well as several 1 bedrooms of various sizes. Professional management already in place so this one is just plug and play.
-
2026-01-29$1,950,000 Active 442-char remark
Show marketing remark (442 chars)
Exceptional opportunity to own a True Slice of Midtown. This 8 unit income producing property in the heart of Midtown offers enough Historic Charm to make any investor proud. New Electrical updates (fully separated meters) and a New Roof only sweeten the pot. The unit mix is broad, one 3/2 and two 2 bedroom units as well as several 1 bedrooms of various sizes. Professional management already in place so this one is just plug and play.
-
2026-01-29historical
Show marketing remark (442 chars)
Exceptional opportunity to own a True Slice of Midtown. This 8 unit income producing property in the heart of Midtown offers enough Historic Charm to make any investor proud. New Electrical updates (fully separated meters) and a New Roof only sweeten the pot. The unit mix is broad, one 3/2 and two 2 bedroom units as well as several 1 bedrooms of various sizes. Professional management already in place so this one is just plug and play.
-
2025-11-04$2,050,000 New
-
2025-11-04historical
-
2025-11-04historical
-
2025-10-06$2,100,000 Active
-
2025-10-06$2,100,000 New
-
2025-09-30historical
-
2025-09-24historical
-
2024-11-17historical $1,198
-
2024-11-16$1,198
-
2024-09-17historical $1,275
-
2024-09-17historical $1,275
-
2024-09-17$1,275
-
2024-09-17$1,685
-
2024-09-17historical $1,250
-
2024-09-05$1,250
-
2024-08-23historical $1,275
-
2024-08-04price $1,275
-
2024-08-02$1,350
-
2019-02-14soldstatus $1,075,000 Sold
-
2019-01-19status Under Contract
-
2018-11-18$1,500,000 New
ⓘ Source: listings_history table (triggers on properties + properties_extension) + one-shot
backfill from property_details.listing_events for pre-trigger history.
Climate risk First Street
- Flood 1/10 Low FEMA zone X (unshaded) · 0% chance over 30 yrs
- Wildfire 1/10 Low
- Heat 6/10 Major 7 d/yr ≥104°F today · 18 d/yr by 30 yrs out
- Wind 5/10 Major 25% chance of damaging wind over 30 yrs
- Air quality 4/10 Moderate 5 unhealthy d/yr today · 7 by 30 yrs out
Nearby sold comps map
Loading sold comps map…
Walkable amenities ~0.75 mi
Loading nearby amenities…
Taxation est. · year 1
- Rental income
- $243,816
- − Mortgage interest
- −$92,426
- − Property taxes
- −$24,750
- − Insurance
- −$8,250
- − Repairs & maintenance
- −$19,505
- − Management
- −$19,505
- − Depreciation
- −$48,000
- Taxable income
- $31,380
- Est. tax owed @ 24.0%
- −$7,531
- After-tax cash flow
- $48,250/yr
For passive investors: Depreciation is non-cash, so a rental often shows a tax loss while cash-flowing — sheltering income. Rental losses are passive: they offset passive income freely, and up to $25,000/yr can offset ordinary (W-2) income if you actively participate and your MAGI is under $100k (phasing out to $0 by $150k); unused losses carry forward. On sale, claimed depreciation is recaptured at up to 25%, and gains may owe capital-gains tax (a 1031 exchange can defer both). Figures are a year-1 estimate at your 24.0% rate — not tax advice; consult a CPA.
Schools (NCES district)
- District
- Atlanta Public Schools
- NCES district ID
- 1300120
- Math proficiency
- 28% ▼ -6.00%
- Reading proficiency
- 35% ▼ -2.00%
- Median HH income
- $48,306
- Composite
- 27.27/100
- National rank
- #7006
- State rank
- #80 of 174 in GA
Livability — Atlanta
- Score
- 83/100
- State rank
- #6
- US rank
- #919
Category grades
Schools grade is shown separately in the Schools card above.
Census & demographics
- Census place
- Atlanta, GA
- County
- Fulton County · 1,094,430 people
- City population
- 629,525
- Metro
- Atlanta-Sandy Springs-Alpharetta, GA
- Population (ZIP)
- 32,479
- Household income
- $114,072
- Rent vs Own
- Severe rent burden
- 2135.0
Population outlook (Fulton County) Hauer SSP2
- Today (2025)
- 1,203,707 people
- By 2030
- 1,299,706 · +8.0%
- By 2040
- 1,488,256 · +23.6%
- By 2050
- 1,664,580 · +38.3%
- By 2075
- 2,036,072 · +69.2%
- By 2100
- 2,222,402 · +84.6%
Race, ethnicity, and origin ACS 2023
- Neighborhood character
- Diverse neighborhood (Simpson 0.57)
- Race & ethnicity
- White 62% Black 14% Asian 9% Hispanic / Latino 8% Two or more races 8%
- Hispanic origin (detail)
- Mexican 2% Puerto Rican 2%
- Common ancestry
- Slovak 3% Romanian 2% Lithuanian 2%
- Foreign-born
- 15% · Canada, China, South Korea
- Languages at home
- 83% English-only · Spanish 5% Other Indo-European 4% Chinese 3%
Political lean MEDSL · Fulton
- 2024 margin
- Solid D (+44.9) · D 71.9% · R 27.0% · Other 1.1%
- 2008→2024 swing
- +9.8pp toward D · 2008: 35.0pp · 2024: 44.9pp
- All cycles
- 2024: D+44.9 2020: D+46.4 2016: D+42.1 2012: D+29.6 2008: D+35.0
Not yet ingested
- Civics
- —
Market trends
- HPI YoY
- ▼ -561.75%
- Current HPI
- 156.3796
- Rent YoY
- ▲ 3.09%
- Metro
- Atlanta-Sandy Springs-Alpharetta, GA
- State GDP YoY
- ▲ 2.66%
- F500 in state
- 28
Industry mix (Fortune 500 HQ in GA)
| Industry | F500 HQs | Revenue |
|---|---|---|
| Paper / Packaging | 2 | $29B |
|
||
| Retail | 1 | $160B |
|
||
| Transportation / Logistics | 1 | $91B |
|
||
| Airlines | 1 | $62B |
|
||
| Consumer Goods | 1 | $47B |
|
||
| Utilities | 1 | $25B |
|
||
Price history
+10.0% since first listed28 events — show timeline
- 2026-05-20 Price Changed $1,650,000 GAMLS
- 2026-05-20 Price Changed $1,650,000 FMLS
- 2026-04-16 Relisted — GAMLS
- 2026-04-15 Listing Removed — GAMLS
- 2026-01-29 Listing Removed — GAMLS
- 2026-01-29 Listed $1,950,000 FMLS
- 2026-01-29 Listed $1,950,000 GAMLS
- 2025-11-04 Listing Removed — FMLS
- 2025-11-04 Listing Removed — GAMLS
- 2025-11-04 Listed $2,050,000 GAMLS
- 2025-10-06 Listed $2,100,000 FMLS
- 2025-10-06 Listed $2,100,000 GAMLS
- 2025-09-30 Coming Soon — GAMLS
- 2025-09-24 Coming Soon — FMLS
- 2024-11-17 Rental Removed $1,198 RENTALBEAST
- 2024-11-16 Listed for Rent $1,198 RENTALBEAST
- 2024-09-17 Rental Removed $1,275 RENTALBEAST
- 2024-09-17 Rental Removed $1,275 RENTALBEAST
- 2024-09-17 Listed for Rent $1,275 RENTALBEAST
- 2024-09-17 Listed for Rent $1,685 RENTALBEAST
- 2024-09-17 Rental Removed $1,250 RENTALBEAST
- 2024-09-05 Listed for Rent $1,250 RENTALBEAST
- 2024-08-23 Rental Removed $1,275 RENTALBEAST
- 2024-08-04 Price Changed $1,275 RENTALBEAST
- 2024-08-02 Listed for Rent $1,350 RENTALBEAST
- 2019-02-14 Sold (MLS) $1,075,000 GAMLS
- 2019-01-19 Pending — GAMLS
- 2018-11-18 Listed $1,500,000 GAMLS
Cash-flow waterfall
monthlySold comps — $/sqft
last 12 mo · ≤1 miLoading sold comps…