1196 W Hancock Ave W #1 · Athens-Clarke County unified government (balance), GA
Flood risk 1/10 · Minimal
- FEMA flood zone
- X (unshaded)
- Chance of flooding over 30 yrs
- 0.0%
- Est. flood insurance / yr
- $507 – $1,088
Fire risk 1/10 · Minimal
- Est. fire insurance / yr
- $963 – $1,789
Heat risk 6/10 · Moderate
- Hot days now (above 106°F)
- 7 days/yr
- Hot days in 30 yrs
- 17 days/yr
Wind risk 5/10 · Moderate
- Chance of severe wind over 30 yrs
- 25.0%
Air-quality risk 3/10 · Minor
- Unhealthy air days now
- 4 days/yr
- Unhealthy air days in 30 yrs
- 4 days/yr
Risk factors via First Street. Map © Google.
Why this score? — see what drove the D grade
The composite is a weighted blend of 9 inputs, each scored 0–100. Each bar is that input's sub-score; the figure is the points it added to the 100-point composite (weight × sub-score).
- Cash flow +15.8/30.0
- ARV discount +7.5/15.0
- DSCR +4.9/10.0
- 1% rule +4.3/10.0
- Rent growth +2.9/5.0
- Livability +2.5/5.0
- Condition / age +2.5/5.0
- Schools +1.6/10.0
- Appreciation +0.0/10.0
$275,000
🖨 Deal sheet 📄 Offer letter ✓ Due diligence
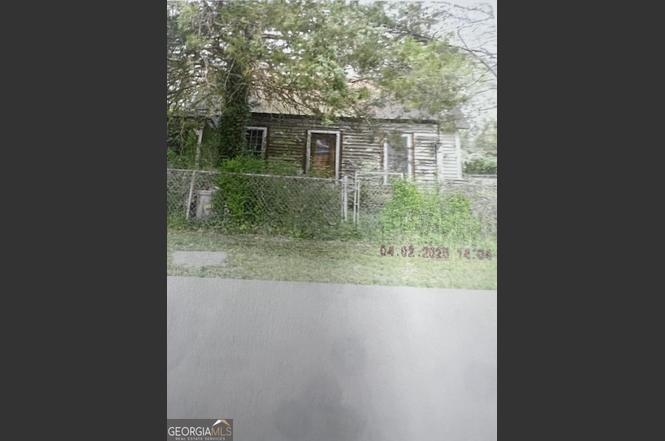
Listing remarks
Rara opportunity to buy a property located in the Historic Hancock Avenue District. This is a highly sought after area in downtown Athens GA. The property is in need of much needed repair.
Key facts
- Downtown athens ga
- 6,534 sq ft lot
- Built 1919
Tags
Neighborhood map
What this means for you Summary
Snapshot
- This is a 2-bed/1.0-bath single-family listed at $275k.
Deal economics
- At list price, monthly cash flow is $128 ($2k/yr) — positive.
- The deal already cash-flows at list — no discount required.
- To meet the 1% rule (rent ≥ 1% of price), the offer needs to be $257k (6.6% below list).
- Recommended offer: $242k (12.0% below list) — sets the bar for market timing.
- Cap rate 6.9% vs local median 3.3% in Athens-Clarke County unified government (balance) — top-decile yield for the area; either an underpriced asset or a hidden risk that comps aren't pricing in. Stress-test before assuming the spread holds.
Location & tenants
- Location reads: area grade D — affects rentability + tenant quality, not the cash-flow math above.
- Clarke County (urban): math 17% / reading 21% proficiency, ranked #146 of 174 in GA (top 84%) — low school quality limits family demand, transient renter base, plan for 1-2y turnover; 74% free/reduced lunch — lower-income household profile, screen leases tightly.
- Zoned schools: Clarke Middle School (math 22% / reading 32%, grade F, #271 of 470 statewide, top 60%, 708 students, 83% FRL); Clarke Central High School (math 15% / reading 24%, grade F, #238 of 424 statewide, top 57%, 1,836 students, 83% FRL).
- Market conditions: Rents rising (+1.6%/yr); 317 active listings in the ZIP; 11 comparable units currently listed for rent nearby; rentals lingering (median 44d on market — plan ~5-8 weeks vacancy on turnover, expect pricing pressure); 64% of comp listings sitting > 30 days — soft ceiling on asking rent; 1,172 units permitted in Clarke County in 2024 (876 in 5+ unit buildings).
- At $2,568/mo this rent would consume 49% of the median local household income ($63k/yr) (locally 3510% of renters already pay >50% of income on rent) — very limited rent-growth headroom before tenants either downsize or default.
Forward outlook
- Local home prices are declining (-3.0%/yr); year-one equity from $2k of loan paydown is wiped out by about $8k of value loss. Plan a longer hold.
- Clarke County population projected at +31% by 2050 — long-run rental-demand tailwind backs the buy-and-hold thesis.
Negotiation context
- It's been on market 227 days — a 12% lower offer ($242k) is reasonable based on typical stale-listing flexibility.
- 2 sale attempts with the ask held roughly flat each time — persistent listings suggest the price (not the market) is what's stuck; bring a comps-based counter.
Risks & watch-outs
- Watch-outs: built in 1919 — expect roof / HVAC / electrical / plumbing capex.
- Climate carrying-cost: moderate wind risk, 25% chance of damaging wind over 30y; extreme-heat days projected 7→17/yr by 2055 (HVAC capex compounding) — expect insurance premiums to compound above CPI over the hold.
Questions for the listing agent
- It's been on market 227 days. Have you received any prior offers? Is the seller open to a 12% concession, seller financing, or rate buy-down credit?
- Built in 1919 — when were the roof, HVAC, electrical panel, plumbing, and water heater last replaced?
- Why hasn't it sold? Are there any deal-killer items the seller is aware of (foundation, flood, title, zoning, code violations)?
- Is there a deadline driving the sale (1031 exchange, divorce, estate, relocation)? That informs how much negotiation room exists.
- The area grade is low — what's the realistic commute time and amenity access for the typical tenant pool here? Any planned neighborhood developments (good or bad) we should know about?
- What's the average days-on-market for RENTAL listings here right now (not sales)? A rising rental-DOM trend means longer vacancies and softer asking-rent achievability than the comps imply.
- What's the recent tenant-quality profile in this submarket — average credit score on applications, eviction rate, late-payment / NSF rate, and stable-employment percentage? A property-management company in the area should have these aggregated.
- How much new for-sale + rental construction is in the pipeline within 1–3 miles? Heavy new supply typically softens prices + rents 12–24 months out; constrained supply supports both.
Investment metrics
- 1% rule
- 0.93% ✗
- Cap rate
- 6.85%
- Cash-on-cash
- 2.00%
- DSCR
- 1.09
- GRM
- 8.9
CMA / ARV
- ARV (on-the-fly)
- $718,448
- Comps found
- 5
Show comp detail 5 sales within ~0.75 mi
| Address | Dist | Beds/Ba | Sqft | Sold | Price | $/sf | Match |
|---|---|---|---|---|---|---|---|
| 100 Crestview Cir | 0.53mi | 3/2.5 (+1) | 2,103 (-3%) | 6mo | $670,000 | $319 | 54 |
| 271 King Ave | 0.37mi | 3/3.5 (+1) | 2,316 (+7%) | 3mo | $770,000 | $332 | 54 |
| 283 King Ave | 0.38mi | 3/2.5 (+1) | 1,926 (-11%) | 6mo | $696,980 | $362 | 48 |
| 214 Evans St | 0.65mi | 3/3.5 (+1) | 1,900 (-12%) | 9mo | $362,000 | $191 | 27 |
| 145 Satula Ave | 0.74mi | 3/3.5 (+1) | 2,476 (+14%) | 0mo | $885,000 | $357 | 26 |
Match score weights: distance 35% · size 25% · config 20% · recency 20%. Top-matched comps best support the ARV.
Projected returns pro-forma
-3.0% appreciation · 1.58% rent growth · sell at horizon
- IRR
- -14.7%
- Equity multiple
- 0.48×
- Total profit
- $-39,966
- Equity at exit
- $41,003
- IRR
- -8.6%
- Equity multiple
- 0.50×
- Total profit
- $-38,545
- Equity at exit
- $23,777
Cash invested: $77,000 (down + closing). Projections, not guarantees.
Landlord ↔ Tenant lean methodology
- Overall (STATE)
- 90 Strongly Landlord-Friendly
- State Georgia
- 90 Strongly Landlord-Friendly · R+3
- County
- — inherits STATE
- City
- — inherits STATE
ZIP-level market 30606
- Rents YoY
- 1.6%
- Active inventory
- 317
- Price-to-rent
- 8.9×
Monthly cashflow live
- Estimated rent
- $2,568 high interval (Pro) →
- Mortgage (P&I)
- −$1,442
- Tax est. 1.5%
- −$344 /mo · $4,125/yr
- Insurance
- −$115
- HOA
- −$0
- Vacancy / Maint / Mgmt
- −$539
- Net cashflow
- $128
Break-even live
UW: 25.0% down · 7.5% · 30yr · 1.5% tax · 5.0% vac · 8.0% maint · 8.0% mgmt
Financing live
Cash to close
- Down payment
- $68,750
- Closing costs
- $8,250
- Reserves months
- —
- Total cash needed
- —
Loan-product check · same deal, 3 products live
Conventional
25% down · 7.5% · 30yr
- Down + closing
- —
- Monthly P&I
- —
- Monthly cashflow
- —
- DSCR
- —
- Eligible?
- —
Personal DTI + credit; lowest rate.
DSCR
20% down · 8.5% · 30yr
- Down + closing
- —
- Monthly P&I
- —
- Monthly cashflow
- —
- DSCR
- —
- Eligible?
- —
No personal income docs; deal must DSCR.
Hard money
10% down · 12.0% · 12mo
- Down + closing
- —
- Monthly P&I
- —
- Monthly cashflow
- —
- DSCR
- —
- Eligible?
- —
Short-term bridge; refi at stabilization.
Rent comps 11 comps
| Address | Beds | Baths | Sqft | Rent | $/sqft | DOM | Units | Dist |
|---|---|---|---|---|---|---|---|---|
| 382 N Chase St Athens, GA | 3.0 | 3.5 | 1512 | $3,250 | $2.15 | 13d | 1 | 0.12mi |
| 449 Reese St Athens, GA | 3.0 | 2.5 | 1844 | $3,100 | $1.68 | 21d | 1 | 0.45mi |
| 172 Hart Ave Athens, GA | 2.0 | 1.0 | 2156 | $1,200 | $0.56 | 43d | 1 | 0.51mi |
| 48 Holman Ave Athens, GA | 3.0 | 2.0 | 1850 | $2,000 | $1.08 | 13d | 1 | 0.52mi |
| 325 Lyndon Ave Athens, GA | 3.0 | 2.5 | 1547 | $3,100 | $2.00 | 43d | 1 | 0.59mi |
| 335 Lyndon Ave Athens, GA | 3.0 | 3.0 | 2200 | $3,000 | $1.36 | 43d | 1 | 0.60mi |
| 214 Evans St Athens, GA | 3.0 | 3.5 | 1900 | $2,700 | $1.42 | 43d | 1 | 0.63mi |
| 400 E Clayton St Unit 17 Athens, GA | 3.0 | 2.0 | 2000 | $705 | $0.35 | 43d | 1 | 1.11mi |
| 492 N Thomas St Unit NT482 Athens, GA | 3.0 | 3.0 | 1500 | $2,900 | $1.93 | 43d | 1 | 1.16mi |
| 600 N Thomas St Athens, GA | 3.0–5.0 | 3.0–5.0 | 1414 | $944 | $0.67 | 21d | 31 | 1.23mi |
| 215 Ruth St Athens, GA | 3.0 | 3.5 | 1522 | $2,250 | $1.48 | 43d | 1 | 1.46mi |
Listing history 4 events
-
2026-04-28status Under Contract
-
2026-04-01status Back On Market
-
2026-03-14status Under Contract
-
2025-08-21$275,000 New
ⓘ Source: listings_history table (triggers on properties + properties_extension) + one-shot
backfill from property_details.listing_events for pre-trigger history.
Climate risk First Street
- Flood 1/10 Low FEMA zone X (unshaded) · 0% chance over 30 yrs
- Wildfire 1/10 Low
- Heat 6/10 Major 7 d/yr ≥106°F today · 17 d/yr by 30 yrs out
- Wind 5/10 Major 25% chance of damaging wind over 30 yrs
- Air quality 3/10 Moderate 4 unhealthy d/yr today · 4 by 30 yrs out
Nearby sold comps map
Loading sold comps map…
Walkable amenities ~0.75 mi
Loading nearby amenities…
Taxation est. · year 1
- Rental income
- $30,818
- − Mortgage interest
- −$15,404
- − Property taxes
- −$4,125
- − Insurance
- −$1,375
- − Repairs & maintenance
- −$2,465
- − Management
- −$2,465
- − Depreciation
- −$8,000
- Taxable loss
- −$3,017
- Est. tax savings @ 24.0%
- +$724
- After-tax cash flow
- $2,265/yr
For passive investors: Depreciation is non-cash, so a rental often shows a tax loss while cash-flowing — sheltering income. Rental losses are passive: they offset passive income freely, and up to $25,000/yr can offset ordinary (W-2) income if you actively participate and your MAGI is under $100k (phasing out to $0 by $150k); unused losses carry forward. On sale, claimed depreciation is recaptured at up to 25%, and gains may owe capital-gains tax (a 1031 exchange can defer both). Figures are a year-1 estimate at your 24.0% rate — not tax advice; consult a CPA.
Schools (NCES district)
- District
- Clarke County
- NCES district ID
- 1301170
- Math proficiency
- 17% ▼ -15.00%
- Reading proficiency
- 21% ▼ -12.00%
- Median HH income
- $33,649
- Composite
- 15.51/100
- National rank
- #9302
- State rank
- #146 of 174 in GA
Livability — Athens-Clarke County unified government (balance)
No livability data for this city. (Only ~50 U.S. cities are tracked.)
Census & demographics
- Census place
- Athens-Clarke County unified government (balance), GA
- County
- Clarke County · 126,008 people
- City population
- 119,110
- Metro
- Athens-Clarke County, GA
- Population (ZIP)
- 47,865
- Household income
- $63,328
- Rent vs Own
- Severe rent burden
- 3510.0
Population outlook (Clarke County) Hauer SSP2
- Today (2025)
- 141,365 people
- By 2030
- 151,724 · +7.3%
- By 2040
- 168,541 · +19.2%
- By 2050
- 184,855 · +30.8%
- By 2075
- 221,736 · +56.9%
- By 2100
- 253,853 · +79.6%
Race, ethnicity, and origin ACS 2023
- Neighborhood character
- Diverse neighborhood (Simpson 0.58)
- Race & ethnicity
- White 61% Black 20% Hispanic / Latino 11% Two or more races 7% Asian 5%
- Hispanic origin (detail)
- Mexican 7%
- Common ancestry
- Italian 3% Slovak 3% Lithuanian 2%
- Foreign-born
- 11% · Canada, China, Philippines
- Languages at home
- 87% English-only · Spanish 7% Other Asian/Pacific 2% Chinese 1%
Political lean MEDSL · Clarke
- 2024 margin
- Solid D (+38.3) · D 68.6% · R 30.4% · Other 1.0%
- 2008→2024 swing
- +7.0pp toward D · 2008: 31.3pp · 2024: 38.3pp
- All cycles
- 2024: D+38.3 2020: D+42.1 2016: D+38.0 2012: D+28.9 2008: D+31.3
Not yet ingested
- Civics
- —
Market trends
- HPI YoY
- ▼ -454.63%
- Current HPI
- 258.4817
- Rent YoY
- ▲ 1.58%
- Metro
- Athens-Clarke County, GA
- State GDP YoY
- ▲ 2.66%
- F500 in state
- 28
Industry mix (Fortune 500 HQ in GA)
| Industry | F500 HQs | Revenue |
|---|---|---|
| Paper / Packaging | 2 | $29B |
|
||
| Retail | 1 | $160B |
|
||
| Transportation / Logistics | 1 | $91B |
|
||
| Airlines | 1 | $62B |
|
||
| Consumer Goods | 1 | $47B |
|
||
| Utilities | 1 | $25B |
|
||
Price history
4 events — show timeline
- 2026-04-28 Pending — GAMLS
- 2026-04-01 Relisted — GAMLS
- 2026-03-14 Pending — GAMLS
- 2025-08-21 Listed $275,000 GAMLS
Cash-flow waterfall
monthlySold comps — $/sqft
last 12 mo · ≤1 miLoading sold comps…