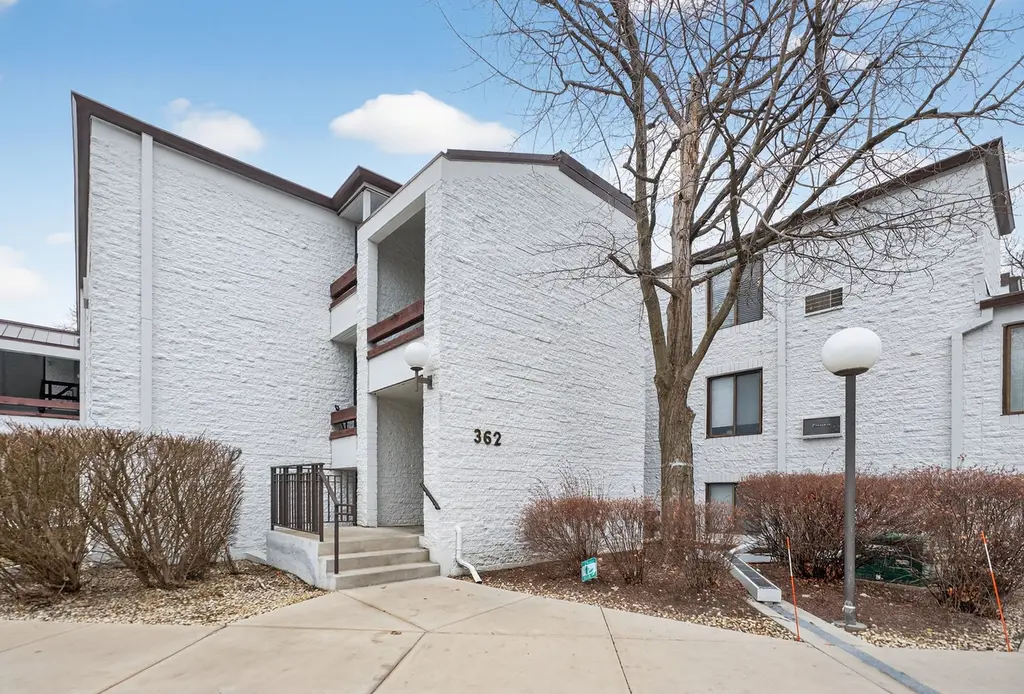
362 W Miner St Unit 1A · Arlington Heights, IL
Flood risk 4/10 · Minor
- FEMA flood zone
- X (unshaded)
- Chance of flooding over 30 yrs
- 0.22%
- Est. flood insurance / yr
- $507 – $1,088
Fire risk 1/10 · Minimal
- Est. fire insurance / yr
- $804 – $1,492
Heat risk 3/10 · Minor
- Hot days now (above 100°F)
- 7 days/yr
- Hot days in 30 yrs
- 14 days/yr
Wind risk 2/10 · Minimal
- Chance of severe wind over 30 yrs
- 0.0%
Air-quality risk 3/10 · Minor
- Unhealthy air days now
- 3 days/yr
- Unhealthy air days in 30 yrs
- 4 days/yr
Risk factors via First Street. Map © Google.
Why this score? — see what drove the D grade
The composite is a weighted blend of 9 inputs, each scored 0–100. Each bar is that input's sub-score; the figure is the points it added to the 100-point composite (weight × sub-score).
- Cash flow +12.0/30.0
- ARV discount +7.5/15.0
- 1% rule +6.0/10.0
- Livability +4.1/5.0
- Condition / age +4.0/5.0
- Schools +3.9/10.0
- DSCR +3.5/10.0
- Rent growth +1.3/5.0
- Appreciation +0.0/10.0
$189,900
🖨 Deal sheet 📄 Offer letter ✓ Due diligence
Listing remarks
Prime location and move-in ready! Just steps from the Metra, dining, and shopping, this spacious first-floor condo features porcelain tile flooring and an updated kitchen with modern cabinets, stainless steel appliances, and newer countertops. Enjoy a private patio accessible from both the living room and bedroom-perfect for relaxing. The large bedroom offers ample closet space, and the bathroom is updated with new tile. Includes two newer AC units, electric heat, on-site laundry, and two parking spaces. HOA allows rentals-ideal for homeowners or investors. Quick close available!
Key facts
- Modern cabinetry
- Private patio
- Updated kitchen
Tags
Property features AI
Finance
- Other: Building contains 6 units; Living area reported as estimated; Property offers commuter transportation access via train
- HOA & community: Monthly association fee ($387); Association fee includes water, parking, insurance, TV/cable, lawn care, trash collection, and snow removal; Association amenities: coin laundry and storage; Manager off-site; Pets allowed (cats and dogs)
Exterior
- Parking: Assigned parking for 2 vehicles
- Utilities: Public water; Public sewer
- Home design: Attached single condo; Entry level: 1; Condo ownership
- Construction: Brick construction; Estimated age: 41–50 years; Built before 1978: No
- Exterior features: Common lot/grounds
Interior
- Kitchen: Kitchen on main level with ceramic tile flooring (approx. 12 x 6)
- Bedrooms: 1 bedroom (master bedroom on main level); Additional rooms listed as Bedroom 2, Bedroom 3, Bedroom 4
- Flooring: Porcelain tile in living room and master bedroom; Ceramic tile in kitchen
- Bathrooms: 1 full bathroom
- Heating & cooling: Baseboard heating; Window air conditioning units
- Interior features: 3 total rooms; School bus service and commuter train access
- Laundry & utility: Laundry in common area; Laundry room included
Neighborhood map
What this means for you Summary
Snapshot
- This is a 1-bed/1.0-bath condo listed at $190k. Condition is rated good.
Deal economics
- At list price, monthly cash flow is $-45 ($-545/yr) — negative.
- To cash-flow at today's rent, offer at most $183k (3.5% below list).
- Meets the 1% rule at list price ($2k rent vs $190k).
- Recommended offer: $183k (3.5% below list) — sets the bar for cash-flow.
- Cap rate 6.0% vs local median 2.9% in Arlington Heights — top-decile yield for the area; either an underpriced asset or a hidden risk that comps aren't pricing in. Stress-test before assuming the spread holds.
Location & tenants
- Location reads 82/100 on livability (#60 in IL, #1,055 nationally) — a professional / high-income tenant draw. Strengths: crime A+, commute A+, employment A+; Watch: health & safety D+, amenities F, cost of living F.
- Township Hsd 214 (suburban): math 42% / reading 45% proficiency, ranked #103 of 620 in IL (top 17%) — families likely to look elsewhere, expect single-tenant / working-renter base with shorter leases.
- Zoned schools: Rolling Meadows High School (math 35% / reading 39%, grade F, #107 of 693 statewide, top 17%, 2,044 students, 0% FRL).
- Market conditions: Rents falling (-5.0%/yr); 68 active listings in the ZIP; 24 comparable units currently listed for rent nearby; rentals leasing fast (median 8d on market — plan ~1-2 weeks tenant-placement turnaround); solid renter incomes; 6,272 units permitted in Cook County in 2024 (4,658 in 5+ unit buildings).
Forward outlook
- Local home prices are declining (-3.0%/yr); year-one equity from $1k of loan paydown is wiped out by about $6k of value loss. Plan a longer hold.
Negotiation context
- It's been on market 50 days — a 3% lower offer ($184k) is reasonable based on typical stale-listing flexibility.
Questions for the listing agent
- What do current leases actually rent for vs. the listed asking? Can we see a recent rent roll and the last 12 months of T-12 income?
- It's been on market 50 days. Have you received any prior offers? Is the seller open to a 3% concession, seller financing, or rate buy-down credit?
- Built in 1978 — when were the roof, HVAC, electrical panel, plumbing, and water heater last replaced?
- What does the HOA fee cover, when was the last increase, and are there any pending special assessments or reserve-fund shortfalls?
- Any open or pending special assessments — roof, HVAC, plumbing, elevator, façade? What's the per-unit balance and payoff schedule, and is the seller paying it off at close or rolling it to the buyer?
- Is there a deadline driving the sale (1031 exchange, divorce, estate, relocation)? That informs how much negotiation room exists.
- Schools are A-rated — typically a magnet for longer-tenancy family renters. What's the average tenant stay here, and is there a school-zone premium baked into asking?
- The area grade is low — what's the realistic commute time and amenity access for the typical tenant pool here? Any planned neighborhood developments (good or bad) we should know about?
- What's the average days-on-market for RENTAL listings here right now (not sales)? A rising rental-DOM trend means longer vacancies and softer asking-rent achievability than the comps imply.
- What's the recent tenant-quality profile in this submarket — average credit score on applications, eviction rate, late-payment / NSF rate, and stable-employment percentage? A property-management company in the area should have these aggregated.
- How much new apartment / multifamily construction is in the pipeline within 1–3 miles? Heavy new supply (>2% of stock underway) typically softens rents 12–24 months out; light construction supports rent growth.
Investment metrics
- 1% rule
- 1.10% ✓
- Cap rate
- 6.01%
- Cash-on-cash
- -1.03%
- DSCR
- 0.95
- GRM
- 7.6
CMA / ARV
No comps found within radius.
Projected returns pro-forma
-3.0% appreciation · 0.0% rent growth · sell at horizon
- IRR
- -22.3%
- Equity multiple
- 0.26×
- Total profit
- $-39,532
- Equity at exit
- $28,315
- IRR
- -31.2%
- Equity multiple
- -0.14×
- Total profit
- $-60,767
- Equity at exit
- $16,419
Cash invested: $53,172 (down + closing). Projections, not guarantees.
Landlord ↔ Tenant lean methodology
- Overall (STATE)
- 43 Moderately Tenant-Leaning
- State Illinois
- 43 Moderately Tenant-Leaning · D+7
- County
- — inherits STATE
- City
- — inherits STATE
ZIP-level market 60005
- Rents YoY
- -5.0%
- Active inventory
- 68
- Price-to-rent
- 7.6×
Monthly cashflow live
- Estimated rent
- $2,094 high interval (Pro) →
- Mortgage (P&I)
- −$996
- Tax est. 1.5%
- −$237 /mo · $2,848/yr
- Insurance
- −$79
- HOA
- −$387
- Vacancy / Maint / Mgmt
- −$440
- Net cashflow
- $-45
Break-even live
UW: 25.0% down · 7.5% · 30yr · 1.5% tax · 5.0% vac · 8.0% maint · 8.0% mgmt
Financing live
Cash to close
- Down payment
- $47,475
- Closing costs
- $5,697
- Reserves months
- —
- Total cash needed
- —
Loan-product check · same deal, 3 products live
Conventional
25% down · 7.5% · 30yr
- Down + closing
- —
- Monthly P&I
- —
- Monthly cashflow
- —
- DSCR
- —
- Eligible?
- —
Personal DTI + credit; lowest rate.
DSCR
20% down · 8.5% · 30yr
- Down + closing
- —
- Monthly P&I
- —
- Monthly cashflow
- —
- DSCR
- —
- Eligible?
- —
No personal income docs; deal must DSCR.
Hard money
10% down · 12.0% · 12mo
- Down + closing
- —
- Monthly P&I
- —
- Monthly cashflow
- —
- DSCR
- —
- Eligible?
- —
Short-term bridge; refi at stabilization.
Rent comps 24 comps
| Address | Beds | Baths | Sqft | Rent | $/sqft | DOM | Units | Dist |
|---|---|---|---|---|---|---|---|---|
| 205 W Miner St #208 Arlington Heights, IL | 2.0 | 2.0 | 1050 | $2,175 | $2.07 | 24d | 1 | 0.10mi |
| 151 W Wing St #609 Arlington Heights, IL | 1.0 | 1.0 | 976 | $2,600 | $2.66 | 24d | 1 | 0.16mi |
| 202 N Salem Ave Unit 6B Arlington Heights, IL | 1.0 | 1.0 | 700 | $1,500 | $2.14 | 17d | 1 | 0.25mi |
| 55 S Vail Ave Unit 1509 Arlington Heights, IL | — | 1.0 | 600 | $2,039 | $3.40 | 2d | 1 | 0.28mi |
| 7 W Campbell St Unit 5 Arlington Heights, IL | 1.0 | 1.0 | 650 | $1,350 | $2.08 | 7d | 1 | 0.29mi |
| 55 S Vail Ave Arlington Heights, IL | 1.0 | 1.0 | 785 | $2,167 | $2.76 | 22d | 1 | 0.31mi |
| 55 S Vail Ave Arlington Heights, IL | — | 1.0 | 600 | $2,021 | $3.37 | 3d | 1 | 0.31mi |
| 55 S Vail Ave Arlington Heights, IL | 1.0 | 1.0 | 800 | $2,268 | $2.83 | 17d | 1 | 0.31mi |
| 18 E Northwest Hwy Unit 5 Arlington Heights, IL | 1.0 | 1.0 | 550 | $1,350 | $2.45 | 18d | 1 | 0.31mi |
| 200 N Arlington Heights Rd Unit 1-0505 Arlington Heights, IL | 1.0 | 1.0 | 677 | $2,343 | $3.46 | 5d | 1 | 0.36mi |
| 200 N Arlington Heights Rd Unit 1-0507 Arlington Heights, IL | 1.0 | 1.0 | 850 | $2,593 | $3.05 | 4d | 1 | 0.36mi |
| 200 N Arlington Heights Rd Unit 1-1003 Arlington Heights, IL | 1.0 | 1.0 | 850 | $2,510 | $2.95 | 7d | 1 | 0.36mi |
| 200 N Arlington Heights Rd Unit 2-0513 Arlington Heights, IL | 1.0 | 1.0 | 677 | $2,312 | $3.42 | 5d | 1 | 0.36mi |
| 200 N Arlington Heights Rd Unit 1-0406 Arlington Heights, IL | 1.0 | 1.0 | 677 | $2,164 | $3.20 | 5d | 1 | 0.36mi |
| 200 N Arlington Heights Rd Unit 2-0622 Arlington Heights, IL | 1.0 | 1.0 | 850 | $2,501 | $2.94 | 7d | 1 | 0.36mi |
| 200 N Arlington Heights Rd Unit 2-0604 Arlington Heights, IL | 1.0 | 1.0 | 677 | $2,277 | $3.36 | 4d | 1 | 0.36mi |
| 200 N Arlington Heights Rd Arlington Heights, IL | 1.0 | 1.0 | 850 | $2,530 | $2.98 | 21d | 1 | 0.37mi |
| 200 N Arlington Heights Rd Arlington Heights, IL | 2.0 | 2.0 | 975 | $2,928 | $3.00 | 3d | 1 | 0.37mi |
| 180 N Arlington Heights Rd Arlington Heights, IL | 2.0 | 1.0–2.0 | 868 | $2,711 | $3.12 | 1d | 28 | 0.38mi |
| 110 S Dunton Ave Unit 3I Arlington Heights, IL | 1.0 | 1.0 | 1000 | $2,000 | $2.00 | 7d | 1 | 0.40mi |
| 728 N Kennicott Ave Arlington Heights, IL | 2.0 | 1.0 | 1013 | $2,800 | $2.76 | 21d | 1 | 0.57mi |
| 4 N Hickory Ave Arlington Heights, IL | 1.0 | 1.0 | 726 | $2,275 | $3.13 | 7d | 1 | 0.72mi |
| 829 S Dwyer Ave Unit D Arlington Heights, IL | 2.0 | 1.0 | 1000 | $1,800 | $1.80 | 7d | 1 | 1.13mi |
| 1206 E Fairview St #305 Arlington Heights, IL | 2.0 | 2.0 | 1100 | $2,200 | $2.00 | 24d | 1 | 1.28mi |
HOA detail condo
- Monthly dues
- $387 · $4,644/yr
- Likely covers
- electric
- Assessments
- None detected in remarks — confirm with the listing agent.
Listing history 5 events
-
2026-05-09status Pending
-
2026-04-26historical Contingent - Continue to Show
-
2026-03-31price $189,900
-
2026-03-19$199,900 Active
-
2026-03-04historical
ⓘ Source: listings_history table (triggers on properties + properties_extension) + one-shot
backfill from property_details.listing_events for pre-trigger history.
Climate risk First Street
- Flood 4/10 Moderate FEMA zone X (unshaded) · 22% chance over 30 yrs
- Wildfire 1/10 Low
- Heat 3/10 Moderate 7 d/yr ≥100°F today · 14 d/yr by 30 yrs out
- Wind 2/10 Low 0% chance of damaging wind over 30 yrs
- Air quality 3/10 Moderate 3 unhealthy d/yr today · 4 by 30 yrs out
Nearby sold comps map
Loading sold comps map…
Walkable amenities ~0.75 mi
Loading nearby amenities…
Taxation est. · year 1
- Rental income
- $25,123
- − Mortgage interest
- −$10,637
- − Property taxes
- −$2,848
- − Insurance
- −$950
- − Repairs & maintenance
- −$2,010
- − Management
- −$2,010
- − HOA
- −$4,644
- − Depreciation
- −$5,524
- Taxable loss
- −$3,501
- Est. tax savings @ 24.0%
- +$840
- After-tax cash flow
- $295/yr
For passive investors: Depreciation is non-cash, so a rental often shows a tax loss while cash-flowing — sheltering income. Rental losses are passive: they offset passive income freely, and up to $25,000/yr can offset ordinary (W-2) income if you actively participate and your MAGI is under $100k (phasing out to $0 by $150k); unused losses carry forward. On sale, claimed depreciation is recaptured at up to 25%, and gains may owe capital-gains tax (a 1031 exchange can defer both). Figures are a year-1 estimate at your 24.0% rate — not tax advice; consult a CPA.
Condition & rehab AI · 6 photos
This move-in ready condo is in good condition with modern updates and a prime location. Minor exterior painting and window blind replacement would further enhance its curb appeal and value.
Value-add opportunities
- Both Paint exterior walls — Enhances curb appeal and resale value.
- Both Replace window blinds — Improves energy efficiency and aesthetics.
Renovation cost estimate screening
Value-add ROI direction
- Both Paint exterior walls — Enhances curb appeal and resale value. ↑
- Both Replace window blinds — Improves energy efficiency and aesthetics. ↑
ⓘ Cost ranges are severity-bucket heuristics (US national rule-of-thumb). Get contractor quotes + a written scope before underwriting a rehab budget.
Schools (NCES district)
- District
- Township Hsd 214
- NCES district ID
- 1704170
- Math proficiency
- 42% ▼ -10.00%
- Reading proficiency
- 45% ▼ -4.00%
- Median HH income
- $68,267
- Composite
- 39.13/100
- National rank
- #4035
- State rank
- #103 of 620 in IL
Livability — Arlington Heights
- Score
- 82/100
- State rank
- #60
- US rank
- #1055
Category grades
Schools grade is shown separately in the Schools card above.
Census & demographics
- Census place
- Arlington Heights, IL
- County
- Cook County · 4,486,803 people
- City population
- 80,678
- Metro
- Chicago-Naperville-Elgin, IL-IN-WI
- Population (ZIP)
- 28,843
- Household income
- $99,743
- Rent vs Own
- Severe rent burden
- 818.0
Population outlook (Cook County) Hauer SSP2
- Today (2025)
- 5,347,519 people
- By 2030
- 5,357,703 · +0.2%
- By 2040
- 5,324,924 · -0.4%
- By 2050
- 5,230,762 · -2.2%
- By 2075
- 4,785,735 · -10.5%
- By 2100
- 4,188,836 · -21.7%
Race, ethnicity, and origin ACS 2023
- Neighborhood character
- Predominantly White (71%)
- Race & ethnicity
- White 71% Hispanic / Latino 15% Two or more races 11% Asian 8% Black 3%
- Hispanic origin (detail)
- Mexican 6% Puerto Rican 5% Cuban 1%
- Common ancestry
- Romanian 13% French 3% Slovak 2%
- Foreign-born
- 26% · Canada, South Korea, China
- Languages at home
- 64% English-only · Russian/Polish/Slavic 13% Spanish 10% Other Indo-European 6%
Political lean MEDSL · Cook
- 2024 margin
- Solid D (+42.0) · D 70.4% · R 28.4% · Other 1.2%
- 2008→2024 swing
- -11.4pp toward R · 2008: 53.4pp · 2024: 42.0pp
- All cycles
- 2024: D+42.0 2020: D+50.3 2016: D+53.0 2012: D+49.4 2008: D+53.4
Not yet ingested
- Civics
- —
Market trends
- HPI YoY
- ▼ -301.88%
- Current HPI
- 209.777
- Rent YoY
- ▼ -4.96%
- Metro
- Chicago-Naperville-Elgin, IL-IN-WI
- State GDP YoY
- ▲ 1.59%
- F500 in state
- 60
Industry mix (Fortune 500 HQ in IL)
| Industry | F500 HQs | Revenue |
|---|---|---|
| Insurance | 4 | $201B |
|
||
| Consumer Goods | 4 | $87B |
|
||
| Industrial Machinery | 3 | $64B |
|
||
| Healthcare | 2 | $55B |
|
||
| Retail / Pharmacy | 1 | $148B |
|
||
| Agriculture / Food | 1 | $86B |
|
||
Price history
-5.0% since first listed5 events — show timeline
- 2026-05-09 Pending — MRED as Distributed by MLS Grid
- 2026-04-26 Contingent — MRED as Distributed by MLS Grid
- 2026-03-31 Price Changed $189,900 MRED as Distributed by MLS Grid
- 2026-03-19 Listed $199,900 MRED as Distributed by MLS Grid
- 2026-03-04 Listing Removed — MRED as Distributed by MLS Grid
Cash-flow waterfall
monthlySold comps — $/sqft
last 12 mo · ≤1 miLoading sold comps…