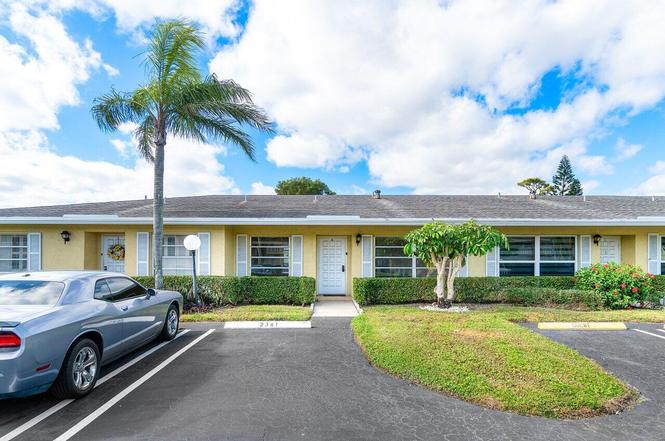
1031 Citrus Way Unit 102-B · Delray Beach, FL
Flood risk 1/10 · Minimal
- FEMA flood zone
- X (unshaded)
- Chance of flooding over 30 yrs
- 0.0%
- Est. flood insurance / yr
- $507 – $1,088
Fire risk 1/10 · Minimal
- Est. fire insurance / yr
- $947 – $1,759
Heat risk 10/10 · Severe
- Hot days now (above 105°F)
- 7 days/yr
- Hot days in 30 yrs
- 28 days/yr
Wind risk 10/10 · Severe
- Chance of severe wind over 30 yrs
- 99.0%
Air-quality risk 3/10 · Minor
- Unhealthy air days now
- 2 days/yr
- Unhealthy air days in 30 yrs
- 3 days/yr
Risk factors via First Street. Map © Google.
Why this score? — see what drove the C- grade
The composite is a weighted blend of 9 inputs, each scored 0–100. Each bar is that input's sub-score; the figure is the points it added to the 100-point composite (weight × sub-score).
- Cash flow +16.8/30.0
- 1% rule +10.0/10.0
- ARV discount +7.5/15.0
- DSCR +5.2/10.0
- Schools +4.3/10.0
- Livability +3.9/5.0
- Rent growth +3.0/5.0
- Condition / age +2.5/5.0
- Appreciation +0.0/10.0
$143,000
🖨 Deal sheet 📄 Offer letter ✓ Due diligence
Listing remarks
Nestled within the vibrant 55+ community of Pines of Delray, this charming villa offers a blend of comfort and convenience. Step inside to discover tastefully tiled floors that guide you through the main living area, where natural light dances across the upgraded kitchen. Solid wood cabinetry, sleek countertops, and a cozy breakfast nook create a perfect setting for morning routines. Relaxation beckons in the expansive living room, adorned with an upgraded fan and sliding glass doors leading to the inviting Florida room, complete with additional storage room. The oversized master bedroom boasts laminate flooring, a spacious walk-in closet, and serene windows complemented by upgraded treatme
Key facts
- Solid wood cabinetry
- Breakfast nook
- Tiled floors
Tags
Neighborhood map
What this means for you Summary
Snapshot
- This is a 2-bed/1.5-bath condo listed at $143k.
Deal economics
- At list price, monthly cash flow is $91 ($1k/yr) — positive.
- The deal already cash-flows at list — no discount required.
- Meets the 1% rule at list price ($2k rent vs $143k).
- Recommended offer: $134k (6.0% below list) — sets the bar for market timing.
- Cap rate 7.1% vs local median 4.3% in Delray Beach — top-decile yield for the area; either an underpriced asset or a hidden risk that comps aren't pricing in. Stress-test before assuming the spread holds.
Location & tenants
- Location reads 77/100 on livability (#202 in FL, #3,160 nationally) — a middle-class / working-renter tenant base. Strengths: housing A+, health & safety A+, commute A-; Watch: cost of living C-, crime D-, amenities F.
- Palm Beach (suburban): math 46% / reading 53% proficiency, ranked #34 of 73 in FL (top 47%) — families likely to look elsewhere, expect single-tenant / working-renter base with shorter leases.
- Zoned schools: Orchard View Elementary School (math 48% / reading 47%, grade D, #1,182 of 2,144 statewide, top 55%, 596 students, 76% FRL); Atlantic High School (math 28% / reading 52%, grade F, #296 of 667 statewide, top 45%, 1,889 students, 59% FRL) — zoned schools average 68% FRL vs 52% district-wide (16 pts higher); higher-poverty schools than district average — tighter screening recommended.
- Market conditions: Rents rising (+1.8%/yr); 354 active listings in the ZIP; 40 comparable units currently listed for rent nearby; rentals at typical pace (median 24d on market — plan ~3-4 weeks tenant-placement turnaround); solid renter incomes; 3,974 units permitted in Palm Beach County in 2024 (1,012 in 5+ unit buildings).
- This rent runs 34% of the median local income ($78k/yr) — at the standard rent-burdened threshold; future hikes will face affordability resistance.
Forward outlook
- Local home prices are declining (-3.0%/yr); year-one equity from $989 of loan paydown is wiped out by about $4k of value loss. Plan a longer hold.
- Palm Beach County population projected at +30% by 2050 — long-run rental-demand tailwind backs the buy-and-hold thesis.
Negotiation context
- It's been on market 77 days — a 6% lower offer ($134k) is reasonable based on typical stale-listing flexibility.
- 6 sale attempts with the ask held roughly flat each time — persistent listings suggest the price (not the market) is what's stuck; bring a comps-based counter.
- Current owner paid $47k; list at $143k implies a 204% gain — meaningful room to come down on a strong offer.
Risks & watch-outs
- Watch-outs: HOA is 28% of rent.
- Climate carrying-cost: severe wind risk, 99% chance of damaging wind over 30y; extreme-heat days projected 7→28/yr by 2055 (HVAC capex compounding) — expect insurance premiums to compound above CPI over the hold.
Questions for the listing agent
- It's been on market 77 days. Have you received any prior offers? Is the seller open to a 6% concession, seller financing, or rate buy-down credit?
- Built in 1978 — when were the roof, HVAC, electrical panel, plumbing, and water heater last replaced?
- What does the HOA fee cover, when was the last increase, and are there any pending special assessments or reserve-fund shortfalls?
- Any open or pending special assessments — roof, HVAC, plumbing, elevator, façade? What's the per-unit balance and payoff schedule, and is the seller paying it off at close or rolling it to the buyer?
- Why hasn't it sold? Are there any deal-killer items the seller is aware of (foundation, flood, title, zoning, code violations)?
- Is there a deadline driving the sale (1031 exchange, divorce, estate, relocation)? That informs how much negotiation room exists.
- Schools are B-rated — typically a magnet for longer-tenancy family renters. What's the average tenant stay here, and is there a school-zone premium baked into asking?
- Crime grade is D in this area — have there been break-ins, vandalism, or insurance claims at this property in the last 3 years? What carrier currently insures it and at what premium?
- What's the average days-on-market for RENTAL listings here right now (not sales)? A rising rental-DOM trend means longer vacancies and softer asking-rent achievability than the comps imply.
- What's the recent tenant-quality profile in this submarket — average credit score on applications, eviction rate, late-payment / NSF rate, and stable-employment percentage? A property-management company in the area should have these aggregated.
- How much new apartment / multifamily construction is in the pipeline within 1–3 miles? Heavy new supply (>2% of stock underway) typically softens rents 12–24 months out; light construction supports rent growth.
Investment metrics
- 1% rule
- 1.54% ✓
- Cap rate
- 7.06%
- Cash-on-cash
- 2.73%
- DSCR
- 1.12
- GRM
- 5.4
CMA / ARV
No comps found within radius.
Projected returns pro-forma
-3.0% appreciation · 1.83% rent growth · sell at horizon
- IRR
- -13.8%
- Equity multiple
- 0.51×
- Total profit
- $-19,485
- Equity at exit
- $21,322
- IRR
- -7.7%
- Equity multiple
- 0.55×
- Total profit
- $-17,977
- Equity at exit
- $12,364
Cash invested: $40,040 (down + closing). Projections, not guarantees.
Landlord ↔ Tenant lean methodology
- Overall (STATE)
- 87 Strongly Landlord-Friendly
- State Florida
- 87 Strongly Landlord-Friendly · R+3
- County
- — inherits STATE
- City
- — inherits STATE
ZIP-level market 33445
- Rents YoY
- 1.8%
- Active inventory
- 354
- Price-to-rent
- 5.4×
Monthly cashflow live
- Estimated rent
- $2,204 high interval (Pro) →
- Mortgage (P&I)
- −$750
- Tax from tax record
- −$218 /mo · $2,612/yr
- Insurance
- −$60
- HOA
- −$623
- Vacancy / Maint / Mgmt
- −$463
- Net cashflow
- $91
Break-even live
UW: 25.0% down · 7.5% · 30yr · 1.5% tax · 5.0% vac · 8.0% maint · 8.0% mgmt
Financing live
Cash to close
- Down payment
- $35,750
- Closing costs
- $4,290
- Reserves months
- —
- Total cash needed
- —
Loan-product check · same deal, 3 products live
Conventional
25% down · 7.5% · 30yr
- Down + closing
- —
- Monthly P&I
- —
- Monthly cashflow
- —
- DSCR
- —
- Eligible?
- —
Personal DTI + credit; lowest rate.
DSCR
20% down · 8.5% · 30yr
- Down + closing
- —
- Monthly P&I
- —
- Monthly cashflow
- —
- DSCR
- —
- Eligible?
- —
No personal income docs; deal must DSCR.
Hard money
10% down · 12.0% · 12mo
- Down + closing
- —
- Monthly P&I
- —
- Monthly cashflow
- —
- DSCR
- —
- Eligible?
- —
Short-term bridge; refi at stabilization.
Rent comps 40 comps
| Address | Beds | Baths | Sqft | Rent | $/sqft | DOM | Units | Dist |
|---|---|---|---|---|---|---|---|---|
| 2403 Lowson Blvd Unit D Delray Beach, FL | 2.0 | 2.0 | 1020 | $2,200 | $2.16 | 24d | 1 | 0.11mi |
| 2403 Lowson Blvd Unit C Delray Beach, FL | 1.0 | 1.5 | 821 | $1,650 | $2.01 | 22d | 1 | 0.11mi |
| 2381 Papaya Dr Unit 92C Delray Beach, FL | 2.0 | 2.0 | 1100 | $1,795 | $1.63 | 24d | 1 | 0.13mi |
| 2381 Papaya Dr Unit C Delray Beach, FL | 2.0 | 2.0 | 1100 | $1,795 | $1.63 | 8d | 1 | 0.13mi |
| 1130 Cactus Ter Unit 45C Delray Beach, FL | 2.0 | 1.5 | 982 | $2,000 | $2.04 | 24d | 1 | 0.28mi |
| 2500 Fiore Way Delray Beach, FL | 1.0–2.0 | 1.5–2.0 | 874 | $2,150 | $2.46 | 17d | 2 | 0.32mi |
| 2109 Catherine Dr #4 Delray Beach, FL | 2.0 | 1.0 | 842 | $1,950 | $2.32 | 22d | 1 | 0.33mi |
| 2500 Fiore Way #1110 Delray Beach, FL | 2.0 | 2.0 | 1023 | $1,850 | $1.81 | 24d | 1 | 0.33mi |
| 2731 Knight Ln Delray Beach, FL | 2.0 | 2.0 | 1050 | $2,650 | $2.52 | 24d | 1 | 0.33mi |
| 2500 Fiore Way #109 Delray Beach, FL | 1.0 | 1.5 | 825 | $2,150 | $2.61 | 11d | 1 | 0.34mi |
| 1511 Ilene Ct #4 Delray Beach, FL | 2.0 | 1.0 | 844 | $1,950 | $2.31 | 24d | 1 | 0.36mi |
| 2600 Fiore Way #2140 Delray Beach, FL | 2.0 | 2.0 | 1023 | $2,175 | $2.13 | 4d | 1 | 0.36mi |
| 2201 Catherine Dr Unit 3 Delray Beach, FL | 2.0 | 1.0 | 876 | $2,100 | $2.40 | 24d | 1 | 0.36mi |
| 2715 Ponce de Leon Blvd Delray Beach, FL | 2.0 | 1.0 | 1000 | $2,200 | $2.20 | 24d | 1 | 0.38mi |
| 2700 Fiore Way #2020 Delray Beach, FL | 2.0 | 2.0 | 1023 | $2,500 | $2.44 | 5d | 1 | 0.38mi |
| 2103 Catherine Dr Unit 2 Delray Beach, FL | 2.0 | 1.5 | 876 | $2,025 | $2.31 | 22d | 1 | 0.40mi |
| 2730 SW 13th St #203 Delray Beach, FL | 2.0 | 2.0 | 1084 | $2,200 | $2.03 | 24d | 1 | 0.41mi |
| 2828 Casita Way Delray Beach, FL | 2.0 | 2.0 | 1023 | $2,248 | $2.20 | 24d | 2 | 0.46mi |
| 2828 Casita Way #214 Delray Beach, FL | 2.0 | 2.0 | 1023 | $2,300 | $2.25 | 15d | 1 | 0.46mi |
| 2828 Casita Way #1020 Delray Beach, FL | 2.0 | 2.0 | 1023 | $2,000 | $1.96 | 21d | 1 | 0.47mi |
| 2900 Fiore Way #2110 Delray Beach, FL | 2.0 | 2.0 | 1023 | $2,385 | $2.33 | 4d | 1 | 0.48mi |
| 829 Camino Rd Delray Beach, FL | 2.0 | 2.0 | 1023 | $2,262 | $2.21 | 24d | 2 | 0.52mi |
| 829 Camino Rd Unit 206C Delray Beach, FL | 2.0 | 2.0 | 1023 | $2,400 | $2.35 | 24d | 1 | 0.52mi |
| 625 SW 20th Ct #80 Delray Beach, FL | 2.0 | 1.0 | 777 | $2,300 | $2.96 | 24d | 1 | 0.53mi |
| 1705 Palm Cove Blvd Unit 1-206 Delray Beach, FL | 1.0 | 1.0 | 636 | $2,150 | $3.38 | 24d | 1 | 0.54mi |
| 1705 Palm Cove Blvd Apt 302 Delray Beach, FL | 1.0 | 1.0 | 934 | $2,000 | $2.14 | 24d | 1 | 0.55mi |
| 1725 Palm Cove Blvd Unit 2-306 Delray Beach, FL | 1.0 | 1.0 | 934 | $2,100 | $2.25 | 21d | 1 | 0.56mi |
| 1760 Palm Cove Blvd Unit 5-203 Delray Beach, FL | 2.0 | 2.0 | 992 | $2,200 | $2.22 | 24d | 1 | 0.62mi |
| 1760 Palm Cove Blvd Unit 5-203 Delray Beach, FL | 2.0 | 2.0 | 993 | $2,200 | $2.22 | 14d | 1 | 0.62mi |
| 1740 Palm Cove Blvd Apt 103 Delray Beach, FL | 3.0 | 2.0 | 1065 | $2,900 | $2.72 | 24d | 1 | 0.62mi |
| 1850 Homewood Blvd #2070 Delray Beach, FL | 2.0 | 2.0 | 1090 | $2,550 | $2.34 | 24d | 1 | 0.63mi |
| 1725 Palm Cove Blvd Unit 104 Delray Beach, FL | 1.0 | 1.0 | 558 | $1,700 | $3.05 | 24d | 1 | 0.63mi |
| 1780 Palm Cove Blvd Unit 6-302 Delray Beach, FL | 1.0 | 1.0 | 672 | $1,800 | $2.68 | 5d | 1 | 0.63mi |
| 1780 Palm Cove Blvd Unit 6 Delray Beach, FL | 1.0 | 1.0 | 570 | $1,845 | $3.24 | 8d | 1 | 0.63mi |
| 1780 Palm Cove Blvd Unit 6-202 Delray Beach, FL | 1.0 | 1.0 | 672 | $1,800 | $2.68 | 24d | 1 | 0.63mi |
| 1845 Palm Cove Blvd Unit 8-204 Delray Beach, FL | 1.0 | 1.0 | 570 | $1,850 | $3.25 | 13d | 1 | 0.66mi |
| 1845 Palm Cove Blvd Unit 8-103 Delray Beach, FL | 3.0 | 2.0 | 1065 | $2,500 | $2.35 | 19d | 1 | 0.66mi |
| 1825 Palm Cove Blvd Unit 7-105 Delray Beach, FL | 2.0 | 2.0 | 946 | $2,200 | $2.33 | 15d | 1 | 0.66mi |
| 1825 Palm Cove Blvd Unit 7-204 Delray Beach, FL | 1.0 | 1.0 | 636 | $2,000 | $3.14 | 4d | 1 | 0.66mi |
| 1825 Palm Cove Blvd Unit UNI8T 105 Delray Beach, FL | 2.0 | 2.0 | 672 | $2,200 | $3.27 | 2d | 1 | 0.66mi |
HOA detail condo
- Monthly dues
- $623 · $7,476/yr
- Assessments
- None detected in remarks — confirm with the listing agent.
Listing history 19 events
-
2026-04-24status Pending
-
2026-03-13price $143,000
-
2026-02-06$150,000 Active
-
2025-06-06historical $1,650
-
2025-06-06status Pending
-
2025-06-05historical
-
2025-05-13price $167,500
-
2025-05-08$1,650
-
2025-05-07status Active
-
2025-05-04status Pending
-
2025-05-02historical $1,650
-
2025-04-18price $1,650
-
2025-04-17price $170,000
-
2025-03-19price $175,000
-
2025-03-13$1,750
-
2025-03-13historical $1,750
-
2025-03-12$1,750
-
2025-01-15$185,000 Active
-
2002-04-11soldstatus $47,000
ⓘ Source: listings_history table (triggers on properties + properties_extension) + one-shot
backfill from property_details.listing_events for pre-trigger history.
Tax reassessment forecast FL · Resets to sale price
- Current annual tax
- $2,612 · $218/mo
- Projected year-2 tax
- $2,612 · $218/mo
- Expected delta
- $0/yr ($0/mo · 0.0%)
ⓘ Screening estimate from a state-policy table — verify with the county assessor before closing.
Climate risk First Street
- Flood 1/10 Low FEMA zone X (unshaded) · 0% chance over 30 yrs
- Wildfire 1/10 Low
- Heat 10/10 Extreme 7 d/yr ≥105°F today · 28 d/yr by 30 yrs out
- Wind 10/10 Extreme 99% chance of damaging wind over 30 yrs
- Air quality 3/10 Moderate 2 unhealthy d/yr today · 3 by 30 yrs out
Nearby sold comps map
Loading sold comps map…
Walkable amenities ~0.75 mi
Loading nearby amenities…
Taxation est. · year 1
- Rental income
- $26,451
- − Mortgage interest
- −$8,010
- − Property taxes
- −$2,612
- − Insurance
- −$715
- − Repairs & maintenance
- −$2,116
- − Management
- −$2,116
- − HOA
- −$7,476
- − Depreciation
- −$4,160
- Taxable loss
- −$754
- Est. tax savings @ 24.0%
- +$181
- After-tax cash flow
- $1,276/yr
For passive investors: Depreciation is non-cash, so a rental often shows a tax loss while cash-flowing — sheltering income. Rental losses are passive: they offset passive income freely, and up to $25,000/yr can offset ordinary (W-2) income if you actively participate and your MAGI is under $100k (phasing out to $0 by $150k); unused losses carry forward. On sale, claimed depreciation is recaptured at up to 25%, and gains may owe capital-gains tax (a 1031 exchange can defer both). Figures are a year-1 estimate at your 24.0% rate — not tax advice; consult a CPA.
Schools (NCES district)
- District
- Palm Beach
- NCES district ID
- 1201500
- Math proficiency
- 46% ▼ -16.00%
- Reading proficiency
- 53% ▼ -4.00%
- Median HH income
- $53,943
- Composite
- 42.72/100
- National rank
- #3160
- State rank
- #34 of 73 in FL
Livability — Delray Beach
- Score
- 77/100
- State rank
- #202
- US rank
- #3160
Category grades
Schools grade is shown separately in the Schools card above.
Census & demographics
- Census place
- Delray Beach, FL
- County
- Palm Beach County · 1,438,312 people
- City population
- 123,167
- Metro
- Miami-Fort Lauderdale-Pompano Beach, FL
- Population (ZIP)
- 33,122
- Household income
- $78,163
- Rent vs Own
- Severe rent burden
- 1649.0
Population outlook (Palm Beach County) Hauer SSP2
- Today (2025)
- 1,637,487 people
- By 2030
- 1,743,255 · +6.5%
- By 2040
- 1,948,712 · +19.0%
- By 2050
- 2,132,979 · +30.3%
- By 2075
- 2,530,027 · +54.5%
- By 2100
- 2,706,979 · +65.3%
Race, ethnicity, and origin ACS 2023
- Neighborhood character
- Diverse neighborhood (Simpson 0.62)
- Race & ethnicity
- White 55% Black 24% Hispanic / Latino 11% Two or more races 11% Asian 4%
- Hispanic origin (detail)
- Puerto Rican 3% Cuban 2%
- Common ancestry
- Hispanic 14% Romanian 3% Scotch-Irish 3%
- Foreign-born
- 27% · Canada, Jamaica, Dominican Republic
- Languages at home
- 66% English-only · French/Haitian/Cajun 18% Spanish 9% Other Indo-European 4%
Political lean MEDSL · Palm Beach
- 2024 margin
- Toss-up / Even · D 50.0% · R 49.2%
- 2008→2024 swing
- -22.1pp toward R · 2008: 22.9pp · 2024: 0.8pp
- All cycles
- 2024: D+0.8 2020: D+12.8 2016: D+15.3 2012: D+17.0 2008: D+22.9
Not yet ingested
- Civics
- —
Market trends
- HPI YoY
- ▼ -258.16%
- Current HPI
- 349.5505
- Rent YoY
- ▲ 1.83%
- Metro
- Miami-Fort Lauderdale-Pompano Beach, FL
- State GDP YoY
- ▲ 3.28%
- F500 in state
- 36
Industry mix (Fortune 500 HQ in FL)
| Industry | F500 HQs | Revenue |
|---|---|---|
| Industrial Technology | 2 | $29B |
|
||
| Insurance | 2 | $17B |
|
||
| Retail | 1 | $60B |
|
||
| Technology Distribution | 1 | $58B |
|
||
| Homebuilding | 1 | $35B |
|
||
| Technology Manufacturing | 1 | $35B |
|
||
Price history
+204.3% since first listed19 events — show timeline
- 2026-04-24 Pending — Beaches MLS
- 2026-03-13 Price Changed $143,000 Beaches MLS
- 2026-02-06 Listed $150,000 Beaches MLS
- 2025-06-06 Rental Removed $1,650 RMLSFL
- 2025-06-06 Pending — Beaches MLS
- 2025-06-05 Listing Removed — Beaches MLS
- 2025-05-13 Price Changed $167,500 Beaches MLS
- 2025-05-08 Listed for Rent $1,650 RMLSFL
- 2025-05-07 Relisted — Beaches MLS
- 2025-05-04 Pending — Beaches MLS
- 2025-05-02 Rental Removed $1,650 RMLSFL
- 2025-04-18 Price Changed $1,650 RMLSFL
- 2025-04-17 Price Changed $170,000 Beaches MLS
- 2025-03-19 Price Changed $175,000 Beaches MLS
- 2025-03-13 Listed for Rent $1,750 RMLSFL
- 2025-03-13 Rental Removed $1,750 GFLMLS
- 2025-03-12 Listed for Rent $1,750 GFLMLS
- 2025-01-15 Listed $185,000 Beaches MLS
- 2002-04-11 Sold (Public Records) $47,000 Public Records
Property tax history
+6.4%/yrLatest (2025): $2,612 · +9.3% YoY. Source: county tax records.
Cash-flow waterfall
monthlySold comps — $/sqft
last 12 mo · ≤1 miLoading sold comps…