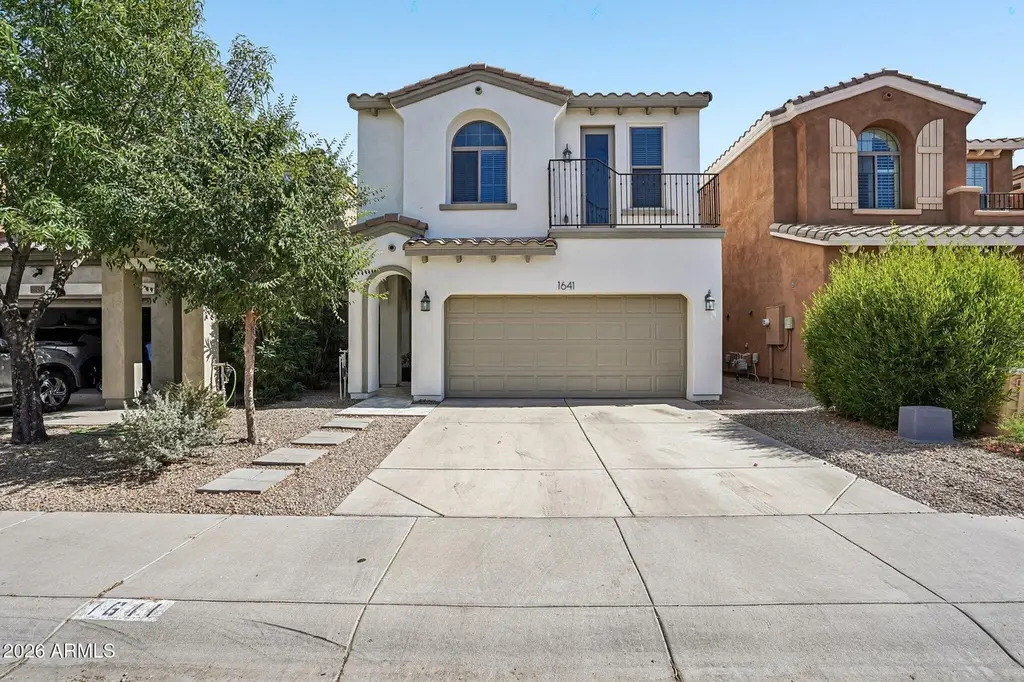
1641 W Lacewood Pl · Phoenix, AZ
Flood risk 1/10 · Minimal
- FEMA flood zone
- X (shaded)
- Chance of flooding over 30 yrs
- 0.0%
- Est. flood insurance / yr
- $507 – $1,088
Fire risk 8/10 · Major
- Est. fire insurance / yr
- $610 – $1,132
Heat risk 9/10 · Severe
- Hot days now (above 113°F)
- 7 days/yr
- Hot days in 30 yrs
- 18 days/yr
Wind risk 1/10 · Minimal
- Chance of severe wind over 30 yrs
- —
Air-quality risk 1/10 · Minimal
- Unhealthy air days now
- 0 days/yr
- Unhealthy air days in 30 yrs
- 0 days/yr
Risk factors via First Street. Map © Google.
Why this score? — see what drove the D+ grade
The composite is a weighted blend of 9 inputs, each scored 0–100. Each bar is that input's sub-score; the figure is the points it added to the 100-point composite (weight × sub-score).
- ARV discount +15.0/15.0
- Cash flow +8.9/30.0
- Appreciation +6.0/10.0
- Schools +4.2/10.0
- Livability +3.8/5.0
- DSCR +2.5/10.0
- Rent growth +2.5/5.0
- Condition / age +2.5/5.0
- 1% rule +1.9/10.0
$469,900
🖨 Deal sheet (PDF) 📄 Offer letter ✓ Due diligence
Listing remarks
Beautifully maintained home in highly desirable Foothills Club West of Ahwatukee features split upstairs floorplan with three bedrooms, two full baths and loft bonus room. Primary bedroom showcases walk-in closet, dual vanity sink, separate shower and tub. Upstairs laundry room with living quarters is a major plus. Downstairs office and half bathroom complete the home. Large diagonal tiles welcome you at the entry into great room. Tastefully updated kitchen features s/s appliances, gas range, granite countertops. Backyard updated with artificial grass and sun shade awnings. Ceiling fans throughout. Located in award-winning Kyrene school district. Moments from shops, restaurants, South Mtn P
Key facts
- Walk-in closet
- Dual vanity sink
- Loft bonus room
Tags
Property features AI
Finance
- Other: Community amenities include tennis courts, playground, and biking/walking paths
- Financial info: Conventional financing available; non-assumable
- HOA & community: Homeowners association with semi-annual fees; Association fees include grounds maintenance; Association fee examples listed semi-annually
Exterior
- Parking: 2 covered parking spaces; 2 open parking spaces; 2-car garage with garage door opener
- Utilities: City water; Public sewer (connected)
- Home design: Single family residence; Fee simple ownership; Asphalt road access
- Construction: Stucco and wood frame construction; Tile roof
- Exterior features: Sprinklers in front; Sprinklers in rear; Gravel/stone front yard; Synthetic grass in back yard; Block fencing; City-maintained road
Interior
- Kitchen: Built-in microwave; Refrigerator; Dishwasher; Built-in gas oven
- Bedrooms: Up to 5 bedrooms possible
- Flooring: Carpet; Tile
- Bathrooms: 2 full bathrooms; 1 half bathroom
- Heating & cooling: Natural gas heating; Central air conditioning
- Interior features: Granite counters; Double vanity; Upstairs living areas; Eat-in kitchen; Primary bedroom with full bath; Separate shower and tub; Dual-pane windows
- Laundry & utility: Inside laundry; Upstairs laundry
Neighborhood map
What this means for you Summary
Snapshot
- This is a 4-bed/4.0-bath single-family listed at $470k.
Deal economics
- At list price, monthly cash flow is $-377 ($-5k/yr) — negative.
- To cash-flow at today's rent, offer at most $403k (14.2% below list).
- To meet the 1% rule (rent ≥ 1% of price), the offer needs to be $322k (31.4% below list).
- Recommended offer: $322k (31.4% below list) — sets the bar for 1% rule.
- Cap rate 5.3% vs local median 3.3% in Phoenix — top-decile yield for the area; either an underpriced asset or a hidden risk that comps aren't pricing in. Stress-test before assuming the spread holds.
Location & tenants
- Location reads 75/100 on livability (#16 in AZ, #3,924 nationally) — a middle-class / working-renter tenant base. Strengths: amenities A+, commute A+, housing A+; Watch: health & safety C-, crime F.
- Kyrene Elementary District (4267) (urban): math 41% / reading 51% proficiency, ranked #43 of 249 in AZ (top 17%) — families likely to look elsewhere, expect single-tenant / working-renter base with shorter leases.
- Zoned schools: Kyrene De La Sierra School (math 69% / reading 81%, grade A, #32 of 1,109 statewide, top 3%, 514 students, 12% FRL); Kyrene Altadena Middle School (math 49% / reading 61%, grade B-, #11 of 218 statewide, top 6%, 962 students, 10% FRL).
- Zoned-school proficiency averages 65% at this address vs 46% district-wide (+19 pts) — the actual schools serving this property are materially stronger than the Kyrene Elementary District (4267) average implies; a family-tenant draw the district grade alone would hide.
- Market conditions: 116 active listings in the ZIP; 8 comparable units currently listed for rent nearby; rentals leasing fast (median 2d on market — plan ~1-2 weeks tenant-placement turnaround); high-income renter base; 36,011 units permitted in Maricopa County in 2024 (12,801 in 5+ unit buildings).
Forward outlook
- In year one you build about $13k of equity ($3k loan paydown + $9k appreciation (2.0% local appreciation)).
- Maricopa County population projected at +38% by 2050 — long-run rental-demand tailwind backs the buy-and-hold thesis.
- By year 3, paydown + projected appreciation supports a ~$32k cash-out refi (75% LTV) — recoverable capital for the next deal without selling this one.
Negotiation context
- It's been on market 23 days — a 2% lower offer ($463k) is reasonable based on typical stale-listing flexibility.
Risks & watch-outs
- Climate carrying-cost: severe wildfire risk; extreme-heat days projected 7→18/yr by 2055 (HVAC capex compounding) — expect insurance premiums to compound above CPI over the hold.
Questions for the listing agent
- What do current leases actually rent for vs. the listed asking? Can we see a recent rent roll and the last 12 months of T-12 income?
- What does the HOA fee cover, when was the last increase, and are there any pending special assessments or reserve-fund shortfalls?
- Is there a deadline driving the sale (1031 exchange, divorce, estate, relocation)? That informs how much negotiation room exists.
- Crime grade is F in this area — have there been break-ins, vandalism, or insurance claims at this property in the last 3 years? What carrier currently insures it and at what premium?
- The area grade is low — what's the realistic commute time and amenity access for the typical tenant pool here? Any planned neighborhood developments (good or bad) we should know about?
- What's the average days-on-market for RENTAL listings here right now (not sales)? A rising rental-DOM trend means longer vacancies and softer asking-rent achievability than the comps imply.
- What's the recent tenant-quality profile in this submarket — average credit score on applications, eviction rate, late-payment / NSF rate, and stable-employment percentage? A property-management company in the area should have these aggregated.
- How much new for-sale + rental construction is in the pipeline within 1–3 miles? Heavy new supply typically softens prices + rents 12–24 months out; constrained supply supports both.
Investment metrics
- 1% rule
- 0.69% ✗
- Cap rate
- 5.33%
- Cash-on-cash
- -3.43%
- DSCR
- 0.85
- GRM
- 12.2
CMA / ARV
- ARV (on-the-fly)
- $596,418
- Comps found
- 12
Show comp detail 12 sales within ~0.75 mi
| Address | Dist | Beds/Ba | Sqft | Sold | Price | $/sf | Match |
|---|---|---|---|---|---|---|---|
| 1551 W Lacewood Pl | 0.07mi | 4/3.0 | 1,930 (+4%) | 3mo | $459,850 | $238 | 84 |
| 1633 W Lacewood Pl | 0.01mi | 3/2.5 (-1) | 1,782 (-4%) | 0mo | $417,900 | $235 | 81 |
| 1816 W Lacewood Pl | 0.18mi | 3/2.0 (-1) | 1,869 (+1%) | 2mo | $530,000 | $284 | 76 |
| 1711 W Satinwood Dr | 0.13mi | 3/2.0 (-1) | 1,637 (-12%) | 3mo | $538,900 | $329 | 59 |
| 1646 W Windsong Dr | 0.18mi | 3/2.0 (-1) | 1,661 (-11%) | 3mo | $585,000 | $352 | 58 |
| 1641 W Windsong Dr | 0.16mi | 3/2.0 (-1) | 1,661 (-11%) | 8mo | $510,000 | $307 | 56 |
| 16617 S 15th Dr | 0.27mi | 3/2.0 (-1) | 2,058 (+11%) | 7mo | $660,000 | $321 | 50 |
| 1356 W Deer Creek Rd | 0.39mi | 3/2.0 (-1) | 1,996 (+7%) | 8mo | $670,000 | $336 | 50 |
| 16404 S 18th Dr | 0.48mi | 3/2.0 (-1) | 1,740 (-6%) | 8mo | $560,000 | $322 | 47 |
| 1739 W Nighthawk Way | 0.35mi | 3/2.0 (-1) | 1,661 (-11%) | 9mo | $589,000 | $355 | 46 |
| 16016 S 18th Ave | 0.59mi | 4/3.0 | 2,112 (+14%) | 4mo | $615,000 | $291 | 43 |
| 15427 S 16th Ave | 0.71mi | 3/2.0 (-1) | 2,050 (+10%) | 4mo | $650,000 | $317 | 33 |
Match score weights: distance 35% · size 25% · config 20% · recency 20%. Top-matched comps best support the ARV.
Projected returns pro-forma
1.98% appreciation · 3.0% rent growth · sell at horizon
- IRR
- 1.1%
- Equity multiple
- 1.06×
- Total profit
- $7,701
- Equity at exit
- $184,933
- IRR
- 5.2%
- Equity multiple
- 1.71×
- Total profit
- $93,029
- Equity at exit
- $265,992
Cash invested: $131,572 (down + closing). Projections, not guarantees.
Landlord ↔ Tenant lean methodology
- Overall (STATE)
- 87 Strongly Landlord-Friendly
- State Arizona
- 87 Strongly Landlord-Friendly · R+3
- County
- — inherits STATE
- City
- — inherits STATE
ZIP-level market 85045
- Home prices YoY
- 0.8%
- Active inventory
- 116
- Price-to-rent
- 12.2×
Monthly cashflow live
- Estimated rent
- $3,222 high interval (Pro) →
- Mortgage (P&I)
- −$2,464
- Tax from tax record
- −$182 /mo · $2,184/yr
- Insurance
- −$196
- HOA
- −$80
- Vacancy / Maint / Mgmt
- −$677
- Net cashflow
- $-377
Break-even live
Sensitivity live
| Price | -10% $-111 | -5% $-244 | +0% $-377 | +5% $-510 | +10% $-643 |
|---|---|---|---|---|---|
| Rent | -10% $-631 | -5% $-504 | +0% $-377 | +5% $-249 | +10% $-122 |
| Rate | -1.0pp $-140 | -0.5pp $-257 | base $-377 | +0.5pp $-498 | +1.0pp $-622 |
UW: 25.0% down · 7.5% · 30yr · 1.5% tax · 5.0% vac · 8.0% maint · 8.0% mgmt
Financing live
Cash to close
- Down payment
- $117,475
- Closing costs
- $14,097
- Reserves months
- —
- Total cash needed
- —
Loan-product check · same deal, 3 products live
Conventional
25% down · 7.5% · 30yr
- Down + closing
- —
- Monthly P&I
- —
- Monthly cashflow
- —
- DSCR
- —
- Eligible?
- —
Personal DTI + credit; lowest rate.
DSCR
20% down · 8.5% · 30yr
- Down + closing
- —
- Monthly P&I
- —
- Monthly cashflow
- —
- DSCR
- —
- Eligible?
- —
No personal income docs; deal must DSCR.
Hard money
10% down · 12.0% · 12mo
- Down + closing
- —
- Monthly P&I
- —
- Monthly cashflow
- —
- DSCR
- —
- Eligible?
- —
Short-term bridge; refi at stabilization.
Rent comps 8 comps
| Address | Beds | Baths | Sqft | Rent | $/sqft | DOM | Units | Dist |
|---|---|---|---|---|---|---|---|---|
| 1517 W Windsong Dr Phoenix, AZ | 4.0 | 2.0 | 2280 | $2,595 | $1.14 | 2d | 1 | 0.19mi |
| 16609 S 16th Dr Phoenix, AZ | 4.0 | 2.0 | 1792 | $2,899 | $1.62 | 2d | 1 | 0.23mi |
| 1724 W Deer Creek Rd Phoenix, AZ | 3.0 | 2.0 | 1740 | $3,150 | $1.81 | 2d | 1 | 0.25mi |
| 1821 W Glenhaven Dr Phoenix, AZ | 3.0 | 2.0 | 1661 | $2,800 | $1.69 | 2d | 1 | 0.33mi |
| 16417 S 2nd Pl Phoenix, AZ | 4.0 | 2.0 | 1827 | $3,975 | $2.18 | 2d | 1 | 1.38mi |
| 528 W Mountain Sage Dr Phoenix, AZ | 4.0 | 3.0 | 2283 | $2,895 | $1.27 | 23d | 1 | 1.45mi |
| 528 W Mountain Sage Dr Phoenix, AZ | 4.0 | 3.0 | 2282 | $2,700 | $1.18 | 2d | 1 | 1.45mi |
| 263 E Ashurst Dr Phoenix, AZ | 3.0 | 2.0 | 1511 | $2,195 | $1.45 | 3d | 1 | 1.50mi |
HOA detail
- Monthly dues
- $80 · $960/yr
- Likely covers
- gas
Listing history 15 events
-
2026-06-21statusdays on market $469,900 Under Contract Accepting Backups 23 DOM
-
2026-06-18days on market $469,900 Active 20 DOM
-
2026-06-17days on market $469,900 Active 19 DOM
-
2026-06-16days on market $469,900 Active 18 DOM
-
2026-06-15days on market $469,900 Active 17 DOM
-
2026-06-13days on market $469,900 Active 15 DOM
-
2026-06-13days on market $469,900 Active 14 DOM
-
2026-06-09days on market $469,900 Active 11 DOM
-
2026-06-08days on market $469,900 Active 10 DOM
-
2026-06-07days on market $469,900 Active 9 DOM
-
2026-06-04days on market $469,900 Active 6 DOM
-
2026-06-03days on market $469,900 Active 5 DOM
-
2026-06-02days on market $469,900 Active 4 DOM
-
2026-06-01days on market $469,900 Active 3 DOM
-
2026-05-31days on market $469,900 Active 2 DOM
ⓘ Source: listings_history table (triggers on properties + properties_extension) + one-shot
backfill from property_details.listing_events for pre-trigger history.
Tax reassessment forecast AZ · Resets to sale price
- Current annual tax
- $2,184 · $182/mo
- Projected year-2 tax
- $3,101 · $258/mo
- Expected delta
- +$918/yr (+$76/mo · 42.0%)
ⓘ Screening estimate from a state-policy table — verify with the county assessor before closing.
Climate risk First Street
- Flood 1/10 Low FEMA zone X (shaded) · 0% chance over 30 yrs
- Wildfire 8/10 Severe
- Heat 9/10 Extreme 7 d/yr ≥113°F today · 18 d/yr by 30 yrs out
- Wind 1/10 Low
- Air quality 1/10 Low 0 unhealthy d/yr today · 0 by 30 yrs out
Nearby sold comps map
Loading sold comps map…
Walkable amenities ~0.75 mi
Loading nearby amenities…
Taxation est. · year 1
- Rental income
- $38,665
- − Mortgage interest
- −$26,322
- − Property taxes
- −$2,184
- − Insurance
- −$2,350
- − Repairs & maintenance
- −$3,093
- − Management
- −$3,093
- − HOA
- −$960
- − Depreciation
- −$13,670
- Taxable loss
- −$13,006
- Est. tax savings @ 24.0%
- +$3,121
- After-tax cash flow
- $-1,397/yr
For passive investors: Depreciation is non-cash, so a rental often shows a tax loss while cash-flowing — sheltering income. Rental losses are passive: they offset passive income freely, and up to $25,000/yr can offset ordinary (W-2) income if you actively participate and your MAGI is under $100k (phasing out to $0 by $150k); unused losses carry forward. On sale, claimed depreciation is recaptured at up to 25%, and gains may owe capital-gains tax (a 1031 exchange can defer both). Figures are a year-1 estimate at your 24.0% rate — not tax advice; consult a CPA.
Schools (NCES district)
- District
- Kyrene Elementary District (4267)
- NCES district ID
- 0404230
- Math proficiency
- 41% ▼ -16.00%
- Reading proficiency
- 51% ▼ -9.00%
- Median HH income
- $79,317
- Composite
- 42.24/100
- National rank
- #3278
- State rank
- #43 of 249 in AZ
Livability — Phoenix
- Score
- 75/100
- State rank
- #16
- US rank
- #3924
Category grades
Schools grade is shown separately in the Schools card above.
Census & demographics
- Census place
- Phoenix, AZ
- County
- Maricopa County · 4,537,380 people
- City population
- 1,500,198
- Metro
- Phoenix-Mesa-Chandler, AZ
- Population (ZIP)
- 7,600
- Household income
- $153,583
- Rent vs Own
- Severe rent burden
- 11.0
Population outlook (Maricopa County) Hauer SSP2
- Today (2025)
- 4,979,203 people
- By 2030
- 5,378,229 · +8.0%
- By 2040
- 6,156,598 · +23.6%
- By 2050
- 6,872,376 · +38.0%
- By 2075
- 8,401,270 · +68.7%
- By 2100
- 9,247,439 · +85.7%
Race, ethnicity, and origin ACS 2023
- Neighborhood character
- Diverse neighborhood (Simpson 0.59)
- Race & ethnicity
- White 59% Hispanic / Latino 21% Two or more races 19% Asian 9% Black 3%
- Hispanic origin (detail)
- Mexican 16% Puerto Rican 1%
- Common ancestry
- Romanian 6% Lithuanian 3% Slovak 3%
- Foreign-born
- 12% · Canada, South Korea, Vietnam
- Languages at home
- 81% English-only · Spanish 10% Other Indo-European 2% Chinese 1%
Political lean MEDSL · Maricopa
- 2024 margin
- Toss-up / Even · D 47.7% · R 51.2% · Other 1.1%
- 2008→2024 swing
- +7.1pp toward D · 2008: -10.6pp · 2024: -3.5pp
- All cycles
- 2024: R+3.5 2020: D+2.2 2016: R+3.5 2012: R+12.0 2008: R+10.6
Not yet ingested
- Civics
- —
Market trends
- HPI YoY
- ▲ 1.98%
- Current HPI
- 264.7453
- Rent YoY
- —
- Metro
- Phoenix-Mesa-Chandler, AZ
- State GDP YoY
- ▲ 4.54%
- F500 in state
- 20
Industry mix (Fortune 500 HQ in AZ)
| Industry | F500 HQs | Revenue |
|---|---|---|
| Technology | 2 | $13B |
|
||
| Mining / Metals | 1 | $23B |
|
||
| Environmental Services | 1 | $16B |
|
||
| Metals / Steel | 1 | $14B |
|
||
| Technology Distribution | 1 | $9B |
|
||
| Homebuilding | 1 | $8B |
|
||
Price history
1 event — show timeline
- 2026-05-29 Listed $469,900 ARMLS
Property tax history
+10.0%/yrLatest (2025): $2,184 · +2.8% YoY. Source: county tax records.
Cash-flow waterfall
monthlySold comps — $/sqft
last 12 mo · ≤1 miLoading sold comps…