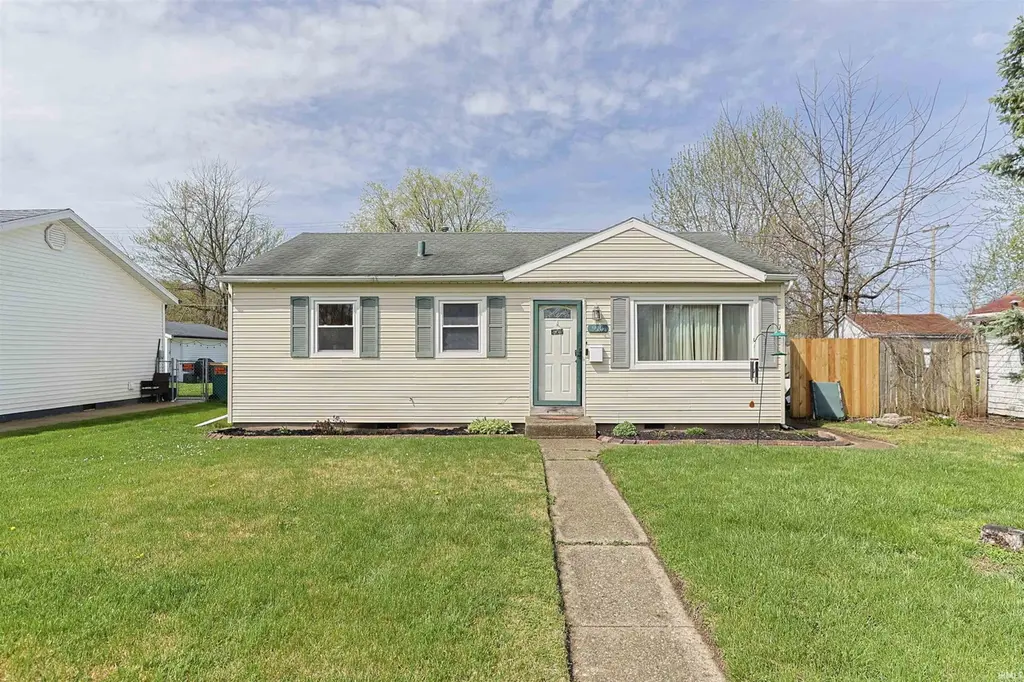
915 S Dale Ave · Mishawaka, IN
Flood risk 1/10 · Minimal
- FEMA flood zone
- X (unshaded)
- Chance of flooding over 30 yrs
- 0.0%
- Est. flood insurance / yr
- $507 – $1,088
Fire risk 1/10 · Minimal
- Est. fire insurance / yr
- $717 – $1,331
Heat risk 3/10 · Minor
- Hot days now (above 99°F)
- 7 days/yr
- Hot days in 30 yrs
- 16 days/yr
Wind risk 2/10 · Minimal
- Chance of severe wind over 30 yrs
- —
Air-quality risk 3/10 · Minor
- Unhealthy air days now
- 2 days/yr
- Unhealthy air days in 30 yrs
- 3 days/yr
Risk factors via First Street. Map © Google.
Why this score? — see what drove the F grade
The composite is a weighted blend of 9 inputs, each scored 0–100. Each bar is that input's sub-score; the figure is the points it added to the 100-point composite (weight × sub-score).
- Cash flow +9.5/30.0
- Rent growth +4.8/5.0
- Livability +3.8/5.0
- DSCR +2.7/10.0
- Condition / age +2.5/5.0
- 1% rule +2.2/10.0
- Schools +2.2/10.0
- ARV discount +0.0/15.0
- Appreciation +0.0/10.0
$179,900
🖨 Deal sheet (PDF) 📄 Offer letter ✓ Due diligence
Listing remarks MLS
HIGHEST AND BEST DUE BY 6PM Friday (May 20,2022) Expiration not to be before Noon Sat (May 21, 2022) . .. Seeking a move in home in Mishawaka? Here it is . .. Adorable home offering hardwood flooring, newer updated Kitchen and bath, spacious fenced backyard with shed and much more! Well maintained and neutral . .. Move right in!!! 2 finished rooms in the basement and plenty of storage space. Call today for more information! Home is being SOLD "As Is".
Key facts
- Versatile rooms
- Updated kitchen
- Built-in shelving
Tags
Neighborhood map
What this means for you Summary
Snapshot
- This is a 3-bed/1.0-bath single-family listed at $180k.
Deal economics
- At list price, monthly cash flow is $-126 ($-2k/yr) — negative.
- To cash-flow at today's rent, offer at most $158k (12.4% below list).
- To meet the 1% rule (rent ≥ 1% of price), the offer needs to be $129k (28.3% below list).
- Recommended offer: $129k (28.3% below list) — sets the bar for 1% rule.
Location & tenants
- Location reads 76/100 on livability (#53 in IN, #3,586 nationally) — a middle-class / working-renter tenant base. Strengths: cost of living A+, housing A+, health & safety B; Watch: amenities F, employment F.
- School City Of Mishawaka (urban): math 23% / reading 30% proficiency, ranked #260 of 301 in IN (top 86%) — low school quality limits family demand, transient renter base, plan for 1-2y turnover.
- Zoned schools: Lasalle Elementary School (math 17% / reading 12%, grade F, #862 of 994 statewide, top 88%, 543 students, 84% FRL); John J Young Middle School (math 17% / reading 30%, grade F, #257 of 330 statewide, top 79%, 735 students, 74% FRL); Mishawaka High School (math 24% / reading 60%, grade F, #197 of 369 statewide, top 57%, 1,488 students, 65% FRL) — zoned schools average 74% FRL vs 54% district-wide (20 pts higher); higher-poverty schools than district average — tighter screening recommended.
- Market conditions: Rents rising fast (+9.1%/yr); 141 active listings in the ZIP; 19 comparable units currently listed for rent nearby; rentals at typical pace (median 15d on market — plan ~3-4 weeks tenant-placement turnaround); 754 units permitted in St. Joseph County in 2024 (460 in 5+ unit buildings).
Forward outlook
- Local home prices are declining (-3.0%/yr); year-one equity from $1k of loan paydown is wiped out by about $5k of value loss. Plan a longer hold.
Negotiation context
- Only 8 days on market — expect competitive offers; lowballing is unlikely to land.
- 2 sale attempts since 4y ago with the ask held roughly flat each time — persistent listings suggest the price (not the market) is what's stuck; bring a comps-based counter.
- Current owner paid $131k; 38% above their basis — modest negotiation headroom, anchor on the comps not their cost.
Risks & watch-outs
- Watch-outs: built in 1951 — expect roof / HVAC / electrical / plumbing capex.
Questions for the listing agent
- What do current leases actually rent for vs. the listed asking? Can we see a recent rent roll and the last 12 months of T-12 income?
- Built in 1951 — when were the roof, HVAC, electrical panel, plumbing, and water heater last replaced?
- Is there a deadline driving the sale (1031 exchange, divorce, estate, relocation)? That informs how much negotiation room exists.
- The area grade is low — what's the realistic commute time and amenity access for the typical tenant pool here? Any planned neighborhood developments (good or bad) we should know about?
- What's the average days-on-market for RENTAL listings here right now (not sales)? A rising rental-DOM trend means longer vacancies and softer asking-rent achievability than the comps imply.
- What's the recent tenant-quality profile in this submarket — average credit score on applications, eviction rate, late-payment / NSF rate, and stable-employment percentage? A property-management company in the area should have these aggregated.
- How much new for-sale + rental construction is in the pipeline within 1–3 miles? Heavy new supply typically softens prices + rents 12–24 months out; constrained supply supports both.
Investment metrics
- 1% rule
- 0.72% ✗
- Cap rate
- 5.45%
- Cash-on-cash
- -3.01%
- DSCR
- 0.87
- GRM
- 11.6
CMA / ARV
- ARV (on-the-fly)
- $147,000
- Comps found
- 12
Show comp detail 12 sales within ~0.75 mi
| Address | Dist | Beds/Ba | Sqft | Sold | Price | $/sf | Match |
|---|---|---|---|---|---|---|---|
| 1917 Panama St | 0.14mi | 3/1.0 | 936 (+7%) | 2mo | $175,000 | $187 | 80 |
| 2536 Milburn Blvd | 0.36mi | 2/1.0 (-1) | 900 (+3%) | 1mo | $130,000 | $144 | 73 |
| 2523 Milburn Blvd | 0.32mi | 3/1.0 | 925 (+6%) | 4mo | $155,000 | $168 | 72 |
| 2611 Delaware St | 0.37mi | 3/1.0 | 936 (+7%) | 1mo | $164,000 | $175 | 70 |
| 2416 Milburn Blvd | 0.28mi | 2/1.0 (-1) | 823 (-6%) | 6mo | $156,500 | $190 | 67 |
| 1325 S 29th St | 0.52mi | 3/1.0 | 936 (+7%) | 3mo | $80,000 | $85 | 62 |
| 1934 E Bowman St | 0.56mi | 2/1.0 (-1) | 816 (-7%) | 3mo | $125,000 | $153 | 55 |
| 2423 Woodmont Dr | 0.71mi | 3/1.0 | 912 (+4%) | 7mo | $172,000 | $189 | 54 |
| 1325 S 31st St | 0.53mi | 2/1.0 (-1) | 821 (-6%) | 7mo | $159,500 | $194 | 54 |
| 1331 29th St | 0.51mi | 2/1.0 (-1) | 948 (+8%) | 6mo | $97,900 | $103 | 52 |
| 1625 Lincolnway West St | 0.47mi | 3/1.0 | 768 (-12%) | 7mo | $95,000 | $124 | 52 |
| 1012 W 8th St | 0.70mi | 2/1.0 (-1) | 942 (+8%) | 1mo | $135,000 | $143 | 48 |
Match score weights: distance 35% · size 25% · config 20% · recency 20%. Top-matched comps best support the ARV.
Projected returns pro-forma
-3.0% appreciation · 8.0% rent growth · sell at horizon
- IRR
- -16.4%
- Equity multiple
- 0.40×
- Total profit
- $-30,430
- Equity at exit
- $26,824
- IRR
- -1.5%
- Equity multiple
- 0.88×
- Total profit
- $-6,005
- Equity at exit
- $15,554
Cash invested: $50,372 (down + closing). Projections, not guarantees.
Landlord ↔ Tenant lean methodology
- Overall (STATE)
- 90 Strongly Landlord-Friendly
- State Indiana
- 90 Strongly Landlord-Friendly · R+11
- County
- — inherits STATE
- City
- — inherits STATE
ZIP-level market 46544
- Rents YoY
- 9.1%
- Active inventory
- 141
- Price-to-rent
- 11.6×
Monthly cashflow live
- Estimated rent
- $1,290 high interval (Pro) →
- Mortgage (P&I)
- −$943
- Tax from tax record
- −$127 /mo · $1,528/yr
- Insurance
- −$75
- HOA
- −$0
- Vacancy / Maint / Mgmt
- −$271
- Net cashflow
- $-126
Break-even live
Sensitivity live
| Price | -10% $-25 | -5% $-76 | +0% $-126 | +5% $-177 | +10% $-228 |
|---|---|---|---|---|---|
| Rent | -10% $-228 | -5% $-177 | +0% $-126 | +5% $-76 | +10% $-25 |
| Rate | -1.0pp $-36 | -0.5pp $-81 | base $-126 | +0.5pp $-173 | +1.0pp $-221 |
UW: 25.0% down · 7.5% · 30yr · 1.5% tax · 5.0% vac · 8.0% maint · 8.0% mgmt
Financing live
Cash to close
- Down payment
- $44,975
- Closing costs
- $5,397
- Reserves months
- —
- Total cash needed
- —
Loan-product check · same deal, 3 products live
Conventional
25% down · 7.5% · 30yr
- Down + closing
- —
- Monthly P&I
- —
- Monthly cashflow
- —
- DSCR
- —
- Eligible?
- —
Personal DTI + credit; lowest rate.
DSCR
20% down · 8.5% · 30yr
- Down + closing
- —
- Monthly P&I
- —
- Monthly cashflow
- —
- DSCR
- —
- Eligible?
- —
No personal income docs; deal must DSCR.
Hard money
10% down · 12.0% · 12mo
- Down + closing
- —
- Monthly P&I
- —
- Monthly cashflow
- —
- DSCR
- —
- Eligible?
- —
Short-term bridge; refi at stabilization.
Rent comps 19 comps
| Address | Beds | Baths | Sqft | Rent | $/sqft | DOM | Units | Dist |
|---|---|---|---|---|---|---|---|---|
| 607 Hendricks St Mishawaka, IN | 2.0 | 1.0 | 528 | $1,200 | $2.27 | 23d | 1 | 0.37mi |
| 2804 Delaware St Mishawaka, IN | 2.0 | 1.0 | 720 | $1,200 | $1.67 | 15d | 1 | 0.46mi |
| 1202 W 7th St Unit B Mishawaka, IN | 2.0 | 1.0 | 600 | $1,100 | $1.83 | 15d | 1 | 0.61mi |
| 1218 S 26th St South Bend, IN | 3.0 | 1.0 | 856 | $1,400 | $1.64 | 15d | 1 | 0.65mi |
| 3530 Northside Blvd South Bend, IN | 1.0–2.0 | 1.0 | 850 | $1,200 | $1.41 | 15d | 1 | 0.69mi |
| 1729 E Calvert St South Bend, IN | 3.0 | 1.0 | 900 | $1,300 | $1.44 | 45d | 1 | 0.79mi |
| 1701 E Donald St South Bend, IN | 2.0 | 1.0 | 720 | $1,075 | $1.49 | 45d | 1 | 0.83mi |
| 1006 S 35th St South Bend, IN | 3.0 | 2.0 | 816 | $1,000 | $1.23 | 15d | 1 | 0.84mi |
| 1106 S 20th St South Bend, IN | 1.0–3.0 | 1.0–2.0 | 885 | $1,200 | $1.36 | 15d | 1 | 0.91mi |
| 737 S 30th St South Bend, IN | 3.0 | 2.0 | 1000 | $1,600 | $1.60 | 45d | 1 | 1.05mi |
| 754 S 23rd St South Bend, IN | 3.0 | 1.0 | 884 | $1,300 | $1.47 | 45d | 1 | 1.09mi |
| 516 W 3rd St #6 Mishawaka, IN | 2.0 | 1.0 | 700 | $800 | $1.14 | 15d | 1 | 1.12mi |
| 722 S Spring St Apt 3 Mishawaka, IN | 2.0 | 1.0 | 800 | $1,200 | $1.50 | 15d | 1 | 1.19mi |
| 526 S 28th St South Bend, IN | 2.0 | 1.0 | 1000 | $1,350 | $1.35 | 15d | 1 | 1.22mi |
| 4245 Irish Hills Dr South Bend, IN | 1.0–2.0 | 1.0–1.5 | 739 | $1,436 | $1.94 | 15d | 77 | 1.27mi |
| 1213 E Donald St South Bend, IN | 2.0 | 1.0 | 648 | $1,050 | $1.62 | 23d | 1 | 1.31mi |
| 427 S 27th St South Bend, IN | 2.0 | 1.0 | 840 | $950 | $1.13 | 45d | 1 | 1.31mi |
| 365 W Front St Mishawaka, IN | 2.0 | 1.0–2.0 | 825 | $3,050 | $3.70 | 15d | 1 | 1.32mi |
| 2032 Southern Vw Unit 1a South Bend, IN | 2.0 | 1.0 | 1000 | $1,200 | $1.20 | 15d | 1 | 1.37mi |
Listing history 6 events
-
2026-04-25status Pending
-
2026-04-20historical Active Under Contract
-
2026-04-16$179,900 Active
-
2022-06-22soldstatus $130,600 Closed 467-char remark
Show marketing remark (467 chars)
HIGHEST AND BEST DUE BY 6PM Friday (May 20,2022) Expiration not to be before Noon Sat (May 21, 2022) . .. Seeking a move in home in Mishawaka? Here it is . .. Adorable home offering hardwood flooring, newer updated Kitchen and bath, spacious fenced backyard with shed and much more! Well maintained and neutral . .. Move right in!!! 2 finished rooms in the basement and plenty of storage space. Call today for more information! Home is being SOLD "As Is".
-
2022-05-21historical 467-char remark
Show marketing remark (467 chars)
HIGHEST AND BEST DUE BY 6PM Friday (May 20,2022) Expiration not to be before Noon Sat (May 21, 2022) . .. Seeking a move in home in Mishawaka? Here it is . .. Adorable home offering hardwood flooring, newer updated Kitchen and bath, spacious fenced backyard with shed and much more! Well maintained and neutral . .. Move right in!!! 2 finished rooms in the basement and plenty of storage space. Call today for more information! Home is being SOLD "As Is".
-
2022-05-17$109,900 467-char remark
Show marketing remark (467 chars)
HIGHEST AND BEST DUE BY 6PM Friday (May 20,2022) Expiration not to be before Noon Sat (May 21, 2022) . .. Seeking a move in home in Mishawaka? Here it is . .. Adorable home offering hardwood flooring, newer updated Kitchen and bath, spacious fenced backyard with shed and much more! Well maintained and neutral . .. Move right in!!! 2 finished rooms in the basement and plenty of storage space. Call today for more information! Home is being SOLD "As Is".
ⓘ Source: listings_history table (triggers on properties + properties_extension) + one-shot
backfill from property_details.listing_events for pre-trigger history.
Tax reassessment forecast IN · Partial reset (capped growth)
- Current annual tax
- $1,528 · $127/mo
- Projected year-2 tax
- $1,528 · $127/mo
- Expected delta
- +$1/yr ($0/mo · 0.0%)
ⓘ Screening estimate from a state-policy table — verify with the county assessor before closing.
Climate risk First Street
- Flood 1/10 Low FEMA zone X (unshaded) · 0% chance over 30 yrs
- Wildfire 1/10 Low
- Heat 3/10 Moderate 7 d/yr ≥99°F today · 16 d/yr by 30 yrs out
- Wind 2/10 Low
- Air quality 3/10 Moderate 2 unhealthy d/yr today · 3 by 30 yrs out
Nearby sold comps map
Loading sold comps map…
Walkable amenities ~0.75 mi
Loading nearby amenities…
Taxation est. · year 1
- Rental income
- $15,481
- − Mortgage interest
- −$10,077
- − Property taxes
- −$1,528
- − Insurance
- −$900
- − Repairs & maintenance
- −$1,239
- − Management
- −$1,239
- − Depreciation
- −$5,233
- Taxable loss
- −$4,734
- Est. tax savings @ 24.0%
- +$1,136
- After-tax cash flow
- $-382/yr
For passive investors: Depreciation is non-cash, so a rental often shows a tax loss while cash-flowing — sheltering income. Rental losses are passive: they offset passive income freely, and up to $25,000/yr can offset ordinary (W-2) income if you actively participate and your MAGI is under $100k (phasing out to $0 by $150k); unused losses carry forward. On sale, claimed depreciation is recaptured at up to 25%, and gains may owe capital-gains tax (a 1031 exchange can defer both). Figures are a year-1 estimate at your 24.0% rate — not tax advice; consult a CPA.
Schools (NCES district)
- District
- School City Of Mishawaka
- NCES district ID
- 1806840
- Math proficiency
- 23% ▼ -9.00%
- Reading proficiency
- 30% ▼ -7.00%
- Median HH income
- $39,290
- Composite
- 22.26/100
- National rank
- #8143
- State rank
- #260 of 301 in IN
Livability — Mishawaka
- Score
- 76/100
- State rank
- #53
- US rank
- #3586
Category grades
Schools grade is shown separately in the Schools card above.
Census & demographics
- Census place
- Mishawaka, IN
- County
- Saint Joseph County · 189,048 people
- City population
- 57,683
- Metro
- South Bend-Mishawaka, IN-MI
- Population (ZIP)
- 31,077
- Household income
- $58,829
- Rent vs Own
- Severe rent burden
- 685.0
Population outlook (St. Joseph County) Hauer SSP2
- Today (2025)
- 273,186 people
- By 2030
- 273,594 · +0.1%
- By 2040
- 271,641 · -0.6%
- By 2050
- 269,187 · -1.5%
- By 2075
- 263,136 · -3.7%
- By 2100
- 245,659 · -10.1%
Race, ethnicity, and origin ACS 2023
- Neighborhood character
- Predominantly White (79%)
- Race & ethnicity
- White 79% Black 9% Two or more races 7% Hispanic / Latino 6% Asian 1%
- Hispanic origin (detail)
- Mexican 5%
- Common ancestry
- Romanian 7% English 3% Lithuanian 2%
- Foreign-born
- 4% · Canada, Vietnam
- Languages at home
- 94% English-only · Spanish 3%
Political lean MEDSL · St. Joseph
- 2024 margin
- Toss-up / Even · D 50.0% · R 48.5% · Other 1.5%
- 2008→2024 swing
- -15.6pp toward R · 2008: 17.1pp · 2024: 1.5pp
- All cycles
- 2024: D+1.5 2020: D+5.8 2016: D+0.2 2012: D+3.5 2008: D+17.1
Not yet ingested
- Civics
- —
Market trends
- HPI YoY
- ▼ -116.74%
- Current HPI
- 188.9996
- Rent YoY
- ▲ 9.10%
- Metro
- South Bend-Mishawaka, IN-MI
- State GDP YoY
- ▲ 2.90%
- F500 in state
- 18
Industry mix (Fortune 500 HQ in IN)
| Industry | F500 HQs | Revenue |
|---|---|---|
| Industrial Machinery | 2 | $37B |
|
||
| Healthcare | 1 | $177B |
|
||
| Pharmaceuticals | 1 | $45B |
|
||
| Metals / Steel | 1 | $18B |
|
||
| Agriculture | 1 | $17B |
|
||
| Packaging | 1 | $12B |
|
||
Price history
+63.7% since first listed6 events — show timeline
- 2026-04-25 Pending — IRMLS
- 2026-04-20 Contingent — IRMLS
- 2026-04-16 Listed $179,900 IRMLS
- 2022-06-22 Sold (MLS) $130,600 IRMLS
- 2022-05-21 Delisted — IRMLS
- 2022-05-17 Listed $109,900 IRMLS
Property tax history
+9.8%/yrLatest (2023): $1,528 · +41.4% YoY. Source: county tax records.
Cash-flow waterfall
monthlySold comps — $/sqft
last 12 mo · ≤1 miLoading sold comps…