 Triplex
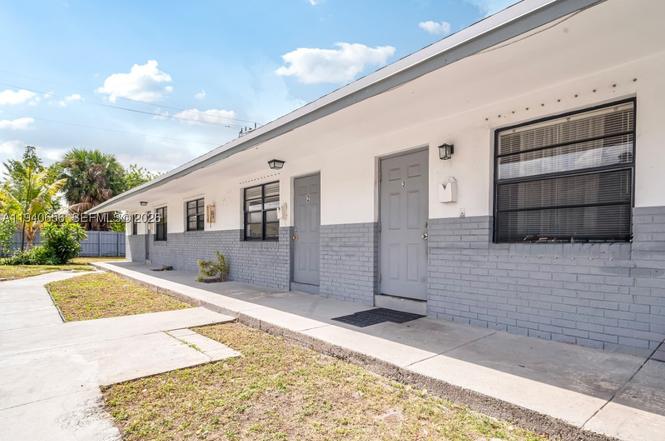
4030 SW 19th St · West Park, FL
Flood risk 1/10 · Minimal
- FEMA flood zone
- X (unshaded)
- Chance of flooding over 30 yrs
- 0.0%
- Est. flood insurance / yr
- $507 – $1,088
Fire risk 1/10 · Minimal
- Est. fire insurance / yr
- $947 – $1,759
Heat risk 10/10 · Severe
- Hot days now (above 105°F)
- 7 days/yr
- Hot days in 30 yrs
- 27 days/yr
Wind risk 10/10 · Severe
- Chance of severe wind over 30 yrs
- 99.0%
Air-quality risk 2/10 · Minimal
- Unhealthy air days now
- 2 days/yr
- Unhealthy air days in 30 yrs
- 2 days/yr
Risk factors via First Street. Map © Google.
Why this score? — see what drove the D grade
The composite is a weighted blend of 9 inputs, each scored 0–100. Each bar is that input's sub-score; the figure is the points it added to the 100-point composite (weight × sub-score).
- Cash flow +15.2/30.0
- ARV discount +7.5/15.0
- DSCR +4.7/10.0
- 1% rule +4.2/10.0
- Schools +4.1/10.0
- Livability +3.7/5.0
- Rent growth +2.6/5.0
- Condition / age +2.5/5.0
- Appreciation +0.0/10.0
$700,000
🖨 Deal sheet 📄 Offer letter ✓ Due diligence
Multi-family units
County records classify this as Multi-Family (2-4 Unit). Listing-text estimate: 3 units. confirmed
Listing remarks MLS
Amazing investment opportunity to acquire a (3) Unit Triplex in West Park. This property qualifies for FHA/Conventional financing. Fantastic starter investment property. Unit was recently upgraded. Unit 1 (2/1) Unit 2 (2/1) & Unit 3 (2/1). Unit 2 is vacant simply because of potential FHA buyers. Tenants are on standby for the unit to be rented. Brand new roof done less than 12 months ago. This investment opportunity will not last! Renting #2 at market value brings monthly cash flow to $5,181/month Act quickly!
Key facts
- 5 parking spots
- Built 1988
- Listed 161 days
Tags
Property features AI
Finance
- Other: Annual tax information available but excluded
- Financial info: Three furnished rental units currently leased with listed actual rents: $2,250, $2,050, and $1,650; Gardener service included in rent
- HOA & community: No HOA information listed
Exterior
- Parking: Total of 5 parking spaces
- Security: No specific security features listed
- Utilities: Public sewer; Cable available
- Home design: Single-story building; Block construction; Effective year built (exact year not specified)
- Construction: Block construction
- Exterior features: Quarter- to half-acre lot; Zoned R-3
Interior
- Kitchen: Kitchens included in each furnished unit
- Bedrooms: Two 2-bedroom furnished units (each leased); One 1-bedroom furnished unit (leased)
- Flooring: Tile
- Bathrooms: Units include full and half bathroom configurations (each 2-bed unit: 1 full, 1 half; 1-bed unit: 1 full)
- Heating & cooling: Central heating; Central air conditioning; Ceiling fans
- Interior features: Tile flooring
- Laundry & utility: In-unit or on-site laundry not specified
Neighborhood map
What this means for you Summary
Snapshot
- This is a 1×1bd/1ba + 1×2bd/1ba + 1×2bd/1.5ba units multifamily listed at $700k.
Deal economics
- At list price, monthly cash flow is $249 ($3k/yr) — positive. Per door: $83/mo.
- The deal already cash-flows at list — no discount required.
- To meet the 1% rule (rent ≥ 1% of price), the offer needs to be $644k (8.0% below list).
- Recommended offer: $616k (12.0% below list) — sets the bar for market timing.
Location & tenants
- Location reads 74/100 on livability (#280 in FL, #4,501 nationally) — a middle-class / working-renter tenant base. Strengths: housing A+, health & safety A+, cost of living A; Watch: employment D+, amenities F.
- Broward (suburban): math 42% / reading 53% proficiency, ranked #46 of 73 in FL (top 63%) — families likely to look elsewhere, expect single-tenant / working-renter base with shorter leases.
- Market conditions: Rents flat; 286 active listings in the ZIP; 2,111 units permitted in Broward County in 2024 (1,265 in 5+ unit buildings).
- At $6,439/mo this rent would consume 103% of the median local household income ($75k/yr) (locally 2567% of renters already pay >50% of income on rent) — very limited rent-growth headroom before tenants either downsize or default.
Forward outlook
- Local home prices are declining (-3.0%/yr); year-one equity from $5k of loan paydown is wiped out by about $21k of value loss. Plan a longer hold.
- Broward County population projected at +34% by 2050 — long-run rental-demand tailwind backs the buy-and-hold thesis.
Negotiation context
- It's been on market 162 days — a 12% lower offer ($616k) is reasonable based on typical stale-listing flexibility.
- 9 sale attempts since 12y ago with the ask held roughly flat each time — persistent listings suggest the price (not the market) is what's stuck; bring a comps-based counter.
Risks & watch-outs
- Climate carrying-cost: severe wind risk, 99% chance of damaging wind over 30y; extreme-heat days projected 7→27/yr by 2055 (HVAC capex compounding) — expect insurance premiums to compound above CPI over the hold.
Questions for the listing agent
- It's been on market 162 days. Have you received any prior offers? Is the seller open to a 12% concession, seller financing, or rate buy-down credit?
- Can we see the unit-by-unit rent roll, current vacancy, and any below-market leases? What's the average tenancy length?
- What capital expenditures (roof, boiler, parking lot, exteriors) have been made in the last 5 years, and what's planned in the next 2?
- Why hasn't it sold? Are there any deal-killer items the seller is aware of (foundation, flood, title, zoning, code violations)?
- Is there a deadline driving the sale (1031 exchange, divorce, estate, relocation)? That informs how much negotiation room exists.
- Schools are B-rated — typically a magnet for longer-tenancy family renters. What's the average tenant stay here, and is there a school-zone premium baked into asking?
- The area grade is low — what's the realistic commute time and amenity access for the typical tenant pool here? Any planned neighborhood developments (good or bad) we should know about?
- What's the average days-on-market for RENTAL listings here right now (not sales)? A rising rental-DOM trend means longer vacancies and softer asking-rent achievability than the comps imply.
- What's the recent tenant-quality profile in this submarket — average credit score on applications, eviction rate, late-payment / NSF rate, and stable-employment percentage? A property-management company in the area should have these aggregated.
- How much new apartment / multifamily construction is in the pipeline within 1–3 miles? Heavy new supply (>2% of stock underway) typically softens rents 12–24 months out; light construction supports rent growth.
Investment metrics
- 1% rule
- 0.92% ✗
- Cap rate
- 6.72%
- Cash-on-cash
- 1.53%
- DSCR
- 1.07
- GRM
- 9.1
CMA / ARV
No comps found within radius.
Projected returns pro-forma
-3.0% appreciation · 0.34% rent growth · sell at horizon
- IRR
- -16.9%
- Equity multiple
- 0.42×
- Total profit
- $-114,245
- Equity at exit
- $104,372
- IRR
- -14.6%
- Equity multiple
- 0.27×
- Total profit
- $-143,959
- Equity at exit
- $60,523
Cash invested: $196,000 (down + closing). Projections, not guarantees.
Landlord ↔ Tenant lean methodology
- Overall (STATE)
- 87 Strongly Landlord-Friendly
- State Florida
- 87 Strongly Landlord-Friendly · R+3
- County
- — inherits STATE
- City
- — inherits STATE
ZIP-level market 33023
- Rents YoY
- 0.3%
- Active inventory
- 286
- Price-to-rent
- 29.2×
Monthly cashflow live
- Estimated rent
- $6,439 high interval (Pro) →
- Mortgage (P&I)
- −$3,671
- Tax est. 1.5%
- −$875 /mo · $10,500/yr
- Insurance
- −$292
- HOA
- −$0
- Vacancy / Maint / Mgmt
- −$1,352
- Net cashflow
- $249
Break-even live
3-unit breakdown (identical units grouped — click to expand)
| Units | Beds | Baths | Est. rent |
|---|---|---|---|
| 1× unit | 1 | 1 | $1,998 |
| 1× unit | 2 | 1 | $2,221 |
| 1× unit | 2 | 1.5 | $2,221 |
| Total (3 units) | $6,439 | ||
UW: 25.0% down · 7.5% · 30yr · 1.5% tax · 5.0% vac · 8.0% maint · 8.0% mgmt
Financing live
Cash to close
- Down payment
- $175,000
- Closing costs
- $21,000
- Reserves months
- —
- Total cash needed
- —
Loan-product check · same deal, 3 products live
Conventional
25% down · 7.5% · 30yr
- Down + closing
- —
- Monthly P&I
- —
- Monthly cashflow
- —
- DSCR
- —
- Eligible?
- —
Personal DTI + credit; lowest rate.
DSCR
20% down · 8.5% · 30yr
- Down + closing
- —
- Monthly P&I
- —
- Monthly cashflow
- —
- DSCR
- —
- Eligible?
- —
No personal income docs; deal must DSCR.
Hard money
10% down · 12.0% · 12mo
- Down + closing
- —
- Monthly P&I
- —
- Monthly cashflow
- —
- DSCR
- —
- Eligible?
- —
Short-term bridge; refi at stabilization.
Listing history 36 events
-
2026-06-18days on market $700,000 Active 162 DOM
-
2026-06-17days on market $700,000 Active 161 DOM
-
2026-06-16days on market $700,000 Active 160 DOM
-
2026-06-15days on market $700,000 Active 159 DOM
-
2026-06-13days on market $700,000 Active 157 DOM
-
2026-06-09days on market $700,000 Active 153 DOM
-
2026-06-07days on market $700,000 Active 151 DOM
-
2026-06-04days on market $700,000 Active 148 DOM
-
2026-06-03days on market $700,000 Active 147 DOM
-
2026-06-02days on market $700,000 Active 146 DOM
-
2026-06-01days on market $700,000 Active 145 DOM
-
2026-05-31days on market $700,000 Active 144 DOM
-
2026-01-07historical
-
2026-01-07$700,000 Active
-
2025-10-08price $1,200,000
-
2025-08-31price $690,000
-
2025-06-11status Active
-
2025-06-08historical Active Under Contract
-
2025-04-04status Active
-
2025-03-29historical Active Under Contract
-
2025-02-19$700,000 Active
-
2024-07-23soldstatus $665,000 Closed 522-char remark
Show marketing remark (522 chars)
Amazing investment opportunity to acquire a (3) Unit Triplex in West Park. This property qualifies for FHA/Conventional financing. Fantastic starter investment property. Unit was recently upgraded. Unit 1 (2/1) Unit 2 (2/1) & Unit 3 (2/1). Unit 2 is vacant simply because of potential FHA buyers. Tenants are on standby for the unit to be rented. Brand new roof done less than 12 months ago. This investment opportunity will not last! Renting #2 at market value brings monthly cash flow to $5,181/month Act quickly!
-
2024-05-17status Pending 522-char remark
Show marketing remark (522 chars)
Amazing investment opportunity to acquire a (3) Unit Triplex in West Park. This property qualifies for FHA/Conventional financing. Fantastic starter investment property. Unit was recently upgraded. Unit 1 (2/1) Unit 2 (2/1) & Unit 3 (2/1). Unit 2 is vacant simply because of potential FHA buyers. Tenants are on standby for the unit to be rented. Brand new roof done less than 12 months ago. This investment opportunity will not last! Renting #2 at market value brings monthly cash flow to $5,181/month Act quickly!
-
2024-05-09status Pending
-
2024-05-08historical
-
2024-05-01$684,900 Active 522-char remark
Show marketing remark (522 chars)
Amazing investment opportunity to acquire a (3) Unit Triplex in West Park. This property qualifies for FHA/Conventional financing. Fantastic starter investment property. Unit was recently upgraded. Unit 1 (2/1) Unit 2 (2/1) & Unit 3 (2/1). Unit 2 is vacant simply because of potential FHA buyers. Tenants are on standby for the unit to be rented. Brand new roof done less than 12 months ago. This investment opportunity will not last! Renting #2 at market value brings monthly cash flow to $5,181/month Act quickly!
-
2024-01-18$684,900 Active
-
2022-08-22historical
-
2022-06-15price $599,000
-
2022-06-12status Active
-
2022-05-20status Pending
-
2022-04-13$600,000 Active
-
2014-07-13soldstatus $163,000 Sold
-
2014-05-21status Pending
-
2014-04-29$189,000 Active
-
2011-06-03soldstatus $80,000
ⓘ Source: listings_history table (triggers on properties + properties_extension) + one-shot
backfill from property_details.listing_events for pre-trigger history.
Climate risk First Street
- Flood 1/10 Low FEMA zone X (unshaded) · 0% chance over 30 yrs
- Wildfire 1/10 Low
- Heat 10/10 Extreme 7 d/yr ≥105°F today · 27 d/yr by 30 yrs out
- Wind 10/10 Extreme 99% chance of damaging wind over 30 yrs
- Air quality 2/10 Low 2 unhealthy d/yr today · 2 by 30 yrs out
Nearby sold comps map
Loading sold comps map…
Walkable amenities ~0.75 mi
Loading nearby amenities…
Taxation est. · year 1
- Rental income
- $77,268
- − Mortgage interest
- −$39,211
- − Property taxes
- −$10,500
- − Insurance
- −$3,500
- − Repairs & maintenance
- −$6,181
- − Management
- −$6,181
- − Depreciation
- −$20,364
- Taxable loss
- −$8,669
- Est. tax savings @ 24.0%
- +$2,081
- After-tax cash flow
- $5,072/yr
For passive investors: Depreciation is non-cash, so a rental often shows a tax loss while cash-flowing — sheltering income. Rental losses are passive: they offset passive income freely, and up to $25,000/yr can offset ordinary (W-2) income if you actively participate and your MAGI is under $100k (phasing out to $0 by $150k); unused losses carry forward. On sale, claimed depreciation is recaptured at up to 25%, and gains may owe capital-gains tax (a 1031 exchange can defer both). Figures are a year-1 estimate at your 24.0% rate — not tax advice; consult a CPA.
Schools (NCES district)
- District
- Broward
- NCES district ID
- 1200180
- Math proficiency
- 42% ▼ -18.00%
- Reading proficiency
- 53% ▼ -5.00%
- Median HH income
- $52,139
- Composite
- 40.88/100
- National rank
- #3621
- State rank
- #46 of 73 in FL
Livability — West Park
- Score
- 74/100
- State rank
- #280
- US rank
- #4501
Category grades
Schools grade is shown separately in the Schools card above.
Census & demographics
- Census place
- West Park, FL
- County
- Broward County · 1,963,430 people
- Metro
- Miami-Fort Lauderdale-Pompano Beach, FL
- Population (ZIP)
- 72,344
- Household income
- $74,709
- Rent vs Own
- Severe rent burden
- 2567.0
Population outlook (Broward County) Hauer SSP2
- Today (2025)
- 2,207,033 people
- By 2030
- 2,360,704 · +7.0%
- By 2040
- 2,661,208 · +20.6%
- By 2050
- 2,946,698 · +33.5%
- By 2075
- 3,602,273 · +63.2%
- By 2100
- 3,970,984 · +79.9%
Race, ethnicity, and origin ACS 2023
- Neighborhood character
- Diverse neighborhood (Simpson 0.60)
- Race & ethnicity
- Black 51% Hispanic / Latino 37% Two or more races 19% White 8% Asian 2%
- Hispanic origin (detail)
- Mexican 2% Puerto Rican 5% Cuban 9% Dominican 6%
- Common ancestry
- Hispanic 14%
- Foreign-born
- 44% · Canada, Jamaica, Dominican Republic
- Languages at home
- 50% English-only · Spanish 32% French/Haitian/Cajun 13% Other Indo-European 1%
Political lean MEDSL · Broward
- 2024 margin
- D (+17.0) · D 58.0% · R 41.0%
- 2008→2024 swing
- -17.8pp toward R · 2008: 34.7pp · 2024: 17.0pp
- All cycles
- 2024: D+17.0 2020: D+29.8 2016: D+35.0 2012: D+34.9 2008: D+34.7
Not yet ingested
- Civics
- —
Market trends
- HPI YoY
- ▼ -442.33%
- Current HPI
- 534.7664
- Rent YoY
- ▲ 0.34%
- Metro
- Miami-Fort Lauderdale-Pompano Beach, FL
- State GDP YoY
- ▲ 3.28%
- F500 in state
- 36
Industry mix (Fortune 500 HQ in FL)
| Industry | F500 HQs | Revenue |
|---|---|---|
| Industrial Technology | 2 | $29B |
|
||
| Insurance | 2 | $17B |
|
||
| Retail | 1 | $60B |
|
||
| Technology Distribution | 1 | $58B |
|
||
| Homebuilding | 1 | $35B |
|
||
| Technology Manufacturing | 1 | $35B |
|
||
Price history
+775.0% since first listed24 events — show timeline
- 2026-01-07 Listed $700,000 MARMLS
- 2026-01-07 Listing Removed — MARMLS
- 2025-10-08 Price Changed $1,200,000 MARMLS
- 2025-08-31 Price Changed $690,000 MARMLS
- 2025-06-11 Relisted — MARMLS
- 2025-06-08 Contingent — MARMLS
- 2025-04-04 Relisted — MARMLS
- 2025-03-29 Contingent — MARMLS
- 2025-02-19 Listed $700,000 MARMLS
- 2024-07-23 Sold (MLS) $665,000 MARMLS
- 2024-05-17 Pending — MARMLS
- 2024-05-09 Pending — MARMLS
- 2024-05-08 Listing Removed — MARMLS
- 2024-05-01 Listed $684,900 MARMLS
- 2024-01-18 Listed $684,900 MARMLS
- 2022-08-22 Listing Removed — MARMLS
- 2022-06-15 Price Changed $599,000 MARMLS
- 2022-06-12 Relisted — MARMLS
- 2022-05-20 Pending — MARMLS
- 2022-04-13 Listed $600,000 MARMLS
- 2014-07-13 Sold (MLS) $163,000 MARMLS
- 2014-05-21 Pending — MARMLS
- 2014-04-29 Listed $189,000 MARMLS
- 2011-06-03 Sold (MLS) $80,000 MARMLS
Cash-flow waterfall
monthlySold comps — $/sqft
last 12 mo · ≤1 miLoading sold comps…