 🔨 Auction
1742 Flaler Rd · Fort Recovery, OH
Flood risk 1/10 · Minimal
- FEMA flood zone
- X (unshaded)
- Chance of flooding over 30 yrs
- 0.0%
- Est. flood insurance / yr
- $507 – $1,088
Fire risk 1/10 · Minimal
- Est. fire insurance / yr
- $713 – $1,323
Heat risk 3/10 · Minor
- Hot days now (above 100°F)
- 7 days/yr
- Hot days in 30 yrs
- 18 days/yr
Wind risk 2/10 · Minimal
- Chance of severe wind over 30 yrs
- 0.0%
Air-quality risk 3/10 · Minor
- Unhealthy air days now
- 2 days/yr
- Unhealthy air days in 30 yrs
- 3 days/yr
Risk factors via First Street. Map © Google.
Why this score? — see what drove the F grade
The composite is a weighted blend of 9 inputs, each scored 0–100. Each bar is that input's sub-score; the figure is the points it added to the 100-point composite (weight × sub-score).
- ARV discount +7.5/15.0
- Schools +7.0/10.0
- Cash flow +6.0/30.0
- Livability +3.5/5.0
- Rent growth +2.5/5.0
- Condition / age +2.5/5.0
- 1% rule +1.4/10.0
- DSCR +0.4/10.0
- Appreciation +0.0/10.0
$1
🖨 Deal sheet (PDF) 📄 Offer letter ✓ Due diligence
Listing remarks
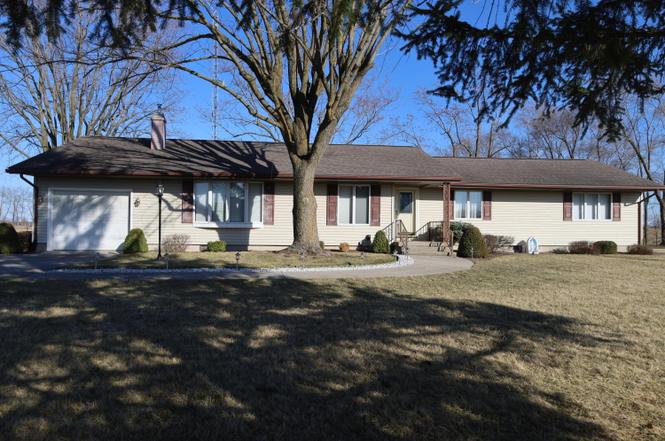
Up for public auction on April 9th, 2026 @ 6PM is a 3 bed, 1 1/2 bath home located at 1742 Flaler Road in Fort Recovery, Ohio 45846. This property was built in 1962 and sits on . 61 acres. This very well maintained home offers 1,729 square feet of living space with an enclosed sunroom, large living area with gas fireplace, one car attached garage, office and cement drive. Home comes complete with washer & dryer, refrigerator, stove, dishwasher and microwave. The outside offers a 27 x 17 heated shop with cement floor and 16 x 11 storage shed with cement floor. Nice patio area ties together the house and outbuildings. Many updates include roof in 2010, Kinetico water softener in 2000, h
Key facts
- Large living area
- Heated shop
- Enclosed sunroom
Tags
Neighborhood map
What this means for you Summary
Snapshot
- This is a 3-bed/1.5-bath single-family listed at $1.
Deal economics
- At list price, monthly cash flow is $-360 ($-4k/yr) — negative.
- The deal already cash-flows at list — no discount required.
- Meets the 1% rule at list price ($1k rent vs $1).
Location & tenants
- Location reads 69/100 on livability (#519 in OH) — a middle-class / working-renter tenant base. Strengths: schools A+, crime A+, cost of living A+; Watch: health & safety D, amenities F, commute F.
- Fort Recovery Local (rural): math 85% / reading 79% proficiency, ranked #43 of 656 in OH (top 7%) — strong family-tenant draw, lease renewals of 3-5y typical; only 10% free/reduced lunch — higher-income household profile.
- Market conditions: 2 active listings in the ZIP; solid renter incomes; 92 units permitted in Mercer County in 2024 (0 in 5+ unit buildings).
- This rent is only 16% of the median local income ($92k/yr) — well below the 30% rent-burden line; pricing power to push rent on renewal without tenant pushback.
Forward outlook
- Local home prices are declining (-3.0%/yr); year-one equity from $1k of loan paydown is wiped out by about $6k of value loss. Plan a longer hold.
- Mercer County population projected at -13% by 2050 — secular population decline; favor cash flow + early exit over multi-decade hold.
Negotiation context
- It's been on market 38 days — a 3% lower offer ($0) is reasonable based on typical stale-listing flexibility.
Risks & watch-outs
- Watch-outs: property tax is 285285.0% of price.
Questions for the listing agent
- What do current leases actually rent for vs. the listed asking? Can we see a recent rent roll and the last 12 months of T-12 income?
- It's been on market 38 days. Have you received any prior offers? Is the seller open to a 5% concession, seller financing, or rate buy-down credit?
- Built in 1962 — when were the roof, HVAC, electrical panel, plumbing, and water heater last replaced?
- Property tax is high relative to price — has the assessment been appealed recently, and will the sale trigger a re-assessment?
- Is there a deadline driving the sale (1031 exchange, divorce, estate, relocation)? That informs how much negotiation room exists.
- Schools are A-rated — typically a magnet for longer-tenancy family renters. What's the average tenant stay here, and is there a school-zone premium baked into asking?
- The area grade is low — what's the realistic commute time and amenity access for the typical tenant pool here? Any planned neighborhood developments (good or bad) we should know about?
- What's the average days-on-market for RENTAL listings here right now (not sales)? A rising rental-DOM trend means longer vacancies and softer asking-rent achievability than the comps imply.
- What's the recent tenant-quality profile in this submarket — average credit score on applications, eviction rate, late-payment / NSF rate, and stable-employment percentage? A property-management company in the area should have these aggregated.
- How much new for-sale + rental construction is in the pipeline within 1–3 miles? Heavy new supply typically softens prices + rents 12–24 months out; constrained supply supports both.
Investment metrics
- 1% rule
- 0.64% ✗
- Cap rate
- 4.02%
- Cash-on-cash
- -8.11%
- DSCR
- 0.64
- GRM
- 13.1
CMA / ARV
- ARV (on-the-fly)
- $190,190
- Comps found
- 3
Show comp detail 3 sales within ~0.75 mi
| Address | Dist | Beds/Ba | Sqft | Sold | Price | $/sf | Match |
|---|---|---|---|---|---|---|---|
| 1742 Flaler Rd | 0.00mi | 3/1.5 | 1,729 (0%) | 1mo | $300,000 | $174 | 99 |
| 201 Wiggs St | 0.70mi | 3/2.0 | 1,984 (+15%) | 8mo | $174,900 | $88 | 34 |
| 115 E Wiggs St | 0.72mi | 3/2.0 | 1,547 (-10%) | 18mo | $170,000 | $110 | 32 |
Match score weights: distance 35% · size 25% · config 20% · recency 20%. Top-matched comps best support the ARV.
Projected returns pro-forma
-3.0% appreciation · 3.0% rent growth · sell at horizon
- IRR
- -30.5%
- Equity multiple
- -0.01×
- Total profit
- $-53,727
- Equity at exit
- $28,358
- IRR
- -32.7%
- Equity multiple
- -0.43×
- Total profit
- $-76,232
- Equity at exit
- $16,444
Cash invested: $53,253 (down + closing). Projections, not guarantees.
Landlord ↔ Tenant lean methodology
- Overall (STATE)
- 73 Landlord-Friendly
- State Ohio
- 73 Landlord-Friendly · R+6
- County
- — inherits STATE
- City
- — inherits STATE
ZIP-level market 45846
- Home prices YoY
- -14.6%
- Active inventory
- 2
Monthly cashflow live
- Estimated rent
- $1,208 medium interval (Pro) →
- Mortgage (P&I)
- −$997
- Tax est. 1.5%
- −$238 /mo · $2,853/yr
- Insurance
- −$79
- HOA
- −$0
- Vacancy / Maint / Mgmt
- −$254
- Net cashflow
- $-360
Break-even live
Sensitivity live
| Price | -10% $-229 | -5% $-294 | +0% $-360 | +5% $-426 | +10% $-491 |
|---|---|---|---|---|---|
| Rent | -10% $-455 | -5% $-408 | +0% $-360 | +5% $-312 | +10% $-265 |
| Rate | -1.0pp $-264 | -0.5pp $-312 | base $-360 | +0.5pp $-409 | +1.0pp $-459 |
UW: 25.0% down · 7.5% · 30yr · 1.5% tax · 5.0% vac · 8.0% maint · 8.0% mgmt
Financing live
Cash to close
- Down payment
- $47,548
- Closing costs
- $5,706
- Reserves months
- —
- Total cash needed
- —
Loan-product check · same deal, 3 products live
Conventional
25% down · 7.5% · 30yr
- Down + closing
- —
- Monthly P&I
- —
- Monthly cashflow
- —
- DSCR
- —
- Eligible?
- —
Personal DTI + credit; lowest rate.
DSCR
20% down · 8.5% · 30yr
- Down + closing
- —
- Monthly P&I
- —
- Monthly cashflow
- —
- DSCR
- —
- Eligible?
- —
No personal income docs; deal must DSCR.
Hard money
10% down · 12.0% · 12mo
- Down + closing
- —
- Monthly P&I
- —
- Monthly cashflow
- —
- DSCR
- —
- Eligible?
- —
Short-term bridge; refi at stabilization.
Listing history 2 events
-
2026-04-10status Pending
-
2026-02-21$1 Active
ⓘ Source: listings_history table (triggers on properties + properties_extension) + one-shot
backfill from property_details.listing_events for pre-trigger history.
Climate risk First Street
- Flood 1/10 Low FEMA zone X (unshaded) · 0% chance over 30 yrs
- Wildfire 1/10 Low
- Heat 3/10 Moderate 7 d/yr ≥100°F today · 18 d/yr by 30 yrs out
- Wind 2/10 Low 0% chance of damaging wind over 30 yrs
- Air quality 3/10 Moderate 2 unhealthy d/yr today · 3 by 30 yrs out
Nearby sold comps map
Loading sold comps map…
Walkable amenities ~0.75 mi
Loading nearby amenities…
Taxation est. · year 1
- Rental income
- $14,497
- − Mortgage interest
- −$10,654
- − Property taxes
- −$2,853
- − Insurance
- −$951
- − Repairs & maintenance
- −$1,160
- − Management
- −$1,160
- − Depreciation
- −$5,533
- Taxable loss
- −$7,813
- Est. tax savings @ 24.0%
- +$1,875
- After-tax cash flow
- $-2,445/yr
For passive investors: Depreciation is non-cash, so a rental often shows a tax loss while cash-flowing — sheltering income. Rental losses are passive: they offset passive income freely, and up to $25,000/yr can offset ordinary (W-2) income if you actively participate and your MAGI is under $100k (phasing out to $0 by $150k); unused losses carry forward. On sale, claimed depreciation is recaptured at up to 25%, and gains may owe capital-gains tax (a 1031 exchange can defer both). Figures are a year-1 estimate at your 24.0% rate — not tax advice; consult a CPA.
Schools (NCES district)
- District
- Fort Recovery Local
- NCES district ID
- 3904859
- Math proficiency
- 85% ▲ 1.00%
- Reading proficiency
- 79% ▼ -3.00%
- Median HH income
- $61,985
- Composite
- 70.49/100
- National rank
- #262
- State rank
- #43 of 656 in OH
Livability — Fort Recovery
- Score
- 69/100
- State rank
- #519
- US rank
- #8803
Category grades
Schools grade is shown separately in the Schools card above.
Census & demographics
- County
- Mercer · 42,068 people
- Population (ZIP)
- 4,763
- Household income
- $92,273
- Rent vs Own
Population outlook (Mercer County) Hauer SSP2
- Today (2025)
- 40,163 people
- By 2030
- 39,367 · -2.0%
- By 2040
- 37,406 · -6.9%
- By 2050
- 34,917 · -13.1%
- By 2075
- 28,969 · -27.9%
- By 2100
- 21,338 · -46.9%
Race, ethnicity, and origin ACS 2023
- Neighborhood character
- Predominantly White (97%)
- Race & ethnicity
- White 97% Black 2% Hispanic / Latino 1%
- Common ancestry
- Lithuanian 3%
- Foreign-born
- 0%
- Languages at home
- 99% English-only · Spanish 1%
Political lean MEDSL · Mercer
- 2024 margin
- Solid R (+66.7) · D 16.3% · R 83.0%
- 2008→2024 swing
- -23.2pp toward R · 2008: -43.5pp · 2024: -66.7pp
- All cycles
- 2024: R+66.7 2020: R+64.9 2016: R+65.0 2012: R+54.8 2008: R+43.5
Not yet ingested
- Civics
- —
Market trends
- HPI YoY
- ▼ -39.97%
- Current HPI
- 234.7964
- Rent YoY
- —
- Metro
- —
- State GDP YoY
- ▲ 1.98%
- F500 in state
- 48
Industry mix (Fortune 500 HQ in OH)
| Industry | F500 HQs | Revenue |
|---|---|---|
| Insurance | 3 | $145B |
|
||
| Industrial Machinery | 3 | $49B |
|
||
| Financial Services | 3 | $24B |
|
||
| Consumer Goods | 2 | $93B |
|
||
| Aerospace / Defense | 2 | $47B |
|
||
| Utilities | 2 | $33B |
|
||
Property tax history
+3.9%/yrLatest (2024): $1,523 · -1.8% YoY. Source: county tax records.
Cash-flow waterfall
monthlySold comps — $/sqft
last 12 mo · ≤1 miLoading sold comps…